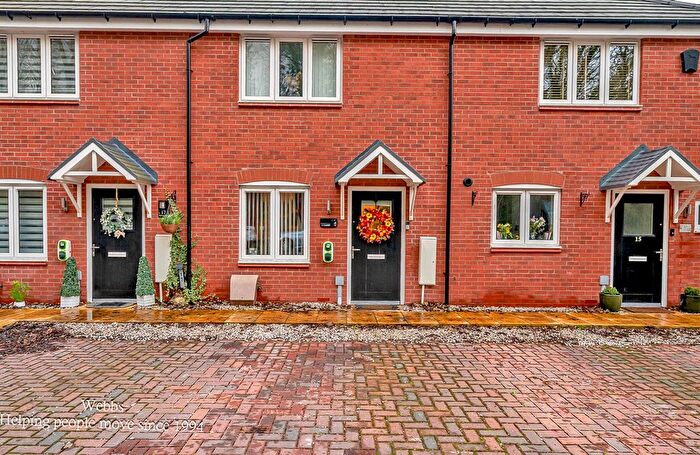
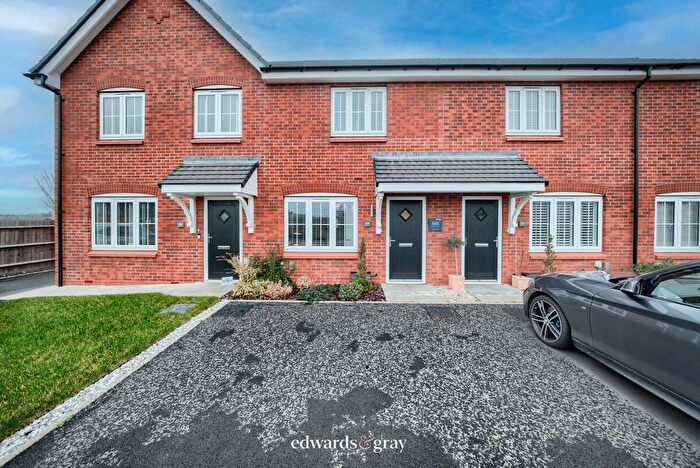
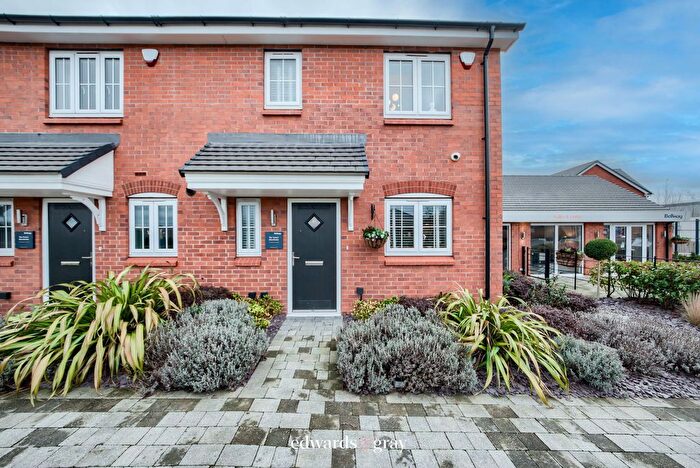
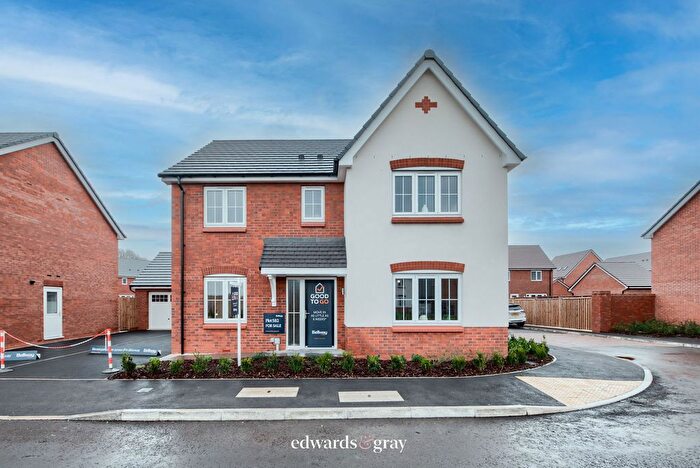
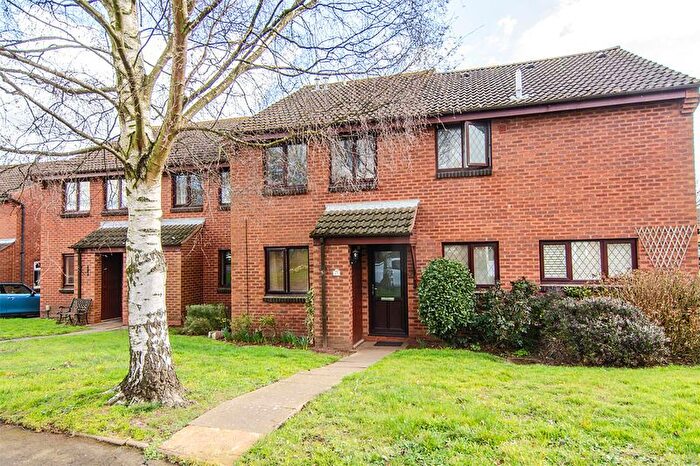
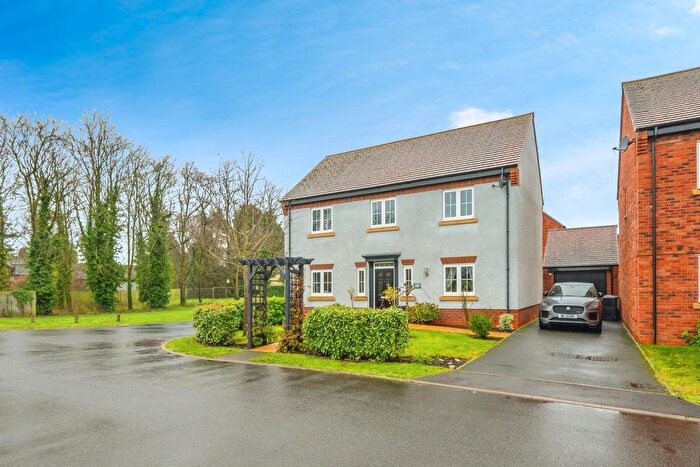
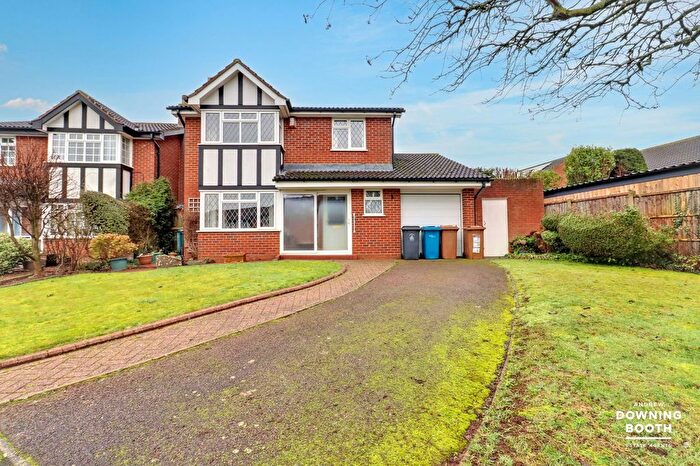
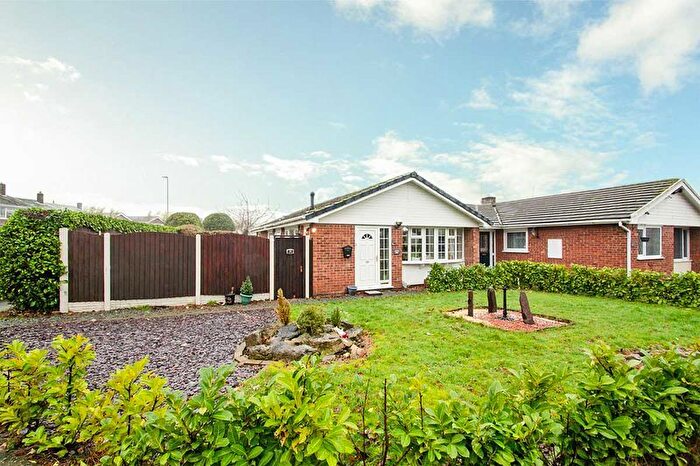
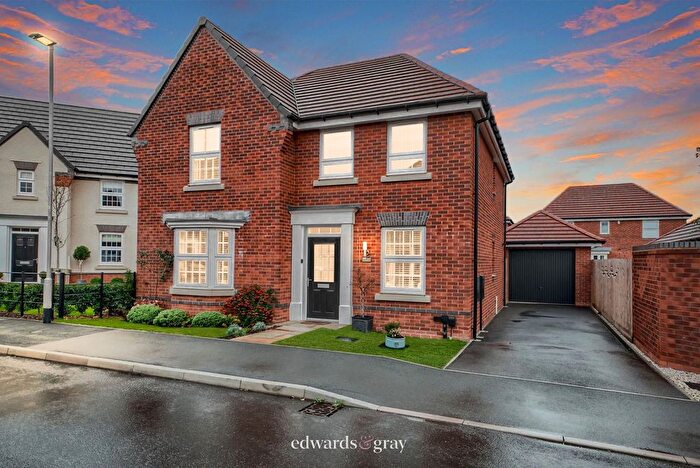
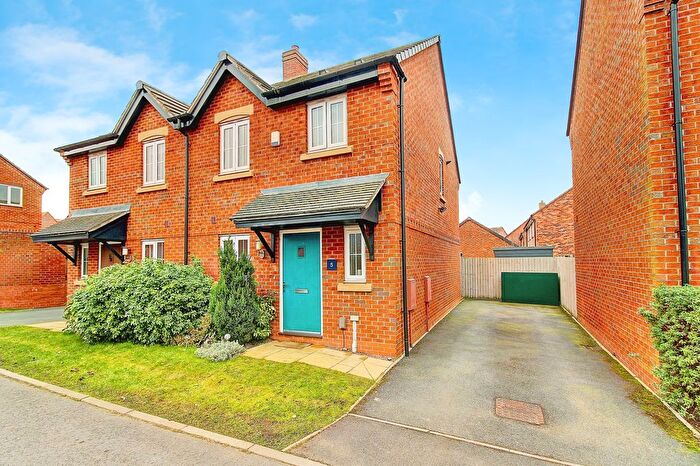
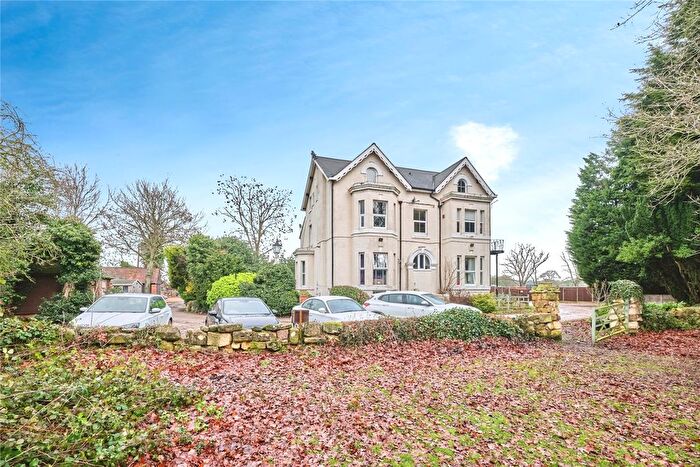
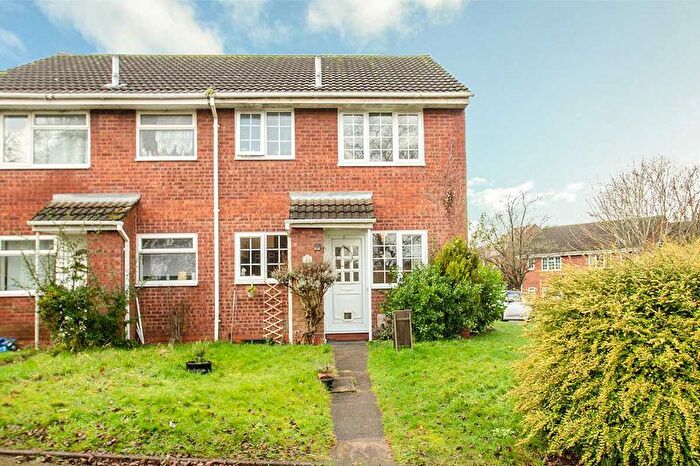
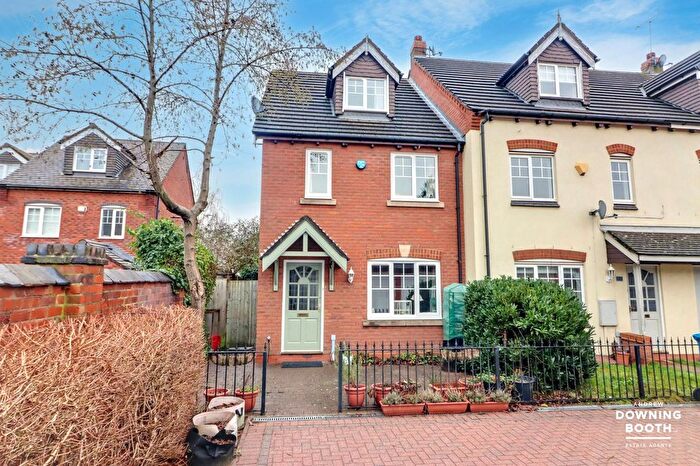
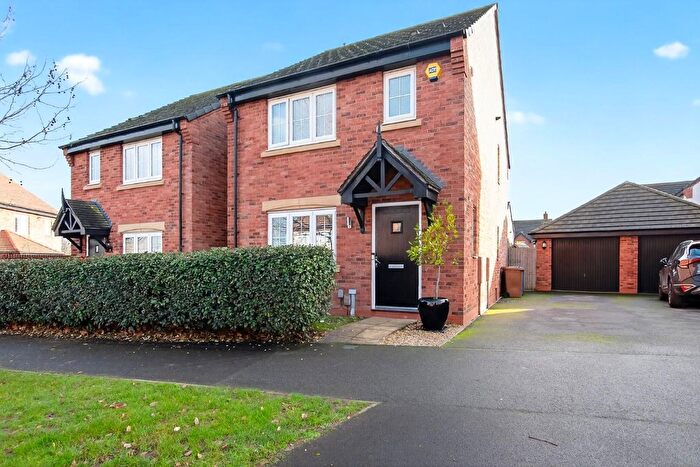
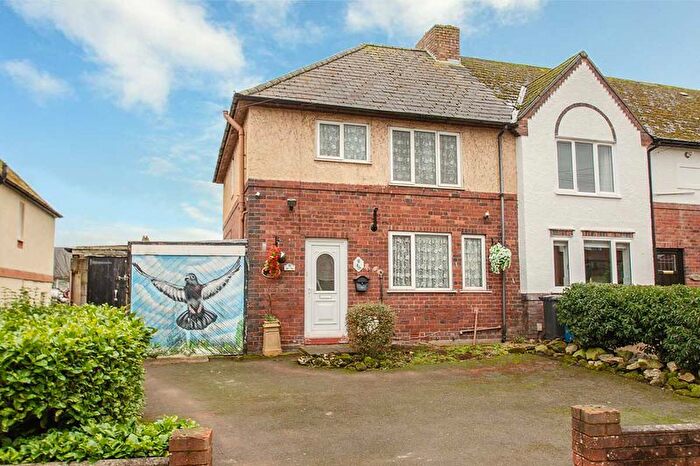
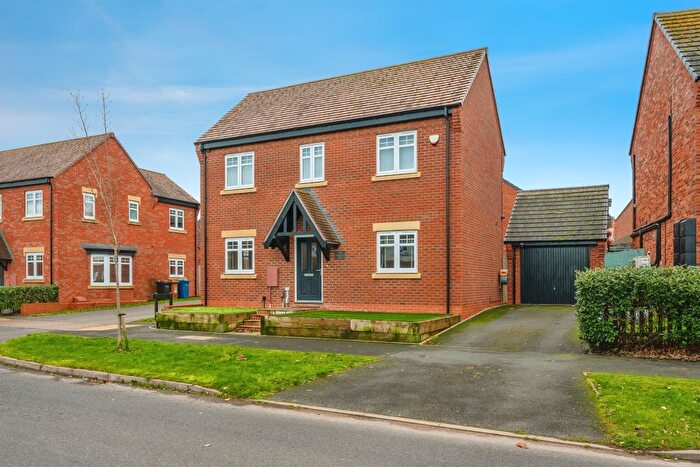
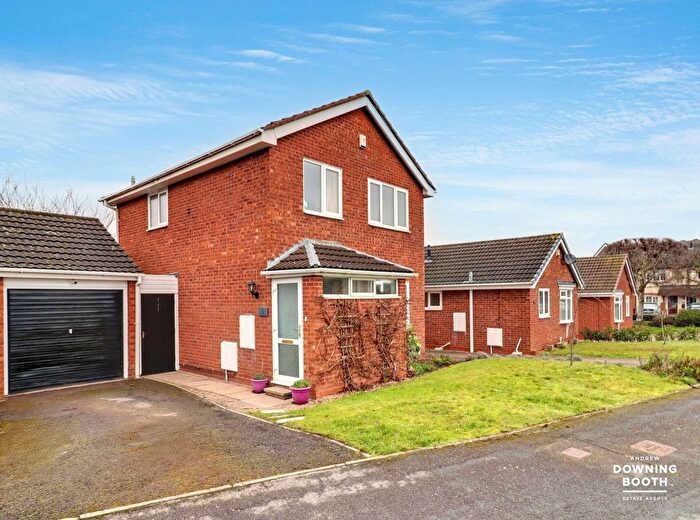
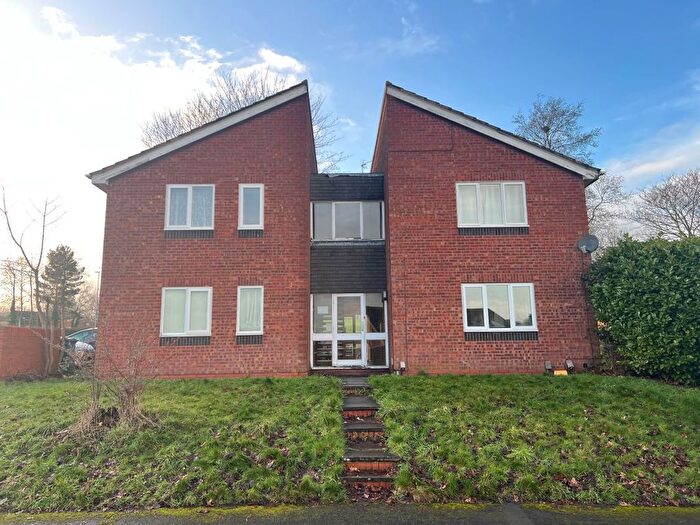
Houses for sale & to rent in Whittington, Lichfield
House Prices in Whittington
Properties in Whittington have an average house price of £399,997.00 and had 117 Property Transactions within the last 3 years¹.
Whittington is an area in Lichfield, Staffordshire with 1,188 households², where the most expensive property was sold for £1,290,000.00.
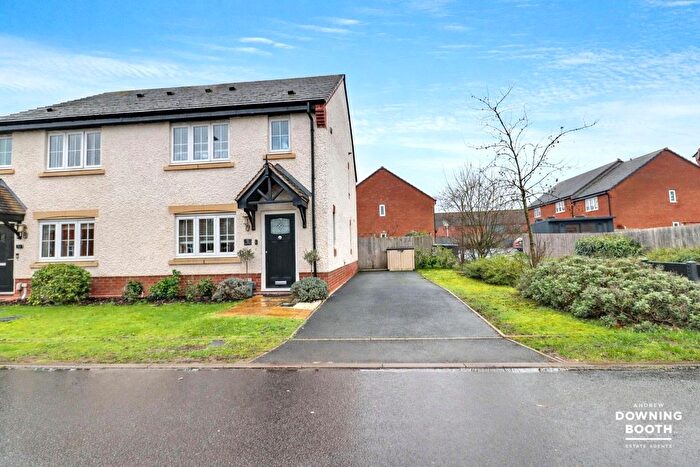
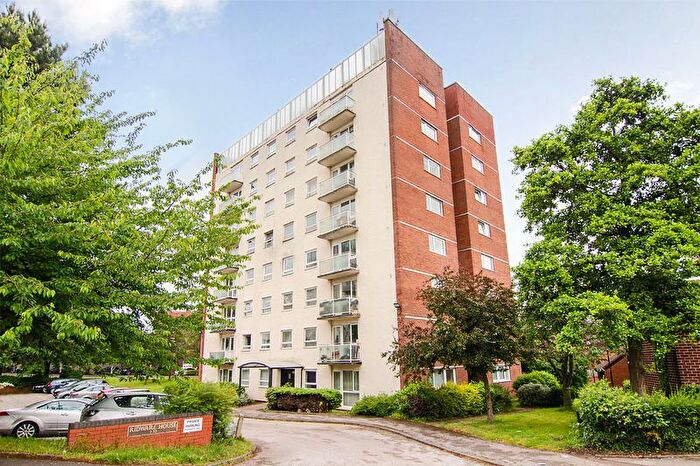
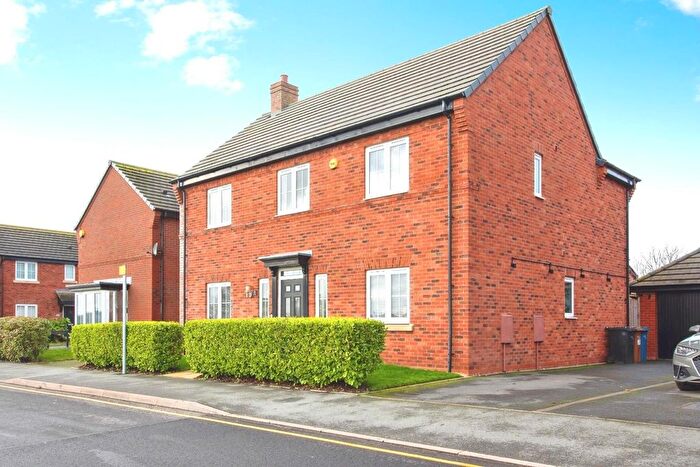
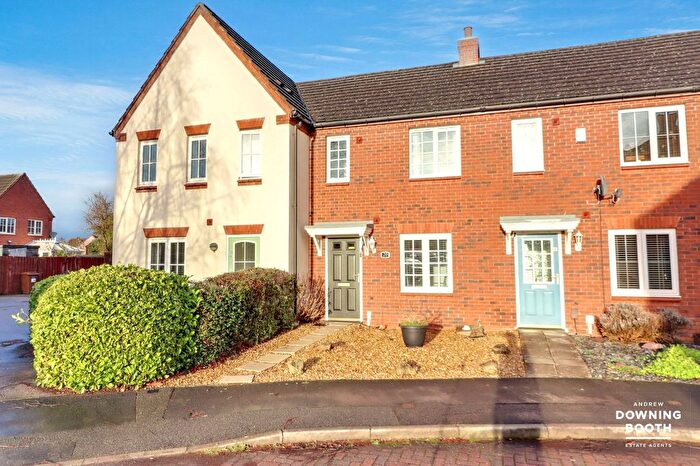
Properties for sale in Whittington
Previously listed properties in Whittington
Roads and Postcodes in Whittington
Navigate through our locations to find the location of your next house in Whittington, Lichfield for sale or to rent.
| Streets | Postcodes |
|---|---|
| Ashtree Lane | WS13 8NA WS13 8NB |
| Babbington Close | WS14 9LW |
| Back Lane | WS14 9NH WS14 9NL WS14 9SA |
| Bailye Close | WS13 8LD |
| Barley Croft | WS14 9LY |
| Beechwood | WS14 9PQ |
| Bexmore Drive | WS13 8LB |
| Bramley Way | WS14 9SB |
| Broad Lane | WS13 8QH |
| Brookhay Lane | WS13 8QL |
| Burton Old Road | WS13 8LF WS13 8LJ |
| Burton Road | WS13 8LP WS13 8LR WS13 8LU WS13 8LX WS13 8QA WS14 9NN WS14 9NP WS14 9NS |
| Cappers Lane | WS14 9JP |
| Chapel Lane | WS14 9JT |
| Church Street | WS14 9JX WS14 9LE |
| Cloister Walk | WS14 9LN |
| Common Lane | WS14 9LF |
| Darby Avenue | WS14 9NG |
| Darnford Lane | WS14 9JQ |
| Dyott Avenue | WS14 9NE WS14 9NF |
| Dyott Close | WS13 8LG |
| Falcon Drive | WS14 9PF |
| Fisherwick Close | WS14 9PD |
| Fisherwick Road | WS13 8PR WS13 8PS WS14 9JJ WS14 9JN WS14 9LH WS14 9LJ WS14 9LL |
| Fisherwick Wood Lane | WS13 8QF WS13 8QQ |
| Holland Close | WS13 8LA |
| Huddlesford Lane | WS14 9PL |
| Kestrel Close | WS14 9PE |
| Langton Crescent | WS14 9LR |
| Lichfield Road | WS14 9JZ |
| Lime Way | WS13 8RP |
| Main Street | WS14 9JR WS14 9JS WS14 9JU |
| Meadow Croft | WS13 8LE |
| Middleton Road | WS14 9NB |
| Neal Croft | WS14 9PH |
| Noddington Avenue | WS14 9NQ |
| Noddington Lane | WS14 9PA |
| Nottingham Road | WS14 9TG |
| Osprey Close | WS14 9HT |
| Park Lane | WS13 8QD |
| Pass Avenue | WS14 9NJ |
| Peregrine Close | WS14 9WA |
| Rayson Close | WS13 8RT |
| Rockfarm Road | WS14 9LZ |
| Sandy Lane | WS14 9PB |
| Spring Lane | WS14 9LX WS14 9NA |
| Swan Croft | WS14 9BF |
| Swan Road | WS14 9NU |
| Tamworth Road | WS14 9JE |
| The Beeches | WS14 9GZ |
| The Green | WS14 9LS WS14 9LT WS14 9LU |
| Vicarage Lane | WS14 9LQ |
| WS13 8EJ WS13 8EQ WS13 8PY WS13 8QW |
Transport near Whittington
- FAQ
- Price Paid By Year
- Property Type Price
Frequently asked questions about Whittington
What is the average price for a property for sale in Whittington?
The average price for a property for sale in Whittington is £399,997. This amount is 10% higher than the average price in Lichfield. There are 807 property listings for sale in Whittington.
What streets have the most expensive properties for sale in Whittington?
The streets with the most expensive properties for sale in Whittington are Cloister Walk at an average of £862,500, Bramley Way at an average of £775,000 and The Green at an average of £735,000.
What streets have the most affordable properties for sale in Whittington?
The streets with the most affordable properties for sale in Whittington are Chapel Lane at an average of £100,800, Nottingham Road at an average of £120,000 and Brookhay Lane at an average of £170,000.
Which train stations are available in or near Whittington?
Some of the train stations available in or near Whittington are Lichfield Trent Valley, Lichfield City and Shenstone.
Property Price Paid in Whittington by Year
The average sold property price by year was:
| Year | Average Sold Price | Price Change |
Sold Properties
|
|---|---|---|---|
| 2025 | £471,460 | 20% |
39 Properties |
| 2024 | £376,528 | 7% |
44 Properties |
| 2023 | £348,395 | -26% |
34 Properties |
| 2022 | £438,962 | 21% |
54 Properties |
| 2021 | £346,903 | 7% |
38 Properties |
| 2020 | £322,044 | -5% |
38 Properties |
| 2019 | £336,867 | 13% |
34 Properties |
| 2018 | £294,211 | -1% |
45 Properties |
| 2017 | £298,377 | 8% |
74 Properties |
| 2016 | £274,821 | 6% |
54 Properties |
| 2015 | £258,664 | -11% |
38 Properties |
| 2014 | £286,420 | 18% |
50 Properties |
| 2013 | £235,151 | -21% |
46 Properties |
| 2012 | £284,769 | 19% |
33 Properties |
| 2011 | £230,431 | -15% |
27 Properties |
| 2010 | £265,826 | 7% |
30 Properties |
| 2009 | £248,435 | -21% |
28 Properties |
| 2008 | £301,635 | 13% |
42 Properties |
| 2007 | £263,504 | 8% |
53 Properties |
| 2006 | £243,595 | 0,2% |
73 Properties |
| 2005 | £243,153 | 0,1% |
50 Properties |
| 2004 | £242,824 | 14% |
41 Properties |
| 2003 | £209,818 | 26% |
49 Properties |
| 2002 | £154,604 | 23% |
64 Properties |
| 2001 | £118,318 | -14% |
78 Properties |
| 2000 | £135,347 | 14% |
53 Properties |
| 1999 | £115,859 | 8% |
44 Properties |
| 1998 | £106,747 | 8% |
45 Properties |
| 1997 | £97,680 | -1% |
63 Properties |
| 1996 | £99,019 | 2% |
83 Properties |
| 1995 | £97,345 | - |
63 Properties |
Property Price per Property Type in Whittington
Here you can find historic sold price data in order to help with your property search.
The average Property Paid Price for specific property types in the last three years are:
| Property Type | Average Sold Price | Sold Properties |
|---|---|---|
| Semi Detached House | £371,242.00 | 32 Semi Detached Houses |
| Detached House | £532,651.00 | 43 Detached Houses |
| Terraced House | £321,842.00 | 32 Terraced Houses |
| Flat | £171,695.00 | 10 Flats |

