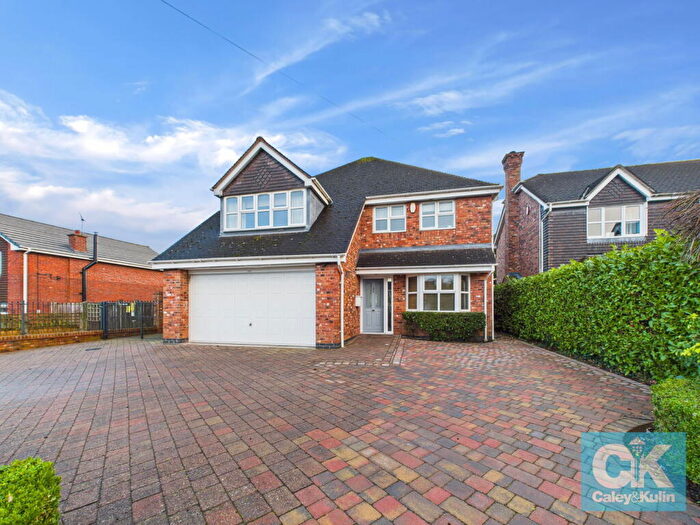
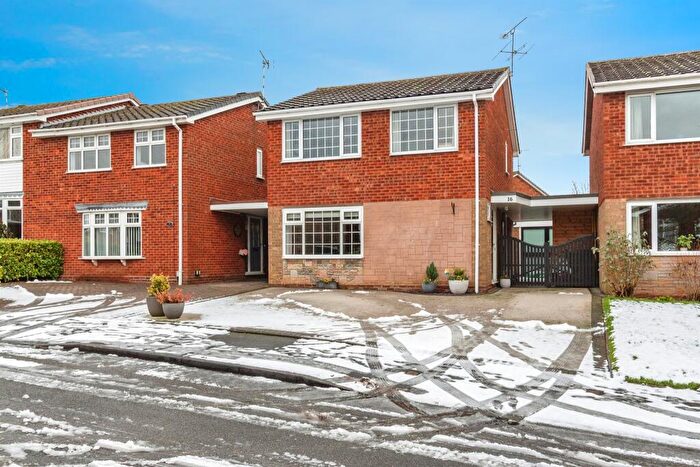
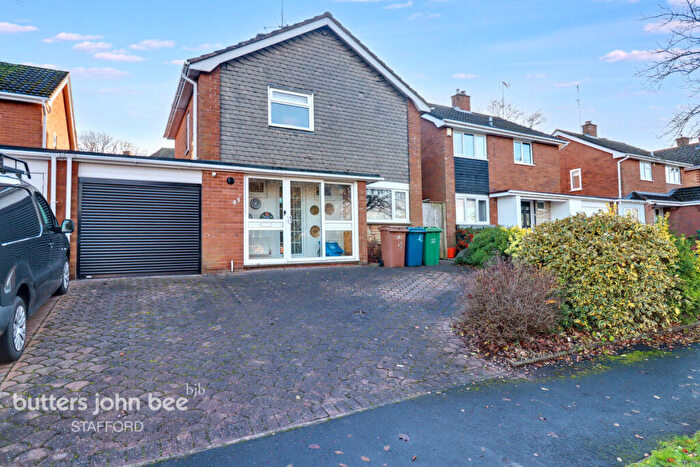
Houses for sale & to rent in Milford, Stafford
House Prices in Milford
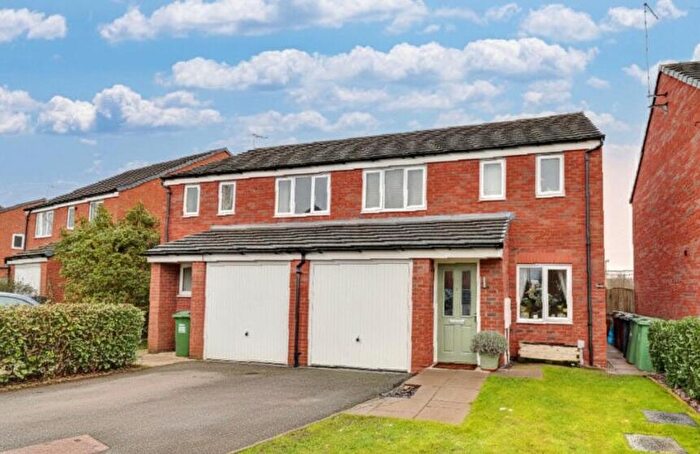
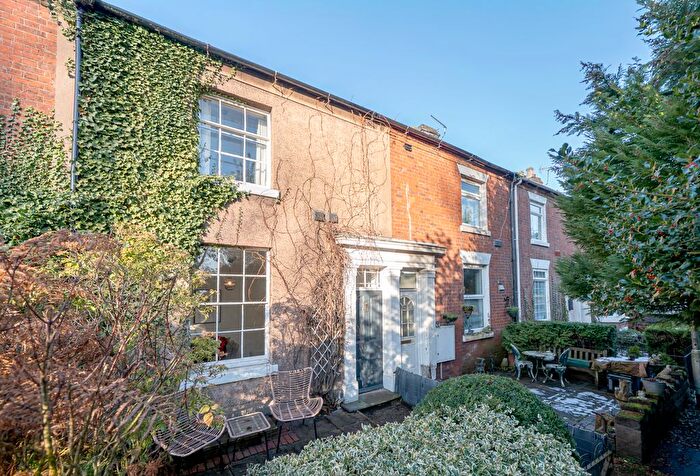
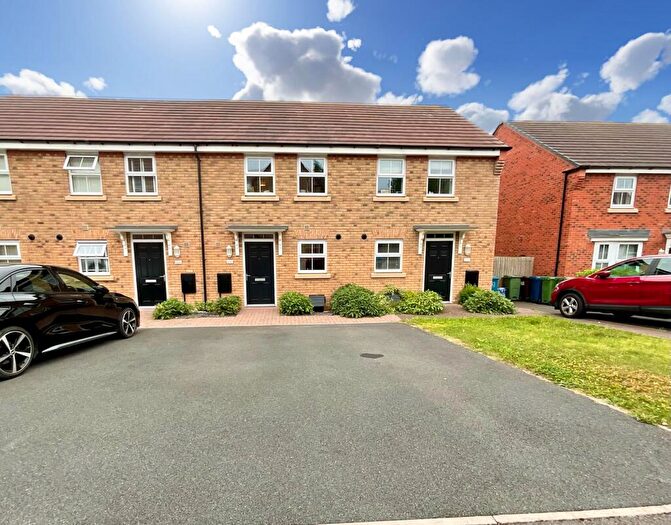
Properties in Milford have an average house price of £446,746.00 and had 211 Property Transactions within the last 3 years¹.
Milford is an area in Stafford, Staffordshire with 1,615 households², where the most expensive property was sold for £1,320,000.00.
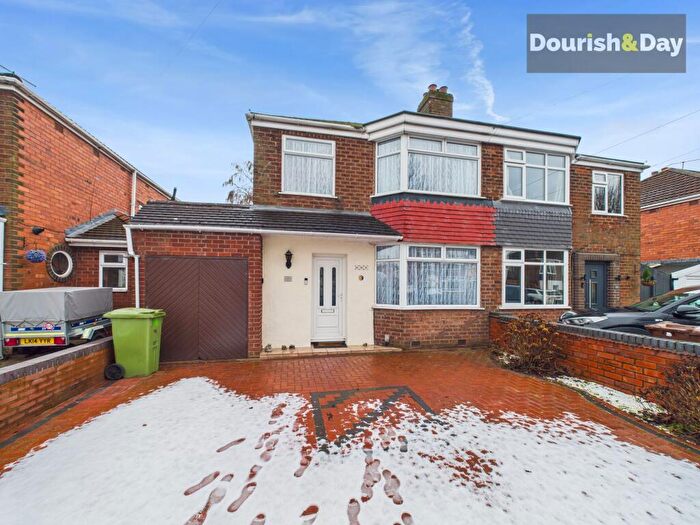
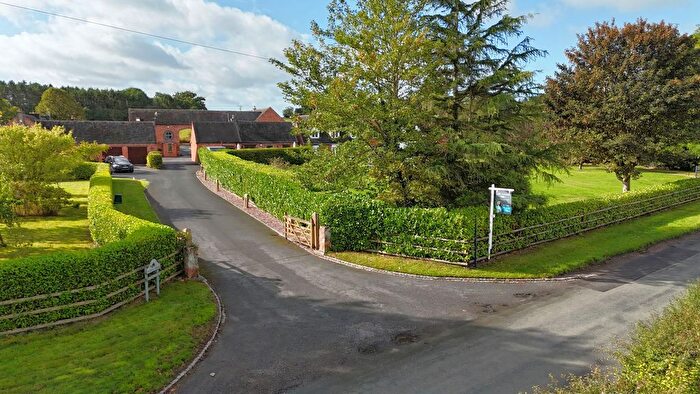
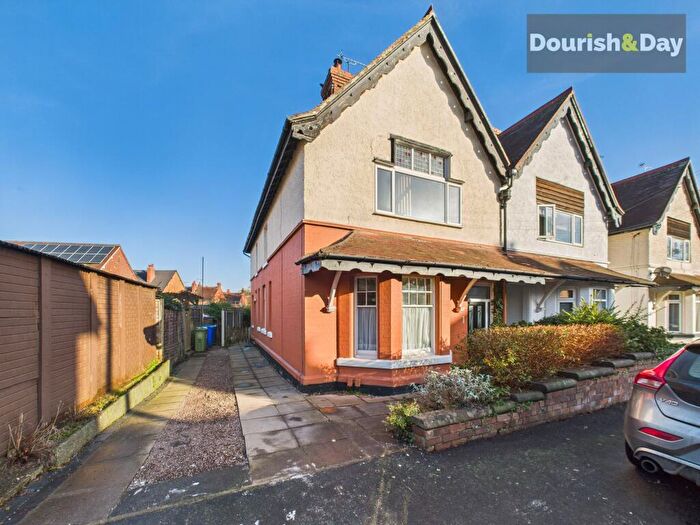
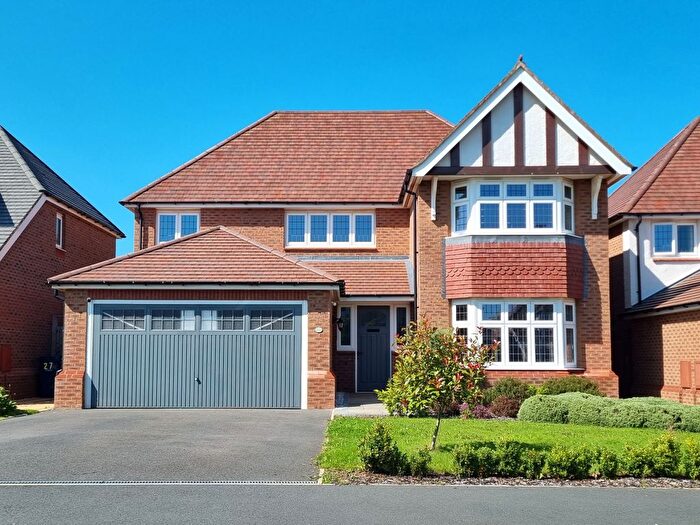
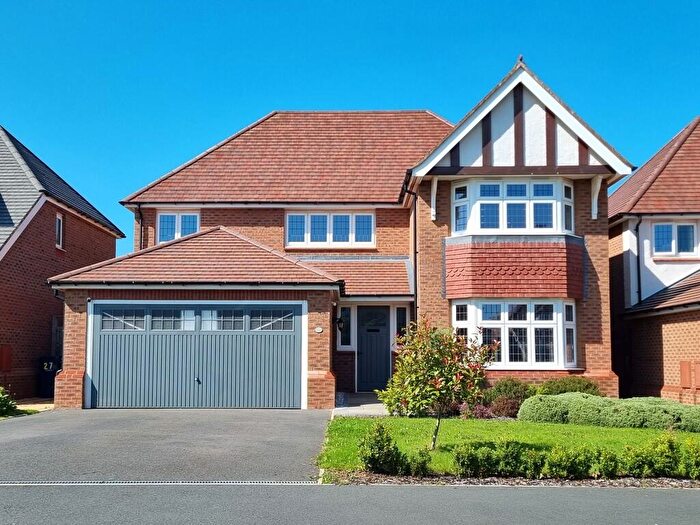
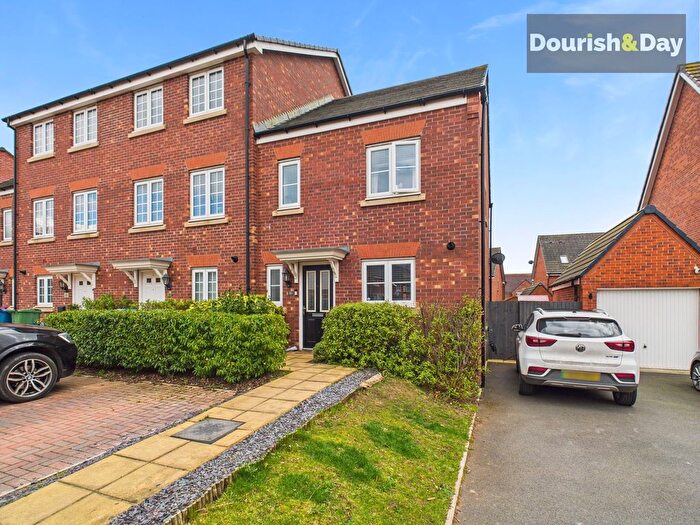
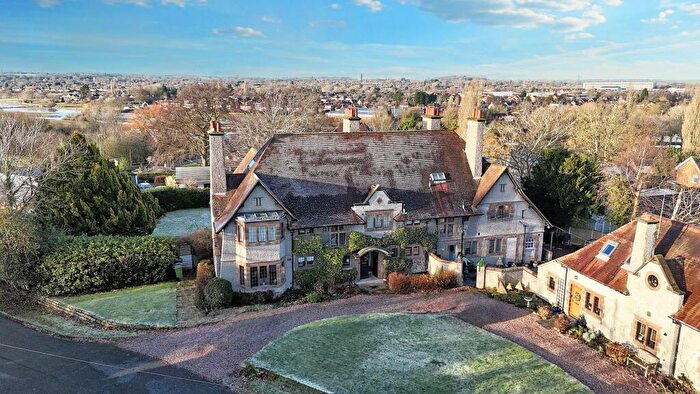
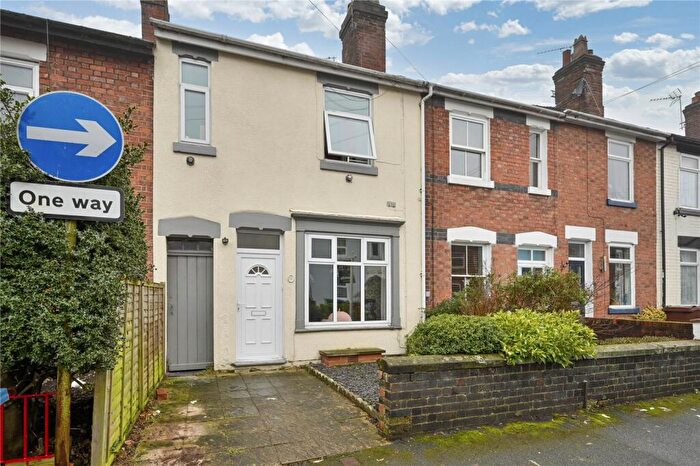
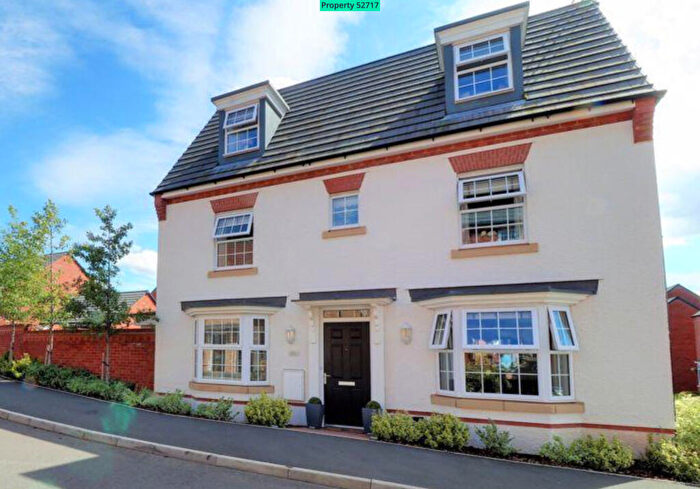
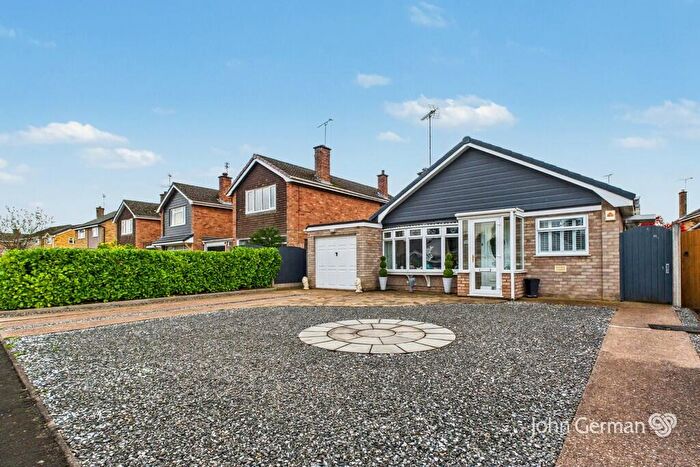
Properties for sale in Milford
Roads and Postcodes in Milford
Navigate through our locations to find the location of your next house in Milford, Stafford for sale or to rent.
| Streets | Postcodes |
|---|---|
| Anson Drive | ST17 0LT |
| Apple Tree Close | ST17 0WD |
| Baswich Lane | ST18 0YD |
| Battle Ridge | ST18 0BG |
| Beaconside | ST16 3JS |
| Birch Close | ST17 0LZ |
| Blenheim Close | ST18 0WB |
| Bluebell Hollow | ST17 0JN ST17 0JP |
| Bracken View | ST17 0TF |
| Brancote Cottages | ST18 0XX |
| Briar Close | ST17 0NG |
| Brick Kiln Lane | ST17 0TA |
| Broc Hill Way | ST17 0UB |
| Brocton Crescent | ST17 0SY |
| Brocton Heights | ST17 0TN |
| Brocton Lane | ST17 0NW |
| Brocton Road | ST17 0UH |
| Brook Lane | ST17 0TZ |
| Cannock Road | ST17 0SH ST17 0ST ST17 0SU ST17 0YY |
| Cedar Way | ST17 0LU ST17 0LY ST17 0NB |
| Chase Crescent | ST17 0TD |
| Chase Road | ST17 0TL |
| Congreve Close | ST17 0LN |
| Cromwell Close | ST18 0AT |
| Deer Hill | ST17 0UA |
| Deer Park Cottages | ST18 0BB |
| Elm Avenue | ST17 0NA |
| Green Gore Lane | ST17 0LD |
| Grosvenor Way | ST17 0NE |
| Hampton Gardens | ST18 0WD |
| Heather Close | ST17 0TG |
| Heather Hill | ST17 0TQ |
| Holdiford Road | ST17 0UX ST18 0XP |
| Holly Drive | ST17 0NH |
| Home Farm Court | ST18 0PZ |
| Honeysuckle Rise | ST17 0JR |
| Hoo Mill Lane | ST18 0RG |
| Hopton Hall Lane | ST18 0AZ |
| Ingestre Park Road | ST18 0ZF |
| Kings Drive | ST18 0AJ |
| Kitlings Lane | ST17 0LE |
| Lazar Lane | ST17 0UJ |
| Lower Lane | ST18 0AN |
| Main Road | ST17 0UL ST17 0UN ST17 0UW |
| Meadow Sweet Drive | ST17 0JL |
| Milford Road | ST17 0JU ST17 0JY ST17 0LA ST17 0LB |
| Mount Edge | ST18 0TG |
| New Inn Row | ST17 0SZ |
| Oak Avenue | ST17 0LX |
| Oakover Grange | ST17 0NN |
| Old Acre Lane | ST17 0TW |
| Old Coach Lane | ST17 0TU |
| Old Croft Road | ST17 0LS ST17 0NJ ST17 0NL |
| Park Lane | ST17 0TS |
| Pine Crescent | ST17 0ND ST17 0NF |
| Pool Lane | ST17 0TR ST17 0TY ST17 0UD |
| Railway Terrace | ST17 0UY |
| Sandon Road | ST18 9TH |
| Sawpit Lane | ST17 0TE ST17 0TH ST17 0TJ |
| School Lane | ST17 0LF |
| Sherbrook Close | ST17 0TB |
| St Thomas Lane | ST18 0YF |
| St Thomas Priory | ST18 0ZJ |
| The Crescent | ST17 0JZ |
| The Green | ST17 0TP ST17 0UR |
| The Priory | ST18 0ZH |
| The Rise | ST17 0LH ST17 0LJ |
| The Village | ST17 0LQ ST17 0LR |
| Tixall Court | ST18 0XN |
| Tixall Road | ST17 0UU ST18 0XY |
| Village Gardens | ST17 0LL |
| Walton Lane | ST17 0TT |
| Waltonbury Close | ST17 0LP |
| Waltonmead Close | ST17 0LW |
| Weston Road | ST18 0BD |
| Willow Close | ST17 0NQ |
| Wilmore Court | ST18 0AF |
| Wilmore Hill Lane | ST18 0AW |
| Within Lane | ST18 0AP ST18 0AY |
| ST17 0LG ST17 0TX ST18 0AH ST18 0AL ST18 0RE ST18 0XS ST18 0XT ST18 0XU ST17 0JX ST17 0SS ST17 0UP |
Transport near Milford
-
Stafford Station
-
Penkridge Station
-
Rugeley Trent Valley Station
-
Rugeley Town Station
-
Hednesford Station
-
Cannock Station
-
Stone Station
-
Landywood Station
- FAQ
- Price Paid By Year
- Property Type Price
Frequently asked questions about Milford
What is the average price for a property for sale in Milford?
The average price for a property for sale in Milford is £446,746. This amount is 64% higher than the average price in Stafford. There are 6,582 property listings for sale in Milford.
What streets have the most expensive properties for sale in Milford?
The streets with the most expensive properties for sale in Milford are Holdiford Road at an average of £1,320,000, Chase Road at an average of £912,500 and Broc Hill Way at an average of £849,575.
What streets have the most affordable properties for sale in Milford?
The streets with the most affordable properties for sale in Milford are Kitlings Lane at an average of £236,500, Birch Close at an average of £243,500 and Oak Avenue at an average of £267,500.
Which train stations are available in or near Milford?
Some of the train stations available in or near Milford are Stafford, Penkridge and Rugeley Trent Valley.
Property Price Paid in Milford by Year
The average sold property price by year was:
| Year | Average Sold Price | Price Change |
Sold Properties
|
|---|---|---|---|
| 2025 | £495,156 | 9% |
32 Properties |
| 2024 | £449,878 | -0,1% |
54 Properties |
| 2023 | £450,463 | 8% |
65 Properties |
| 2022 | £414,080 | 6% |
60 Properties |
| 2021 | £390,350 | 13% |
76 Properties |
| 2020 | £338,469 | -3% |
75 Properties |
| 2019 | £350,103 | -6% |
87 Properties |
| 2018 | £372,854 | 8% |
82 Properties |
| 2017 | £342,378 | 12% |
50 Properties |
| 2016 | £301,018 | -12% |
60 Properties |
| 2015 | £338,149 | 10% |
60 Properties |
| 2014 | £305,844 | 17% |
55 Properties |
| 2013 | £252,930 | 2% |
59 Properties |
| 2012 | £247,624 | -12% |
41 Properties |
| 2011 | £276,149 | 1% |
62 Properties |
| 2010 | £272,862 | 9% |
49 Properties |
| 2009 | £248,758 | -31% |
48 Properties |
| 2008 | £327,100 | 10% |
40 Properties |
| 2007 | £295,146 | 13% |
77 Properties |
| 2006 | £255,947 | -1% |
89 Properties |
| 2005 | £257,806 | 3% |
77 Properties |
| 2004 | £249,836 | 10% |
100 Properties |
| 2003 | £224,148 | 3% |
122 Properties |
| 2002 | £216,332 | 26% |
94 Properties |
| 2001 | £160,150 | -1% |
47 Properties |
| 2000 | £161,245 | 16% |
54 Properties |
| 1999 | £134,772 | 7% |
66 Properties |
| 1998 | £125,016 | 3% |
55 Properties |
| 1997 | £121,616 | 25% |
73 Properties |
| 1996 | £91,749 | -27% |
50 Properties |
| 1995 | £116,833 | - |
40 Properties |
Property Price per Property Type in Milford
Here you can find historic sold price data in order to help with your property search.
The average Property Paid Price for specific property types in the last three years are:
| Property Type | Average Sold Price | Sold Properties |
|---|---|---|
| Semi Detached House | £337,776.00 | 34 Semi Detached Houses |
| Detached House | £505,121.00 | 140 Detached Houses |
| Terraced House | £329,200.00 | 35 Terraced Houses |
| Flat | £270,000.00 | 2 Flats |

