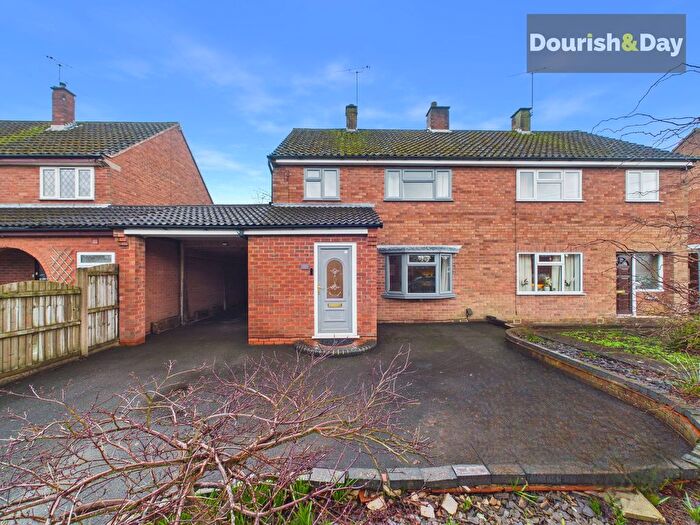
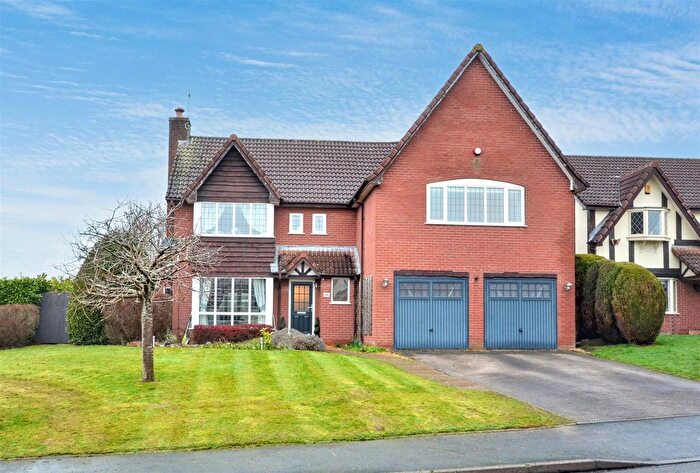
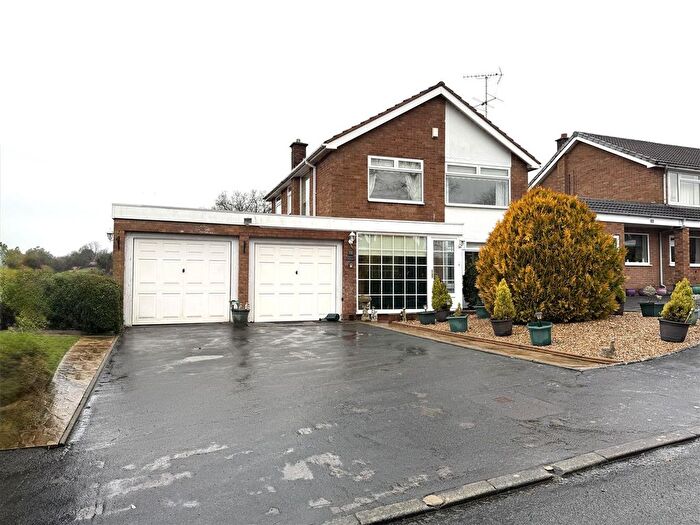
Houses for sale & to rent in Milwich, Stafford
House Prices in Milwich
Properties in Milwich have an average house price of £367,976.00 and had 73 Property Transactions within the last 3 years¹.
Milwich is an area in Stafford, Staffordshire with 509 households², where the most expensive property was sold for £1,315,000.00.
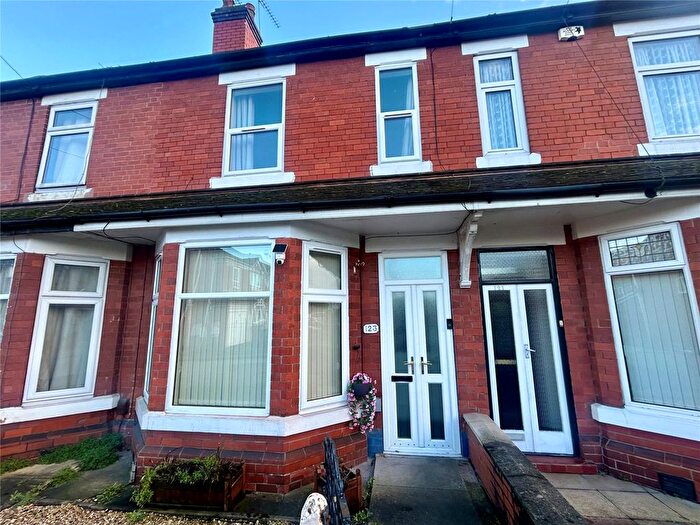
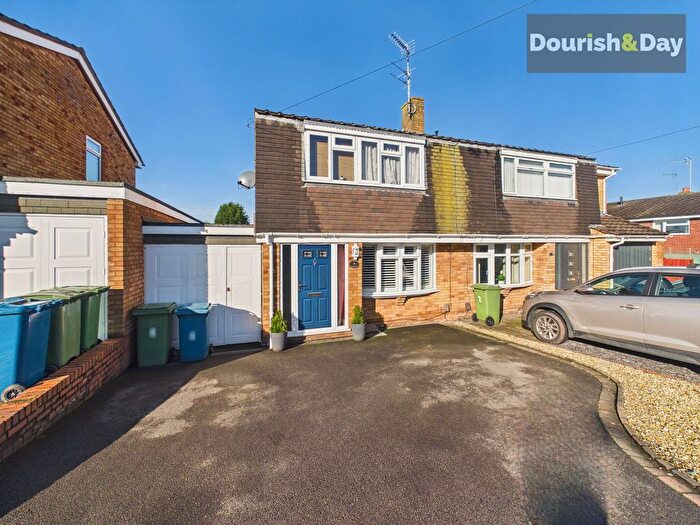
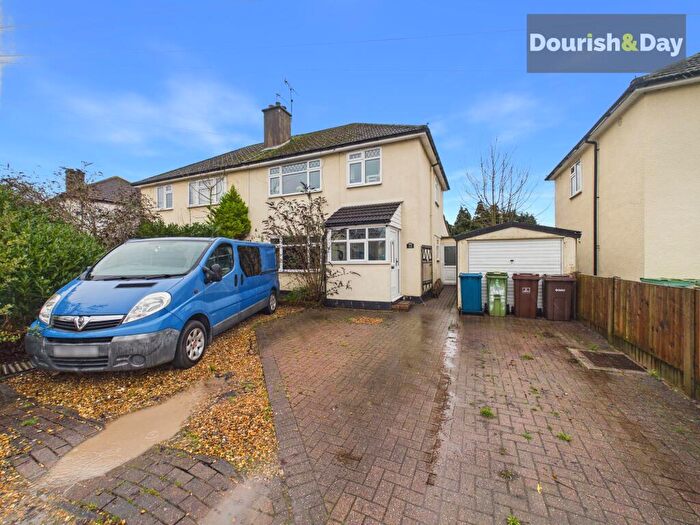
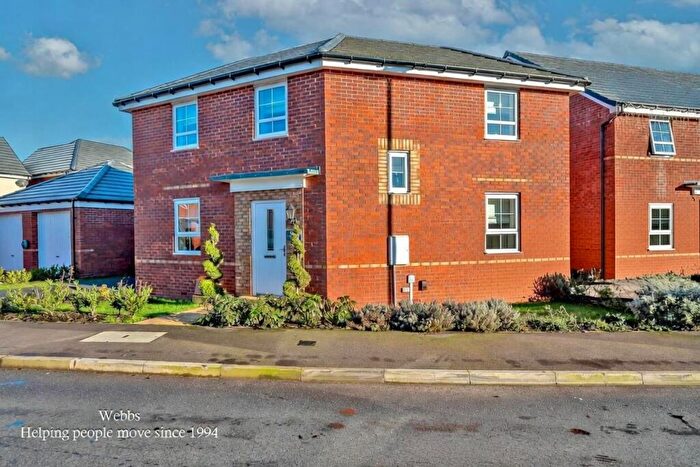
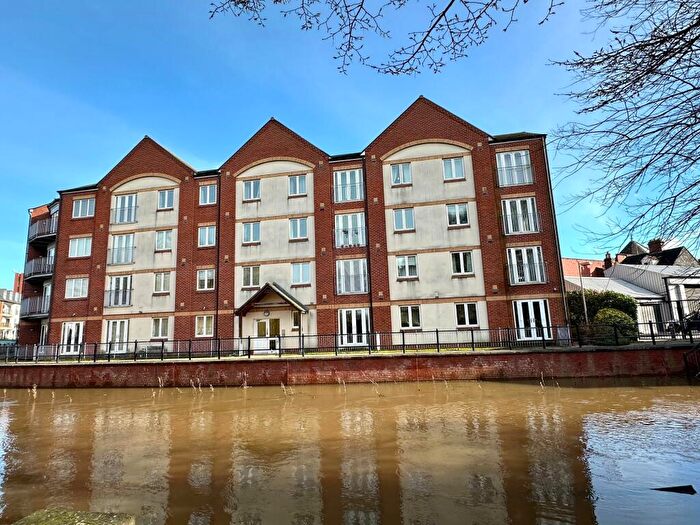
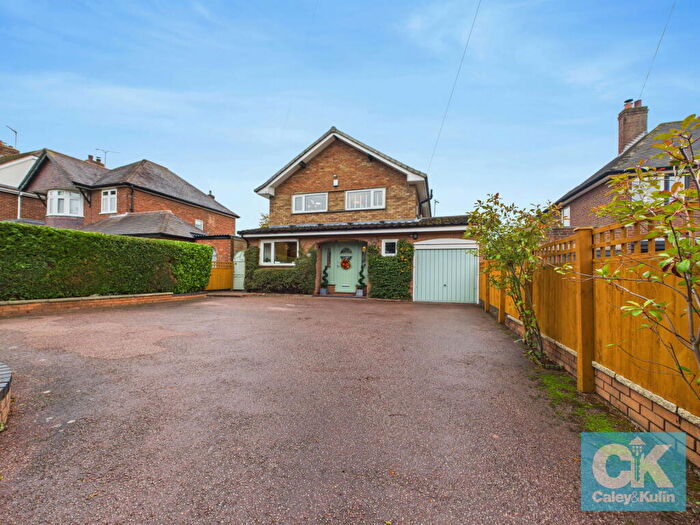
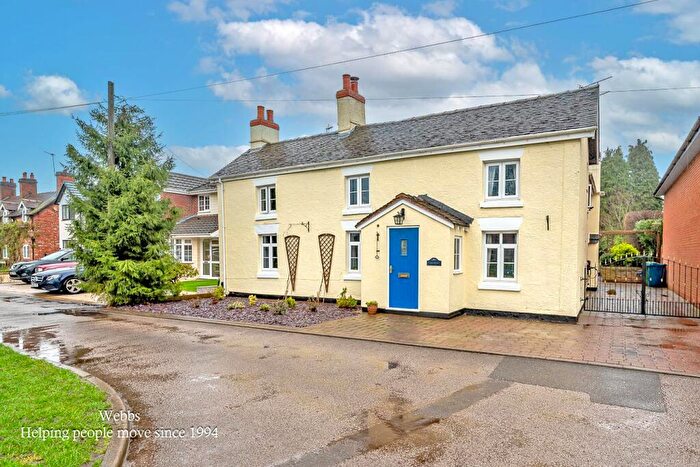
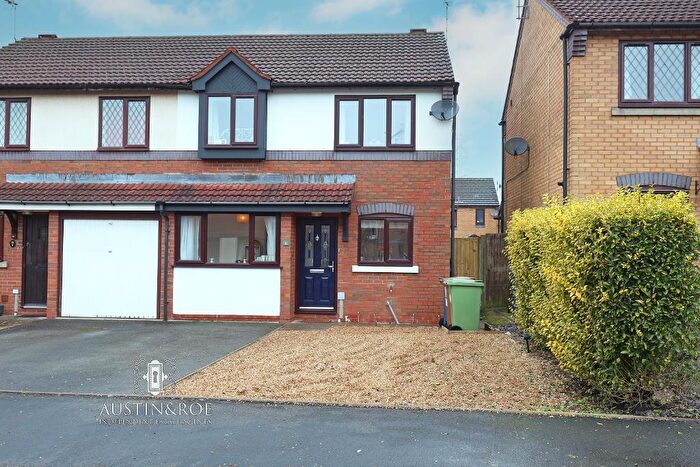
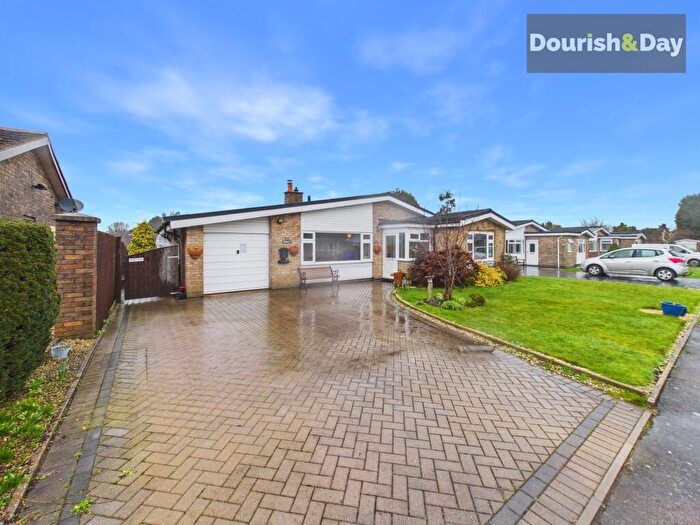
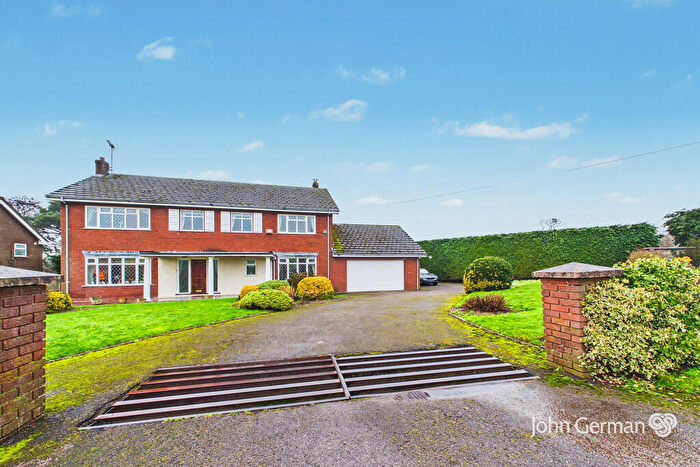
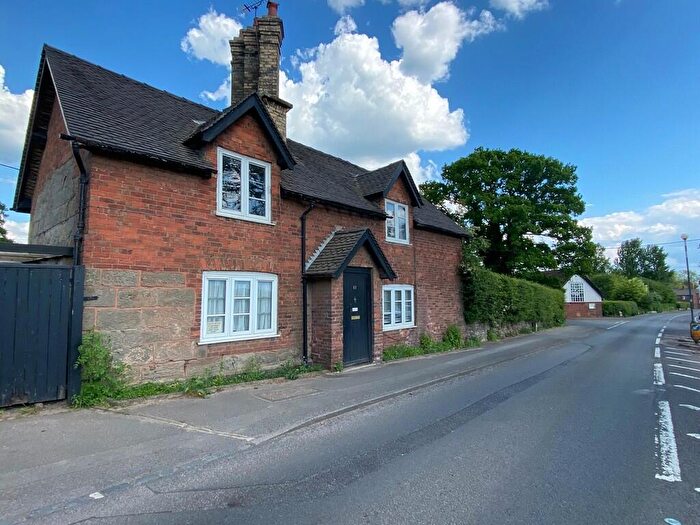
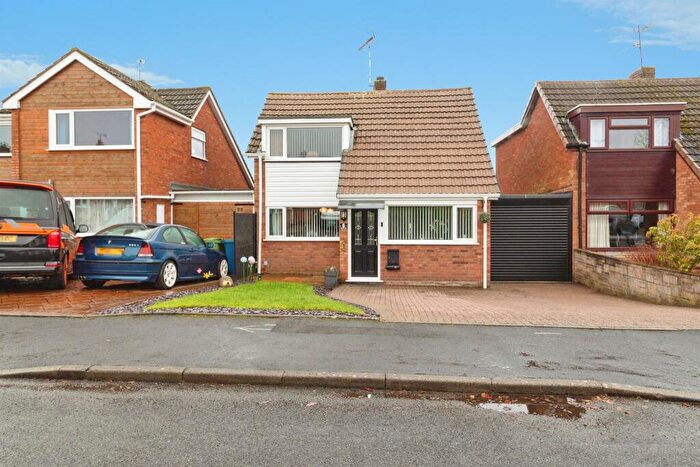
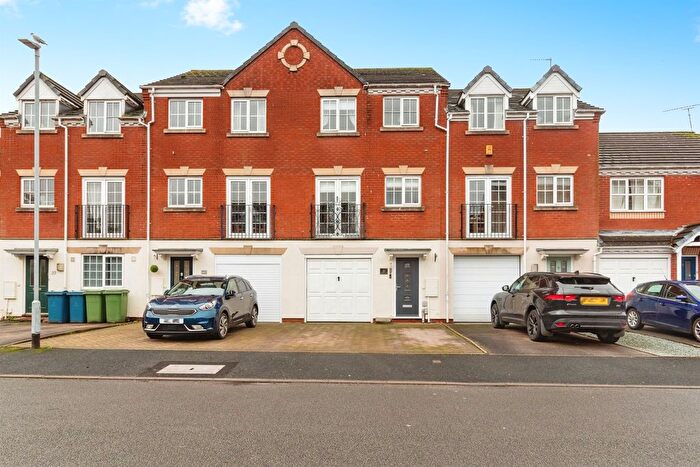
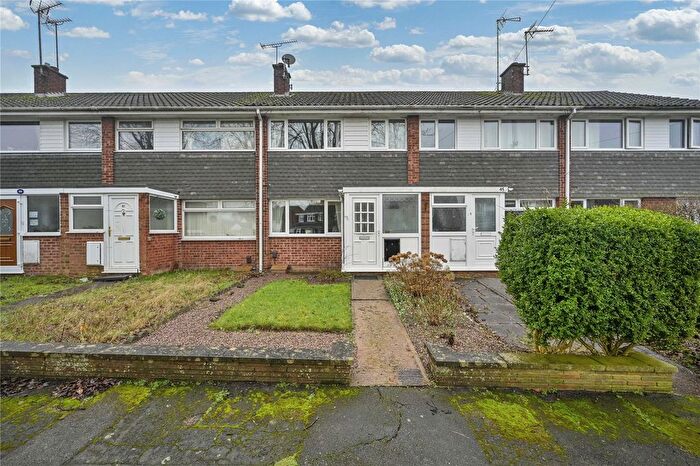
Properties for sale in Milwich
Roads and Postcodes in Milwich
Navigate through our locations to find the location of your next house in Milwich, Stafford for sale or to rent.
| Streets | Postcodes |
|---|---|
| Abbeylands | ST18 0DF |
| Alcester Row | ST18 0YX |
| Allways Close | ST18 0BQ |
| Anson Court | ST18 0GB |
| Archford Gardens | ST18 0ZR |
| Audlem Road | ST18 0GN |
| Avondale Circle | ST18 0YZ |
| Bayswater Square | ST18 0YH |
| Beacon Business Park | ST18 0DG ST18 0WL |
| Beaconside | ST18 0AE ST18 0AQ ST18 0XQ |
| Blackheath Lane | ST18 0YB ST18 0YG |
| Brereton Way | ST18 0XF |
| Bupton Road | ST18 0EF |
| Callowhill Place | ST18 0GD |
| Cherry Lane | ST18 0HH |
| Church Lane | ST18 0ZP ST18 0DB |
| Coton | ST18 0EH ST18 0EQ ST18 0ET |
| Coton Hayes | ST18 0HB ST18 0EJ |
| Darley Avenue | ST18 0DQ |
| Dewsbury Crescent | ST18 0YW ST18 0ZS ST18 0ZT ST18 0ZU ST18 0ZW |
| Donisthorpe Place | ST18 0EE |
| Doulton Road | ST18 0TN |
| Dyson Wayshire Technology Park | ST18 0TW |
| Garshall Green | ST18 0EP |
| Gates Courtshire Technology Park | ST18 0AR ST18 0GU |
| Gillette Close | ST18 0LQ |
| Hadley Green | ST18 0ZA |
| Hanyards Lane | ST18 0YA |
| Hargreaves Court | ST18 0WN |
| Hertford Place | ST18 0ZB |
| Hilderstone Road | ST18 0DX ST18 0DY ST18 0DZ ST18 0EB |
| Holden Park | ST18 0ZQ |
| Hunters Court | ST18 0BU |
| Hydrant Way | ST18 0DD |
| Lakhpur Courtshire Technology Park | ST18 0FX |
| Lanchester Courtshire Technology Park | ST18 0WT |
| Lichfield Road | ST18 0DN |
| Marconi Gate | ST18 0FZ |
| Marston Gate | ST18 9SZ |
| Marston Lane | ST18 9FH |
| Mill Lane | ST18 0EU |
| Milwich Heath | ST18 0EN |
| Moor Lane | ST18 0JF |
| Nelson Court | ST18 0WQ |
| New Road | ST18 0HP |
| Northburgh Avenue | ST18 0GW |
| Oberton Gardens | ST18 0FJ |
| Old Hill Lane | ST18 0XR |
| Orchard Caravan Site | ST18 0AU |
| Parker Court | ST18 0WP |
| Quinton Gardens | ST18 0GG |
| Ridgway Close | ST18 0TJ |
| Rutherford Courtshire Technology Park | ST18 0GP |
| Salt Banks | ST18 0BL |
| Sandon Bank | ST18 9TE |
| Shruggs Lane | ST18 0GZ |
| Small Rice | ST18 0EA |
| Spencer Close | ST18 0JD |
| Spode Avenue | ST18 0TQ |
| Stafford Road | ST18 0HS |
| Stone Road | ST18 0HA |
| Summer Hill | ST18 0EL |
| Tixall Road | ST18 0XZ |
| Wedgwood Road | ST18 0TL |
| Weston Road | ST18 0AA ST18 0AB ST18 0BF ST18 0FL ST18 0YY |
| Wheatlow Brooks | ST18 0EW |
| Whittle Rise | ST18 0GE |
| Whittle Riseshire Technology Park | ST18 0ES |
| Winton Vale | ST18 0YT |
| Wolseley Court | ST18 0GA |
| Yew Tree Grange | ST18 0GX |
| ST18 0DH ST18 0DR ST18 0DS ST18 0DT ST18 0EG ST18 0EX ST18 0EY ST18 0HD ST14 8SF ST18 0AS ST18 0AX ST18 0BY ST18 0BZ ST18 0DA ST18 0DE ST18 0DJ ST18 0DL ST18 0DP ST18 0DU ST18 0DW ST18 0ED ST18 0HG ST18 0HW ST18 0LE ST18 0LN ST18 0RF ST18 0XJ ST18 9SF ST18 9SU |
Transport near Milwich
-
Stafford Station
-
Stone Station
-
Rugeley Trent Valley Station
-
Rugeley Town Station
-
Penkridge Station
-
Blythe Bridge Station
-
Hednesford Station
-
Uttoxeter Station
- FAQ
- Price Paid By Year
- Property Type Price
Frequently asked questions about Milwich
What is the average price for a property for sale in Milwich?
The average price for a property for sale in Milwich is £367,976. This amount is 35% higher than the average price in Stafford. There are more than 10,000 property listings for sale in Milwich.
What streets have the most expensive properties for sale in Milwich?
The streets with the most expensive properties for sale in Milwich are Coton Hayes at an average of £887,000, Audlem Road at an average of £492,400 and Garshall Green at an average of £483,833.
What streets have the most affordable properties for sale in Milwich?
The streets with the most affordable properties for sale in Milwich are Archford Gardens at an average of £177,500, Bayswater Square at an average of £185,000 and Dewsbury Crescent at an average of £270,500.
Which train stations are available in or near Milwich?
Some of the train stations available in or near Milwich are Stafford, Stone and Rugeley Trent Valley.
Property Price Paid in Milwich by Year
The average sold property price by year was:
| Year | Average Sold Price | Price Change |
Sold Properties
|
|---|---|---|---|
| 2025 | £399,925 | 10% |
20 Properties |
| 2024 | £359,092 | 2% |
27 Properties |
| 2023 | £352,625 | -3% |
26 Properties |
| 2022 | £361,621 | 4% |
53 Properties |
| 2021 | £346,432 | 11% |
54 Properties |
| 2020 | £309,608 | -4% |
61 Properties |
| 2019 | £323,461 | 6% |
123 Properties |
| 2018 | £303,535 | 8% |
116 Properties |
| 2017 | £278,629 | 4% |
95 Properties |
| 2016 | £268,046 | 1% |
100 Properties |
| 2015 | £265,168 | -47% |
43 Properties |
| 2014 | £389,727 | 13% |
11 Properties |
| 2013 | £338,125 | 17% |
4 Properties |
| 2012 | £279,250 | -2% |
6 Properties |
| 2011 | £284,000 | 47% |
8 Properties |
| 2010 | £151,333 | -67% |
3 Properties |
| 2009 | £252,500 | -16% |
5 Properties |
| 2008 | £292,500 | -38% |
4 Properties |
| 2007 | £402,813 | 34% |
11 Properties |
| 2006 | £264,062 | -145% |
8 Properties |
| 2005 | £647,500 | 59% |
5 Properties |
| 2004 | £266,807 | 18% |
13 Properties |
| 2003 | £219,400 | -5% |
10 Properties |
| 2002 | £231,241 | 16% |
6 Properties |
| 2001 | £195,000 | -18% |
5 Properties |
| 2000 | £229,850 | -10% |
7 Properties |
| 1999 | £252,800 | 57% |
5 Properties |
| 1998 | £107,800 | -52% |
5 Properties |
| 1997 | £163,666 | -4% |
3 Properties |
| 1996 | £170,500 | 76% |
4 Properties |
| 1995 | £40,750 | - |
4 Properties |
Property Price per Property Type in Milwich
Here you can find historic sold price data in order to help with your property search.
The average Property Paid Price for specific property types in the last three years are:
| Property Type | Average Sold Price | Sold Properties |
|---|---|---|
| Semi Detached House | £263,886.00 | 22 Semi Detached Houses |
| Detached House | £465,326.00 | 39 Detached Houses |
| Terraced House | £242,416.00 | 12 Terraced Houses |

