Houses for sale & to rent in Chartley, Stafford
House Prices in Chartley
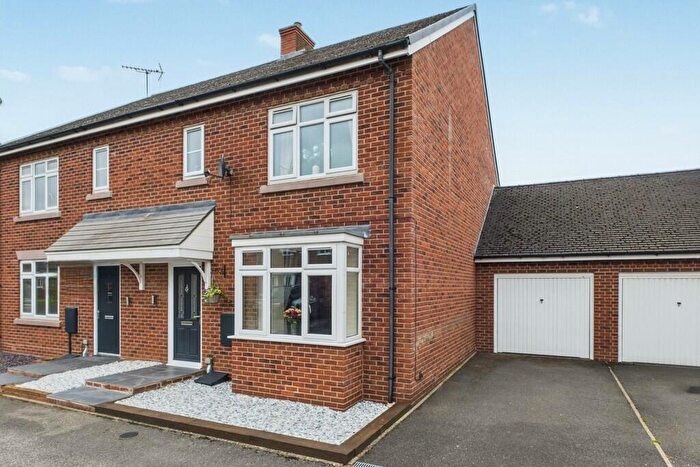
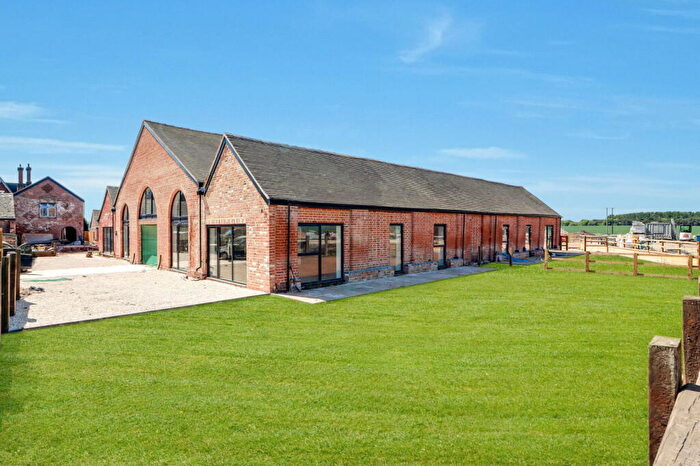
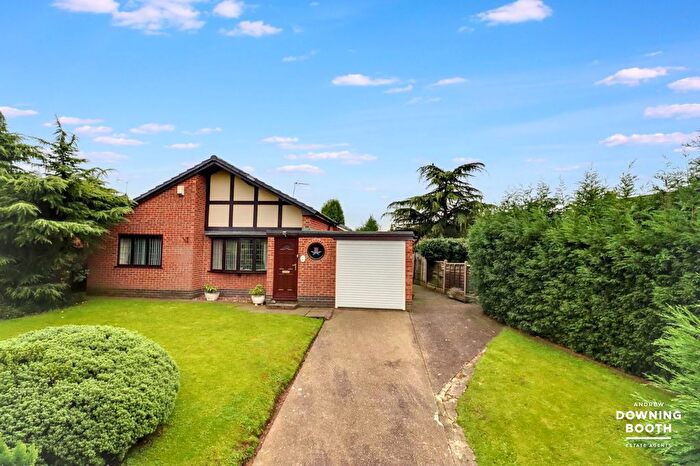
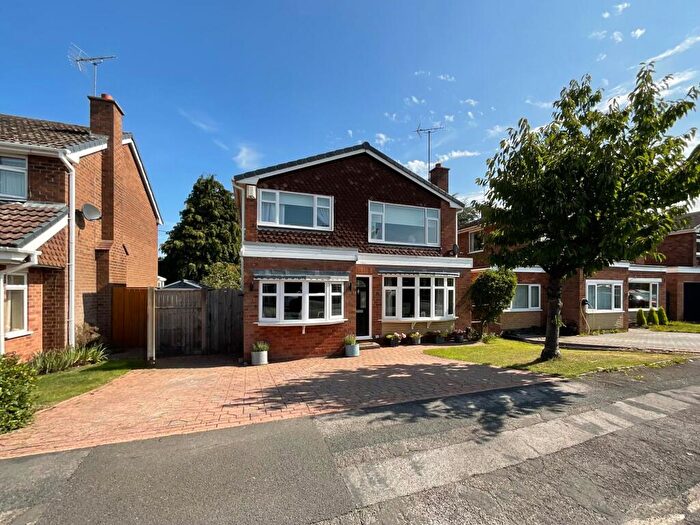
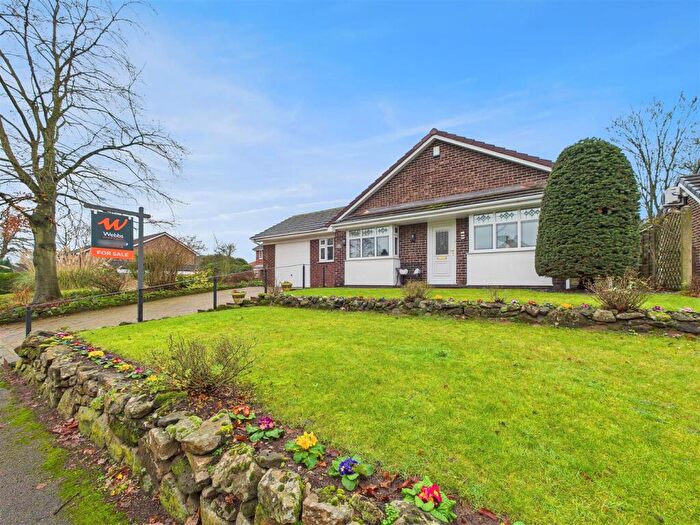
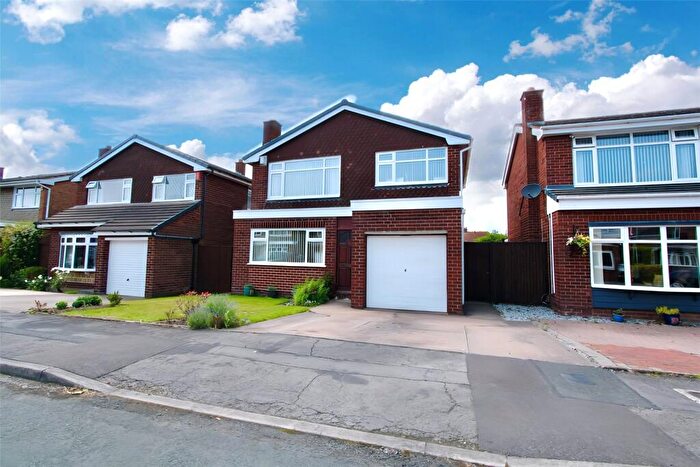
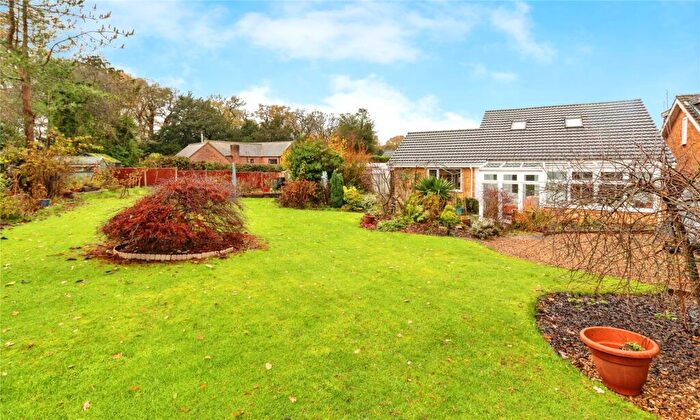
Properties in Chartley have an average house price of £413,433.00 and had 64 Property Transactions within the last 3 years¹.
Chartley is an area in Stafford, Staffordshire with 759 households², where the most expensive property was sold for £1,162,000.00.
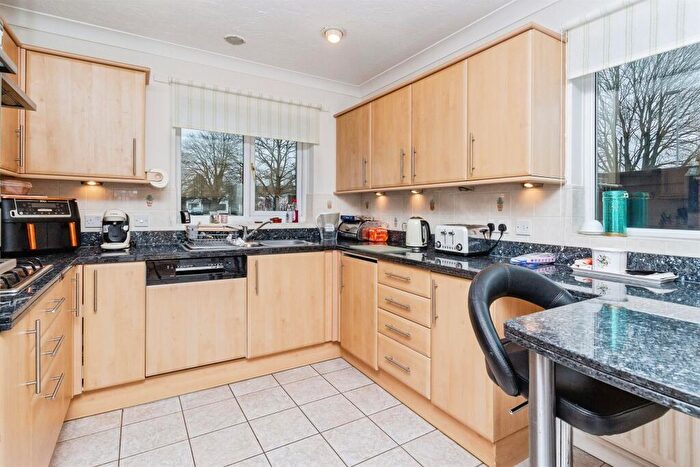
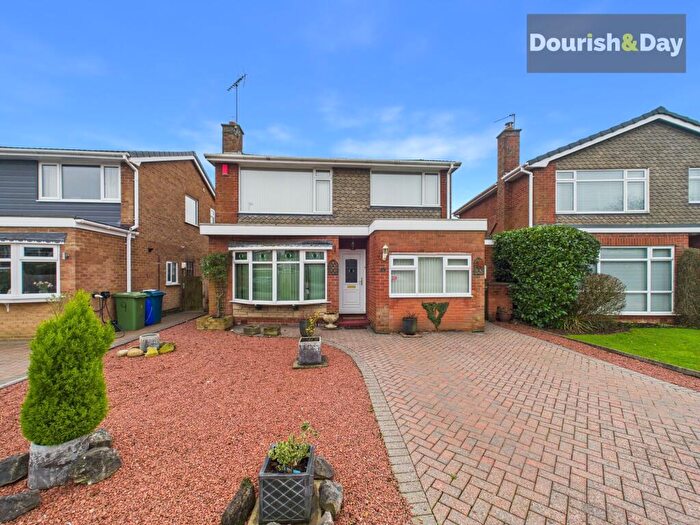
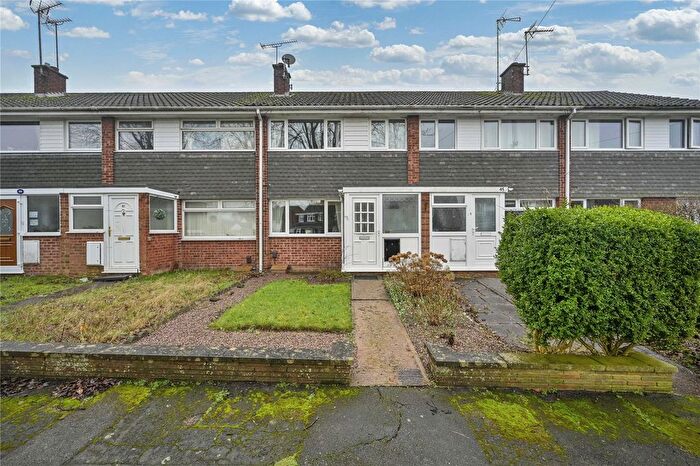
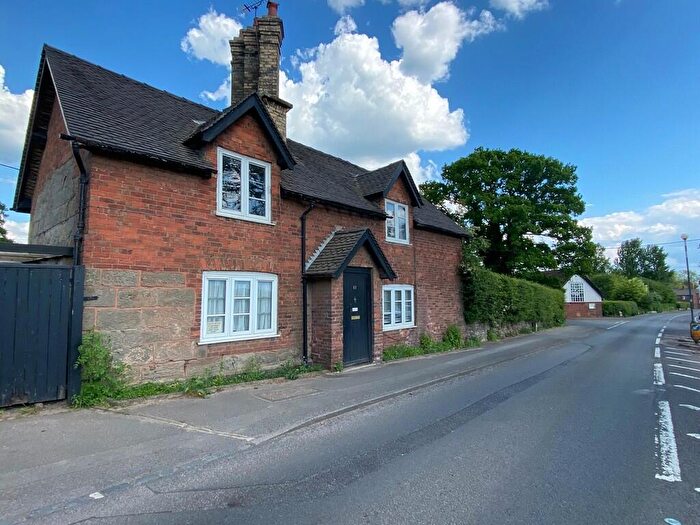
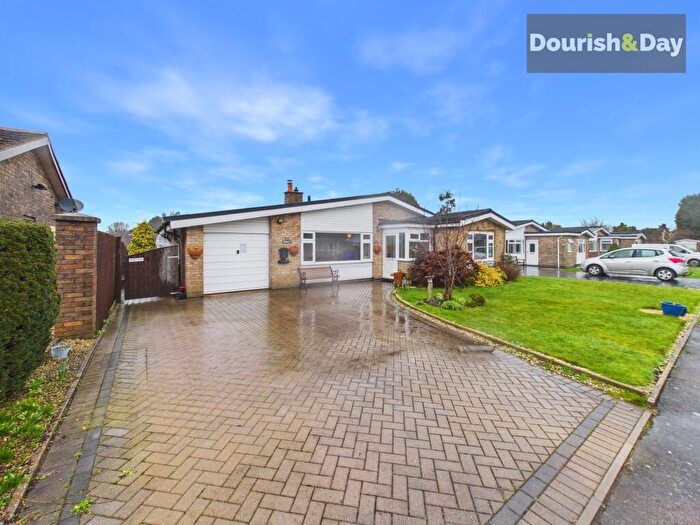
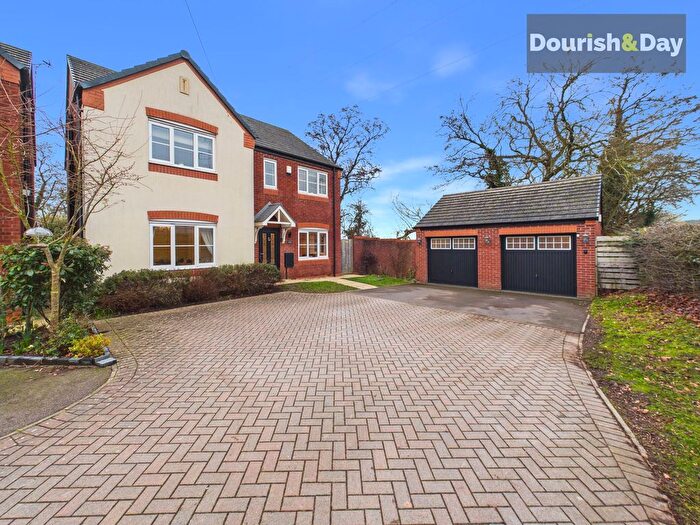
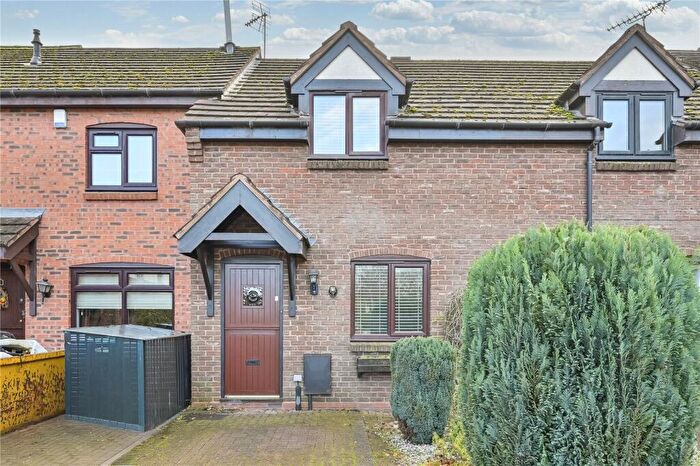
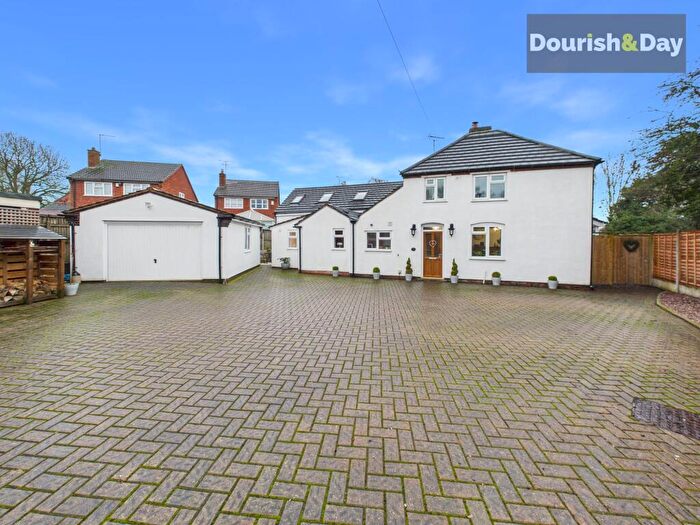
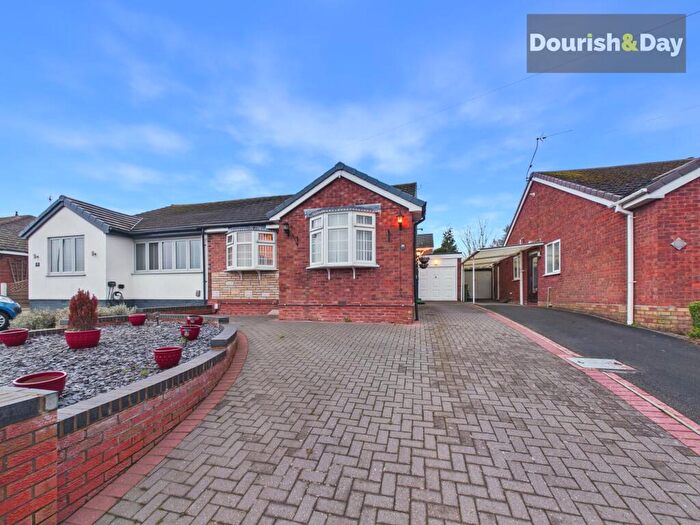
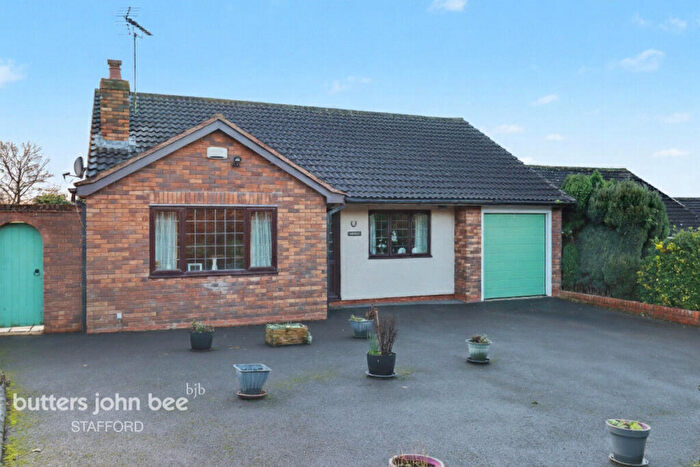
Properties for sale in Chartley
Roads and Postcodes in Chartley
Navigate through our locations to find the location of your next house in Chartley, Stafford for sale or to rent.
| Streets | Postcodes |
|---|---|
| Amerton Lane | ST18 0LB |
| Boat Lane | ST18 0HU |
| Brandwood Drive | ST18 0GH |
| Brandwood Walk | ST18 0JT |
| Bridge Close | ST18 0HY |
| Bridge Lane | ST18 0GL |
| Castlemill Close | ST18 0GJ |
| Chartley Manor Mews | ST18 0LL |
| Church Lane | ST18 0HL |
| Ferrers Road | ST18 0JN |
| Follet Close | ST18 0LR |
| Furlong Close | ST18 0JU |
| Green Barn Court | ST18 0FR |
| Green Road | ST18 0HZ ST18 0JA ST18 0JB ST18 0JQ |
| Hall Farm Crescent | ST18 0BT |
| Hill Rise | ST18 0BE |
| London Road | ST18 0JS ST18 0PN |
| Manor Close | ST18 0JP |
| Meadowbank Avenue | ST18 0HE |
| Mill Cottages | ST18 0LH |
| Netherton Close | ST18 0GR |
| Old Road | ST18 0JJ |
| Old School Close | ST18 0HF |
| Outwoods Close | ST18 0JR |
| Outwoods Green | ST18 0LJ |
| Pellfield Court | ST18 0JG |
| Salt Heath | ST18 0BN |
| Salt Lane | ST18 0BJ |
| Salt Road | ST18 0BP ST18 0BS ST18 0BX |
| Salt Works Lane | ST18 0JE ST18 0LW |
| Sandon Bank | ST18 9TB |
| Sandy Lane | ST18 0HR |
| Skeath Lane | ST18 9TD |
| St Johns Close | ST18 0LZ |
| Stafford Road | ST18 0HT ST18 0HX |
| Stowe Lane | ST18 0NA |
| The Bull Ring | ST18 0JL |
| The Green | ST18 0JH |
| The Row | ST18 0BW |
| Wellyards Close | ST18 0JW |
| Weston Bank | ST18 0BA |
| Willowmore Banks | ST18 0BH |
| ST18 0HJ ST18 0HN ST18 0HQ ST18 0LA ST18 0LD ST18 0LF ST18 0LG ST18 0LP ST18 0LS ST18 0LX ST18 0NP |
Transport near Chartley
-
Stafford Station
-
Rugeley Trent Valley Station
-
Stone Station
-
Rugeley Town Station
-
Uttoxeter Station
-
Blythe Bridge Station
-
Penkridge Station
-
Hednesford Station
- FAQ
- Price Paid By Year
- Property Type Price
Frequently asked questions about Chartley
What is the average price for a property for sale in Chartley?
The average price for a property for sale in Chartley is £413,433. This amount is 51% higher than the average price in Stafford. There are 664 property listings for sale in Chartley.
What streets have the most expensive properties for sale in Chartley?
The streets with the most expensive properties for sale in Chartley are Church Lane at an average of £638,333, The Row at an average of £568,200 and Green Road at an average of £502,500.
What streets have the most affordable properties for sale in Chartley?
The streets with the most affordable properties for sale in Chartley are Pellfield Court at an average of £205,812, Mill Cottages at an average of £212,500 and Stafford Road at an average of £228,750.
Which train stations are available in or near Chartley?
Some of the train stations available in or near Chartley are Stafford, Rugeley Trent Valley and Stone.
Property Price Paid in Chartley by Year
The average sold property price by year was:
| Year | Average Sold Price | Price Change |
Sold Properties
|
|---|---|---|---|
| 2025 | £374,797 | -27% |
21 Properties |
| 2024 | £477,035 | 14% |
14 Properties |
| 2023 | £410,706 | 3% |
29 Properties |
| 2022 | £397,612 | 6% |
29 Properties |
| 2021 | £372,314 | 5% |
38 Properties |
| 2020 | £352,375 | 8% |
28 Properties |
| 2019 | £324,030 | 5% |
31 Properties |
| 2018 | £309,050 | 13% |
29 Properties |
| 2017 | £267,755 | -2% |
35 Properties |
| 2016 | £272,924 | 14% |
36 Properties |
| 2015 | £235,386 | -21% |
27 Properties |
| 2014 | £283,704 | -2% |
34 Properties |
| 2013 | £288,223 | 33% |
24 Properties |
| 2012 | £193,900 | -26% |
31 Properties |
| 2011 | £245,103 | 2% |
47 Properties |
| 2010 | £239,263 | -4% |
49 Properties |
| 2009 | £247,690 | 3% |
32 Properties |
| 2008 | £240,399 | -4% |
23 Properties |
| 2007 | £249,207 | -9% |
26 Properties |
| 2006 | £272,671 | -3% |
26 Properties |
| 2005 | £281,602 | 26% |
24 Properties |
| 2004 | £208,109 | -10% |
27 Properties |
| 2003 | £229,837 | 30% |
37 Properties |
| 2002 | £161,995 | 6% |
23 Properties |
| 2001 | £151,607 | 8% |
32 Properties |
| 2000 | £140,141 | 25% |
23 Properties |
| 1999 | £105,640 | -14% |
43 Properties |
| 1998 | £120,083 | -4% |
34 Properties |
| 1997 | £125,078 | 10% |
39 Properties |
| 1996 | £112,158 | 17% |
35 Properties |
| 1995 | £92,631 | - |
19 Properties |
Property Price per Property Type in Chartley
Here you can find historic sold price data in order to help with your property search.
The average Property Paid Price for specific property types in the last three years are:
| Property Type | Average Sold Price | Sold Properties |
|---|---|---|
| Semi Detached House | £261,931.00 | 11 Semi Detached Houses |
| Detached House | £482,977.00 | 45 Detached Houses |
| Terraced House | £243,500.00 | 7 Terraced Houses |
| Flat | £140,000.00 | 1 Flat |

