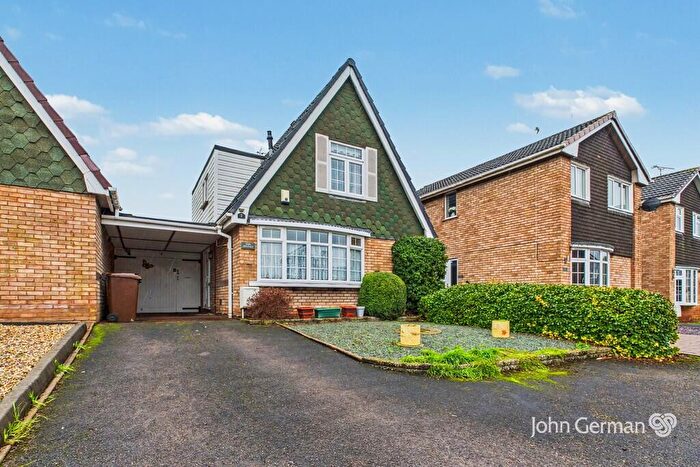
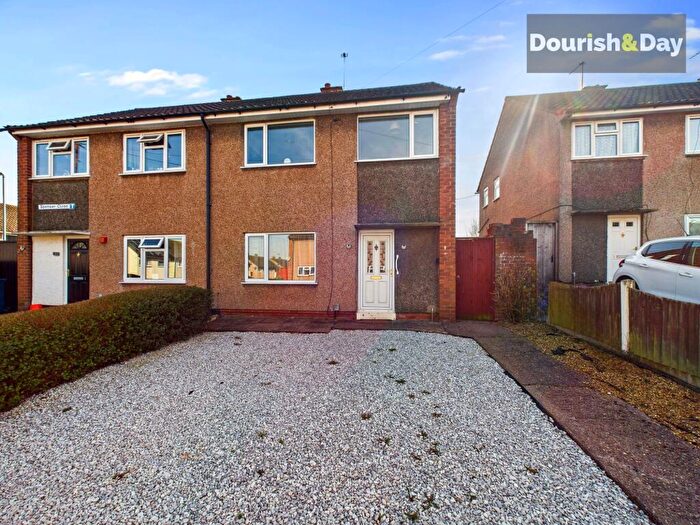
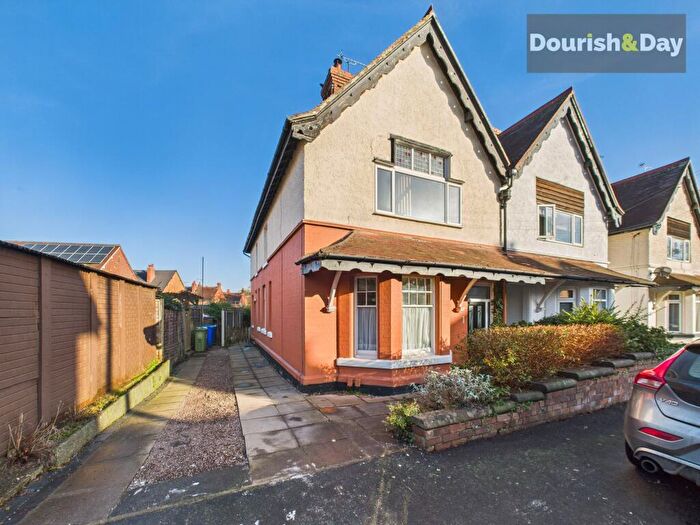
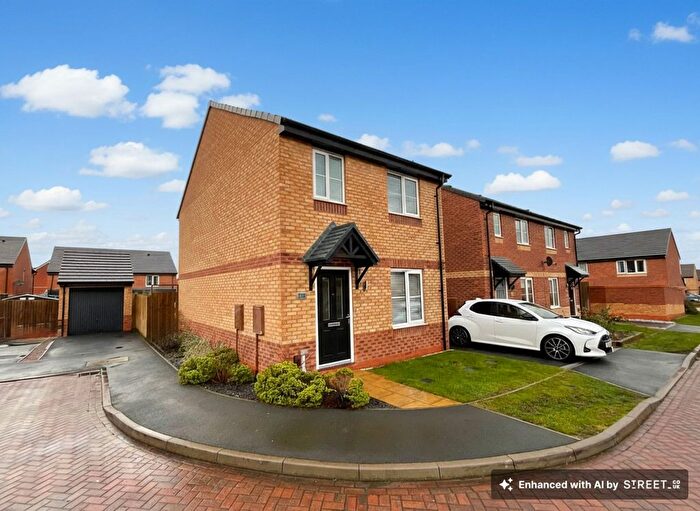
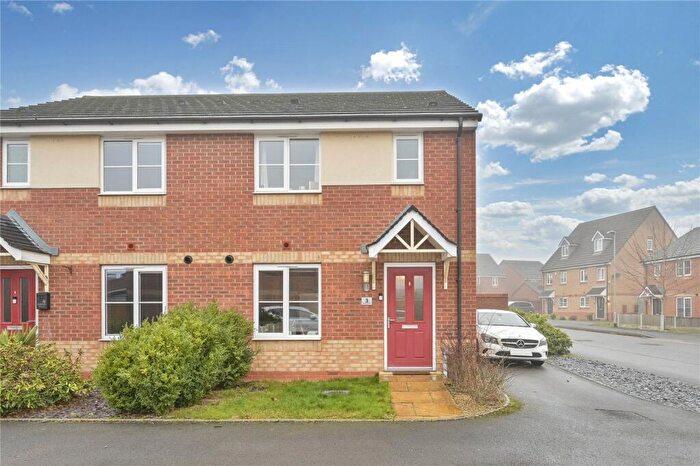
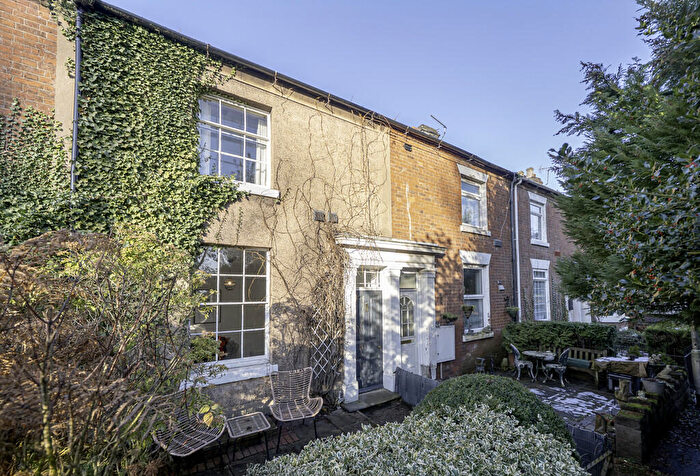
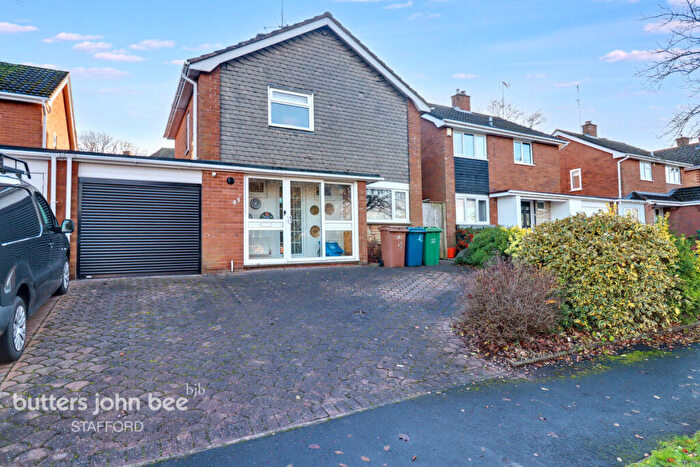
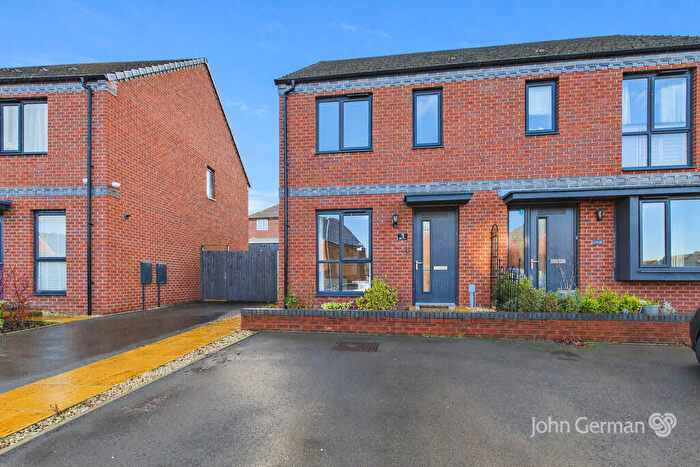
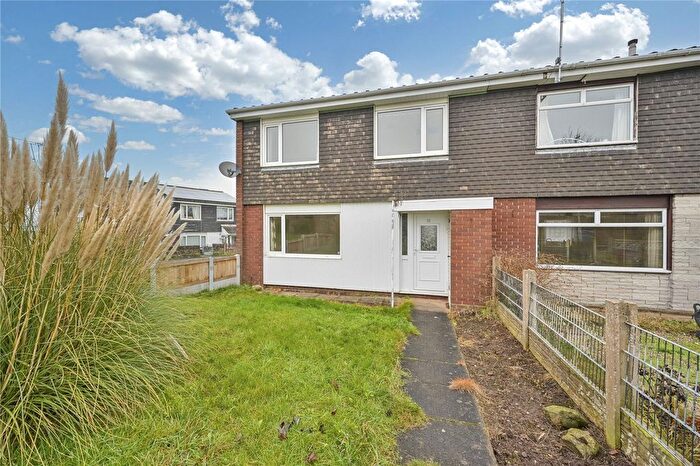
Houses for sale & to rent in Seighford, Stafford
House Prices in Seighford
Properties in Seighford have an average house price of £351,160.00 and had 155 Property Transactions within the last 3 years¹.
Seighford is an area in Stafford, Staffordshire with 1,437 households², where the most expensive property was sold for £1,615,000.00.
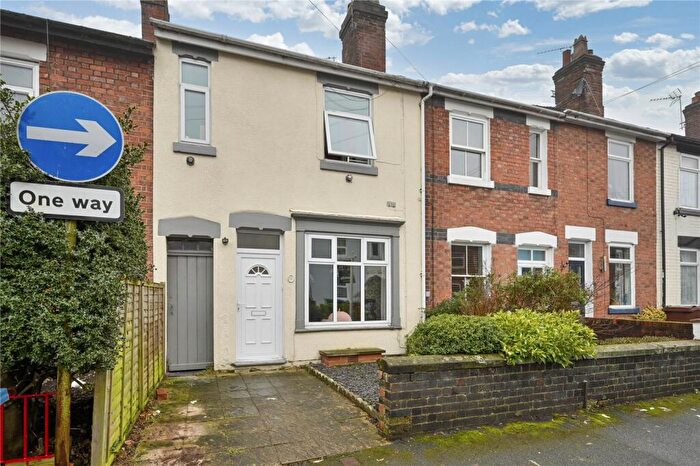
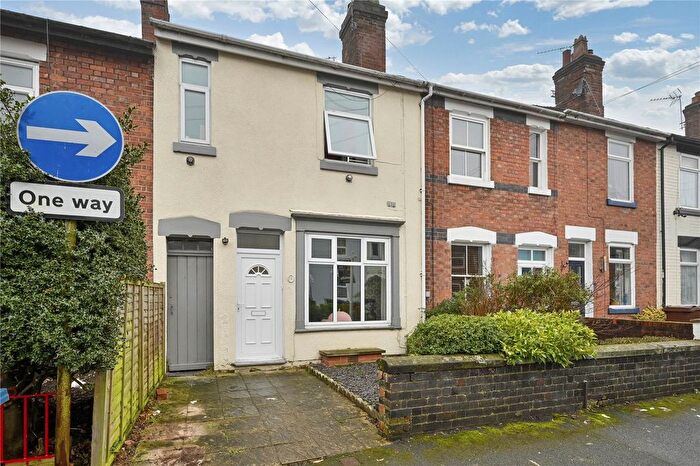
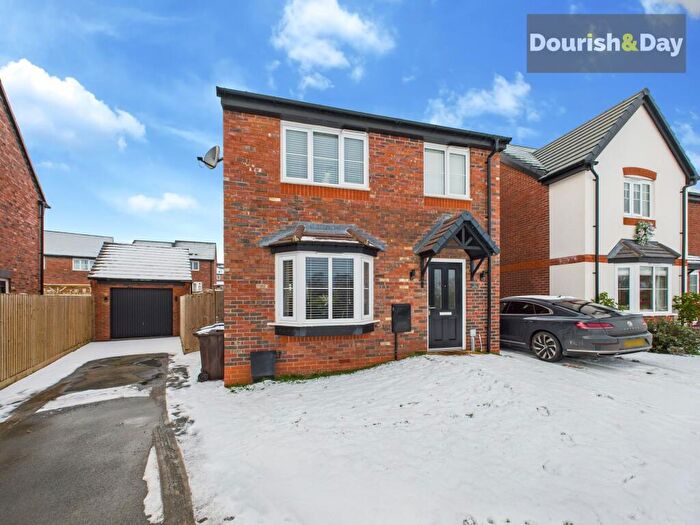
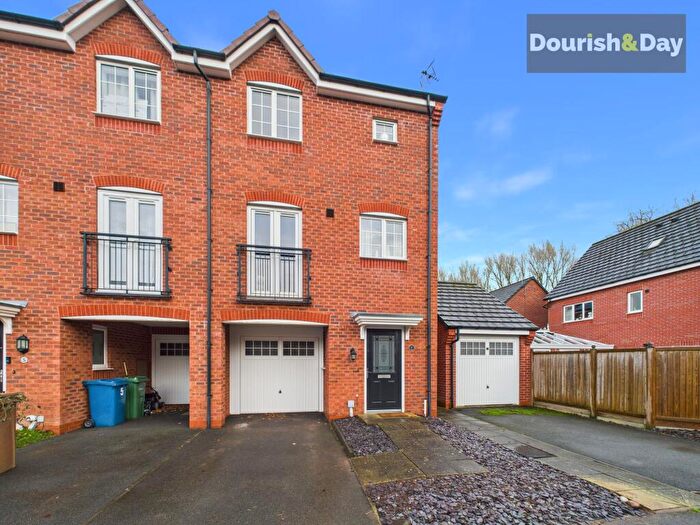
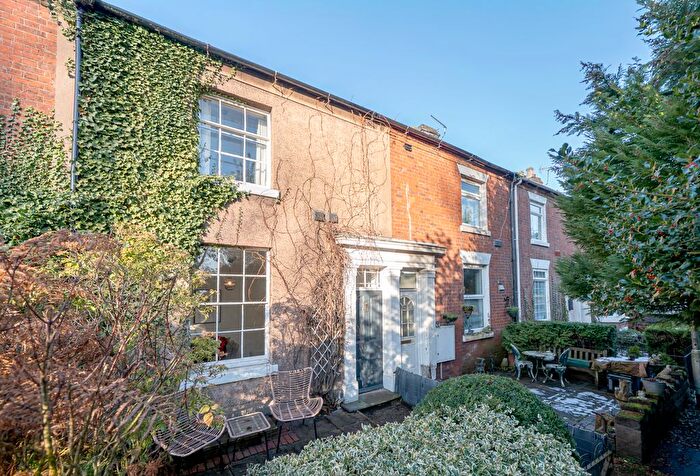
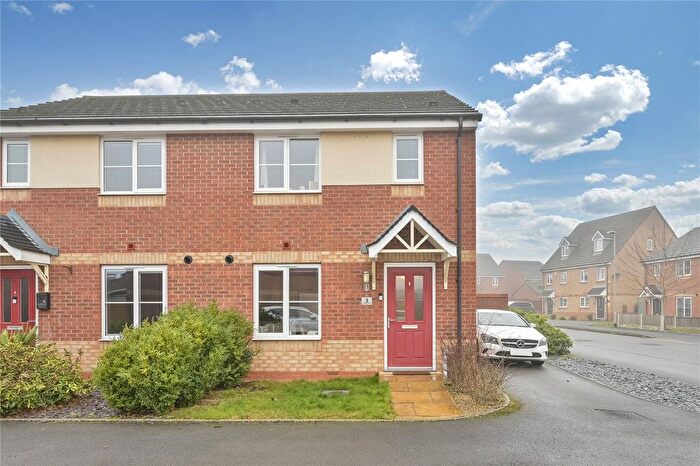
Properties for sale in Seighford
Roads and Postcodes in Seighford
Navigate through our locations to find the location of your next house in Seighford, Stafford for sale or to rent.
| Streets | Postcodes |
|---|---|
| Abbeyside | ST18 9JF |
| Ashflats Lane | ST18 9BP |
| Barn Bank Lane | ST18 9AU ST18 9AX |
| Billington Lane | ST18 9LR |
| Blackhole Lane | ST18 9LP |
| Bourne Avenue | ST18 9JX |
| Bradley Lane | ST18 9BQ |
| Bramall Close | ST18 9PG |
| Bridgeford Grove | ST18 9EL |
| Bridle Lane | ST20 0GG |
| Broad Heath | ST20 0JG |
| Brook Lane | ST18 9JY |
| Brook Side | ST18 9JA |
| Butt Lane | ST18 9JZ |
| Castle View | ST18 9NG |
| Castle View Estate | ST18 9NF |
| Cherry Lane | ST18 9SL |
| Cherry Tree Crescent | ST18 9TN |
| Chestnut Close | ST18 9NJ |
| Church Close | ST18 9JE |
| Church Lane | ST18 9LY |
| Clematis Close | ST18 9QF |
| Corner Ways | ST18 9LZ |
| Creswell Drive | ST18 9QS |
| Creswell Grove | ST18 9QP ST18 9QU |
| Crossing Lane | ST18 9LW |
| Dog Lane | ST18 9LA |
| Eccleshall Road | ST18 9PS ST18 9QB ST18 9SQ |
| Elm Court | ST18 9BJ |
| Enson Lane | ST18 9TA |
| Field Crescent | ST18 9LT |
| Grange Close | ST21 6JN |
| Green Lane | ST18 9PD ST18 9SR |
| Greenways | ST18 9BD |
| Hawthorn Close | ST18 9TW |
| Heather Close | ST18 9PU |
| Hextall Lane | ST18 9GZ |
| Holly Lane | ST18 9JS |
| Hyde Lea | ST18 9BG |
| Hyde Lea Bank | ST18 9AZ |
| Jasmine Road | ST18 9PT |
| Laburnum Close | ST18 9PX |
| Laundry Cottages | ST20 0JQ |
| Lavender Close | ST18 9PY |
| Lilac Close | ST18 9PZ |
| Long Compton | ST18 9JT |
| Long Lane | ST18 9LL |
| Magnolia Close | ST18 9PW |
| Maple Drive | ST18 9NE |
| Marston Lane | ST18 9SY |
| Meadow Lane | ST18 9NA |
| Mount Pleasant | ST18 9NB |
| New Row | ST18 9BH |
| Newport Road | ST18 9PR |
| Orchard Lane | ST18 9BB |
| Pirehill Grange | ST18 9RY |
| Ridgeway Close | ST18 9BE |
| Ruskin Drive | ST18 9LD |
| Seighford Lane | ST18 9LQ |
| St Matthews Drive | ST18 9LS ST18 9LU |
| Stockingate Lane | ST18 9PB |
| Stone Road | ST18 9SA |
| Stoneleigh Court | ST18 9QJ |
| The Cumbers | ST18 9PH |
| The Grange | ST18 9BF |
| The Mount | ST18 9QT |
| The Paddock | ST18 9PJ |
| The Square | ST18 9LF |
| Twemlow Close | ST18 9LX |
| Whites Meadow | ST18 9JB |
| Whitgreave Lane | ST18 9SJ ST18 9SP ST18 9SW |
| Wilkes Wood | ST18 9QR |
| Willowbrook | ST18 9NN |
| Worston Lane | ST18 9QA |
| Yarlet Lane | ST18 9ST |
| Yew Tree Close | ST18 9ND |
| ST18 9DG ST18 9JU ST18 9LJ ST18 9LN ST18 9PE ST18 9PL ST18 9PQ ST18 9SB ST18 9SD ST18 9SG ST18 9SH ST18 9SX ST20 0JA ST21 6HT ST21 6JQ |
Transport near Seighford
- FAQ
- Price Paid By Year
- Property Type Price
Frequently asked questions about Seighford
What is the average price for a property for sale in Seighford?
The average price for a property for sale in Seighford is £351,160. This amount is 29% higher than the average price in Stafford. There are more than 10,000 property listings for sale in Seighford.
What streets have the most expensive properties for sale in Seighford?
The streets with the most expensive properties for sale in Seighford are Marston Lane at an average of £925,000, Long Lane at an average of £475,600 and Castle View at an average of £470,000.
What streets have the most affordable properties for sale in Seighford?
The streets with the most affordable properties for sale in Seighford are The Mount at an average of £195,000, Wilkes Wood at an average of £210,500 and Newport Road at an average of £222,000.
Which train stations are available in or near Seighford?
Some of the train stations available in or near Seighford are Stafford, Stone and Penkridge.
Property Price Paid in Seighford by Year
The average sold property price by year was:
| Year | Average Sold Price | Price Change |
Sold Properties
|
|---|---|---|---|
| 2025 | £352,965 | 15% |
33 Properties |
| 2024 | £298,454 | -40% |
35 Properties |
| 2023 | £419,033 | 20% |
37 Properties |
| 2022 | £336,637 | 9% |
50 Properties |
| 2021 | £306,815 | -10% |
49 Properties |
| 2020 | £338,385 | 12% |
57 Properties |
| 2019 | £299,057 | 9% |
56 Properties |
| 2018 | £270,814 | 8% |
61 Properties |
| 2017 | £249,416 | 4% |
70 Properties |
| 2016 | £239,636 | -4% |
52 Properties |
| 2015 | £249,208 | -1% |
66 Properties |
| 2014 | £250,520 | 14% |
55 Properties |
| 2013 | £216,363 | 10% |
41 Properties |
| 2012 | £194,884 | -53% |
35 Properties |
| 2011 | £299,126 | 29% |
49 Properties |
| 2010 | £212,869 | -16% |
39 Properties |
| 2009 | £246,709 | -11% |
26 Properties |
| 2008 | £273,055 | 1% |
34 Properties |
| 2007 | £270,361 | 16% |
51 Properties |
| 2006 | £226,285 | -7% |
71 Properties |
| 2005 | £241,274 | 5% |
43 Properties |
| 2004 | £229,357 | 23% |
44 Properties |
| 2003 | £177,270 | 17% |
52 Properties |
| 2002 | £147,180 | 20% |
66 Properties |
| 2001 | £117,184 | -0,3% |
55 Properties |
| 2000 | £117,537 | 7% |
55 Properties |
| 1999 | £108,751 | - |
66 Properties |
| 1998 | £108,726 | 21% |
58 Properties |
| 1997 | £85,585 | -13% |
64 Properties |
| 1996 | £97,027 | 16% |
68 Properties |
| 1995 | £81,390 | - |
46 Properties |
Property Price per Property Type in Seighford
Here you can find historic sold price data in order to help with your property search.
The average Property Paid Price for specific property types in the last three years are:
| Property Type | Average Sold Price | Sold Properties |
|---|---|---|
| Semi Detached House | £271,090.00 | 43 Semi Detached Houses |
| Detached House | £390,963.00 | 105 Detached Houses |
| Terraced House | £245,964.00 | 7 Terraced Houses |

