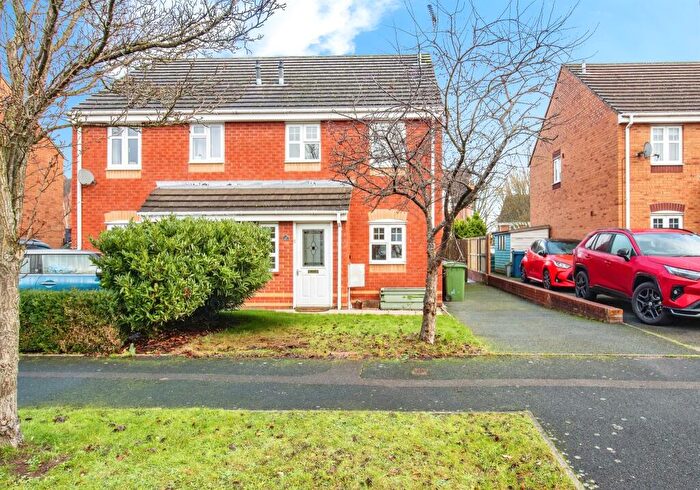
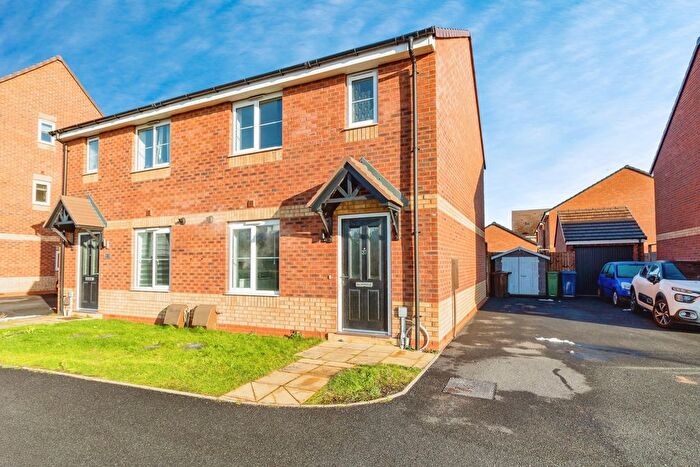
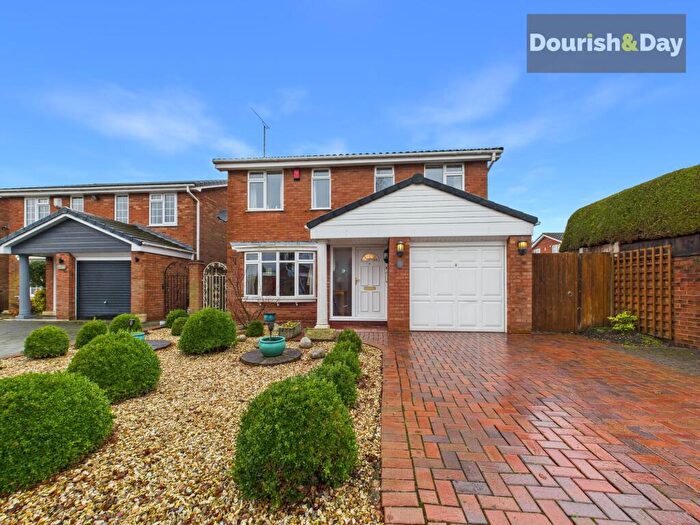
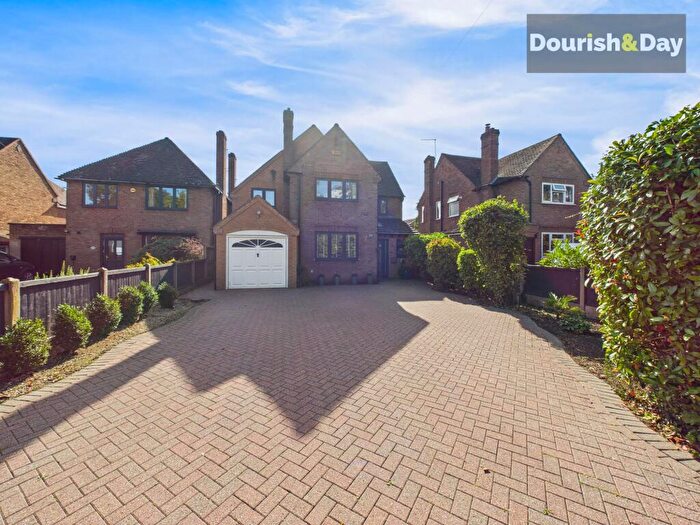
Houses for sale & to rent in Tillington, Stafford
House Prices in Tillington
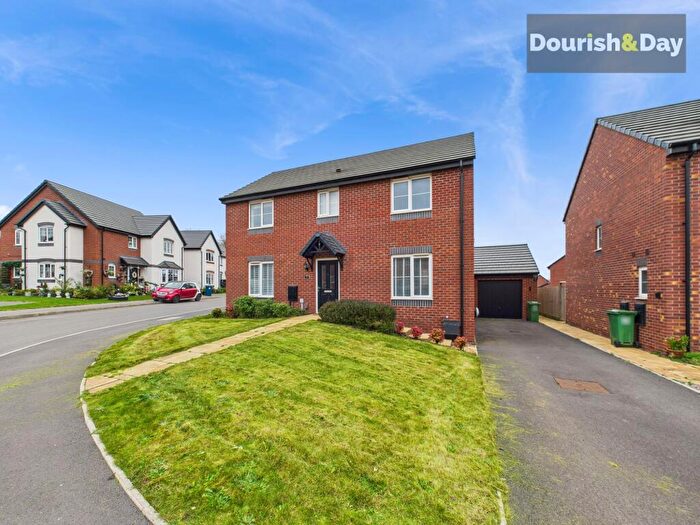
Properties in Tillington have an average house price of £233,377.00 and had 206 Property Transactions within the last 3 years¹.
Tillington is an area in Stafford, Staffordshire with 1,616 households², where the most expensive property was sold for £525,000.00.
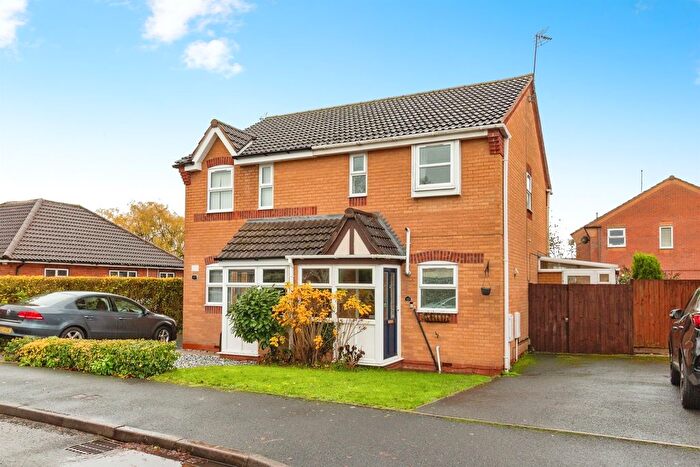
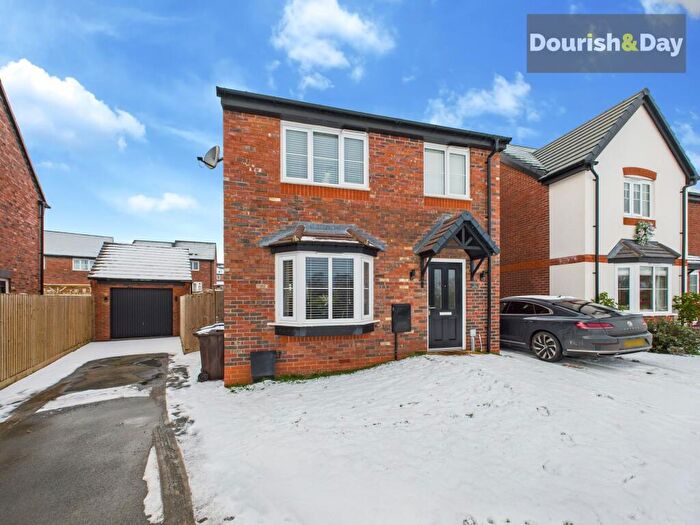
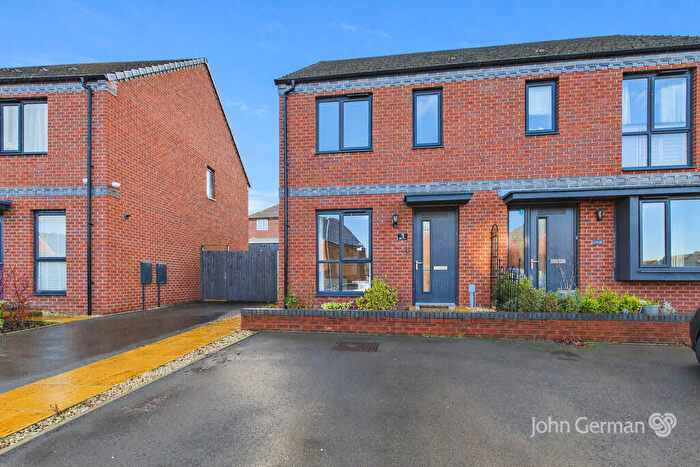
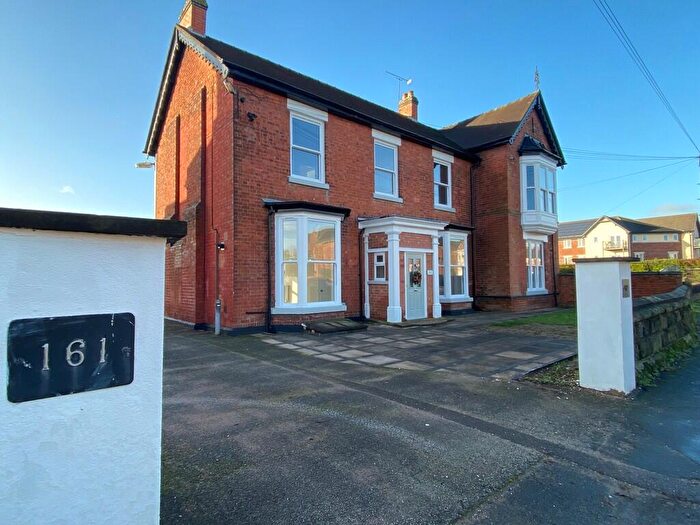
Properties for sale in Tillington
Roads and Postcodes in Tillington
Navigate through our locations to find the location of your next house in Tillington, Stafford for sale or to rent.
| Streets | Postcodes |
|---|---|
| Alstone Close | ST16 1UH |
| Aster Drive | ST16 1FH |
| Baxter Green | ST16 2ER |
| Berry Road | ST16 1SE ST16 1SF |
| Bracken Close | ST16 1SG |
| Bradbury Rise | ST16 1EL |
| Brisbane Road | ST16 1RF ST16 1RG |
| Bromstead Crescent | ST16 1UQ |
| Brooklime Gardens | ST16 1XN |
| Burcham Close | ST16 1RH |
| Cameo Way | ST16 1SR |
| Campion Grove | ST16 1FG |
| Carder Avenue | ST16 1QU ST16 1QX |
| Cardinal Way | ST16 1FL |
| Chebsey Drive | ST16 1ST |
| Chetney Close | ST16 1XA |
| Conway Road | ST16 1EN ST16 1EW |
| Crab Lane | ST16 1SA ST16 1SB |
| Cranberry Close | ST16 1RA |
| Creswell Farm Drive | ST16 1PG |
| Dearnsdale Close | ST16 1SD |
| Doxey | ST16 1EB ST16 1EE ST16 1EG ST16 1EQ ST16 1HG |
| Doxey Fields | ST16 1HH ST16 1HJ ST16 1HL |
| Ebony Close | ST16 2TW |
| Eccleshall Road | ST16 1JL ST16 1JN ST16 1JW ST16 1PE ST16 1PF |
| Fernleigh Gardens | ST16 1HA |
| Gorsebrook Leys | ST16 1HB |
| Grassmere Hollow | ST16 1EY |
| Greensome Crescent | ST16 1EX |
| Greensome Lane | ST16 1EU ST16 1HE ST16 1HF |
| Harcourt Way | ST16 1QY ST16 1QZ |
| Hartwell Grove | ST16 1RW |
| Hilcote Hollow | ST16 1UL |
| Holbeach Way | ST16 1XB |
| Lapley Avenue | ST16 1JP |
| Levedale Close | ST16 1JR |
| Loynton Close | ST16 1PQ |
| Mahogany Drive | ST16 2TS |
| Marsland Close | ST16 1HW |
| Meakin Grove | ST16 1RQ |
| Moss Close | ST16 1FN |
| Mossvale Grove | ST16 1HD |
| Oulton Way | ST16 1SS |
| Purslane Close | ST16 1FF |
| Reed Drive | ST16 1FE |
| Riversmeade Way | ST16 1EZ |
| Romney Drive | ST16 1XD |
| Shebdon Close | ST16 1UG |
| Simpson Close | ST16 1RJ |
| Speedwell Rise | ST16 1XR |
| Spruce Way | ST16 2TU |
| Stretton Avenue | ST16 1UJ |
| The Crescent | ST16 1ED |
| The Drive | ST16 1EF |
| The Ridgeway | ST16 1XP |
| Timberfield Road | ST16 2TR |
| Valerian Drive | ST16 1FJ |
| Walland Grove | ST16 1XE |
| Warrens Lane | ST16 1QJ |
| Woodlands Road | ST16 1QT ST16 1RD |
| Wootton Drive | ST16 1PU |
Transport near Tillington
-
Stafford Station
-
Stone Station
-
Penkridge Station
-
Hednesford Station
-
Rugeley Trent Valley Station
-
Rugeley Town Station
- FAQ
- Price Paid By Year
- Property Type Price
Frequently asked questions about Tillington
What is the average price for a property for sale in Tillington?
The average price for a property for sale in Tillington is £233,377. This amount is 14% lower than the average price in Stafford. There are 1,280 property listings for sale in Tillington.
What streets have the most expensive properties for sale in Tillington?
The streets with the most expensive properties for sale in Tillington are Oulton Way at an average of £370,000, Valerian Drive at an average of £353,666 and Aster Drive at an average of £345,000.
What streets have the most affordable properties for sale in Tillington?
The streets with the most affordable properties for sale in Tillington are The Drive at an average of £113,333, Greensome Lane at an average of £149,333 and Walland Grove at an average of £155,750.
Which train stations are available in or near Tillington?
Some of the train stations available in or near Tillington are Stafford, Stone and Penkridge.
Property Price Paid in Tillington by Year
The average sold property price by year was:
| Year | Average Sold Price | Price Change |
Sold Properties
|
|---|---|---|---|
| 2025 | £246,066 | 2% |
30 Properties |
| 2024 | £242,171 | 6% |
63 Properties |
| 2023 | £228,441 | 3% |
57 Properties |
| 2022 | £221,710 | 7% |
56 Properties |
| 2021 | £206,209 | 5% |
62 Properties |
| 2020 | £196,836 | -0,1% |
61 Properties |
| 2019 | £196,976 | 0,3% |
61 Properties |
| 2018 | £196,301 | 4% |
82 Properties |
| 2017 | £188,586 | 10% |
91 Properties |
| 2016 | £168,795 | 8% |
71 Properties |
| 2015 | £155,245 | -17% |
76 Properties |
| 2014 | £181,888 | 1% |
76 Properties |
| 2013 | £179,710 | 3% |
88 Properties |
| 2012 | £174,299 | 6% |
73 Properties |
| 2011 | £163,896 | 10% |
60 Properties |
| 2010 | £147,077 | 6% |
38 Properties |
| 2009 | £138,830 | -8% |
34 Properties |
| 2008 | £149,773 | -3% |
36 Properties |
| 2007 | £153,694 | -3% |
66 Properties |
| 2006 | £157,710 | 3% |
81 Properties |
| 2005 | £152,829 | 10% |
72 Properties |
| 2004 | £137,240 | 15% |
86 Properties |
| 2003 | £116,145 | 13% |
80 Properties |
| 2002 | £100,564 | 25% |
161 Properties |
| 2001 | £75,821 | 7% |
93 Properties |
| 2000 | £70,630 | 14% |
54 Properties |
| 1999 | £60,634 | -1% |
119 Properties |
| 1998 | £61,109 | 7% |
98 Properties |
| 1997 | £56,610 | -3% |
89 Properties |
| 1996 | £58,404 | 1% |
62 Properties |
| 1995 | £57,784 | - |
36 Properties |
Property Price per Property Type in Tillington
Here you can find historic sold price data in order to help with your property search.
The average Property Paid Price for specific property types in the last three years are:
| Property Type | Average Sold Price | Sold Properties |
|---|---|---|
| Semi Detached House | £206,869.00 | 107 Semi Detached Houses |
| Detached House | £302,766.00 | 67 Detached Houses |
| Terraced House | £191,332.00 | 25 Terraced Houses |
| Flat | £124,571.00 | 7 Flats |

