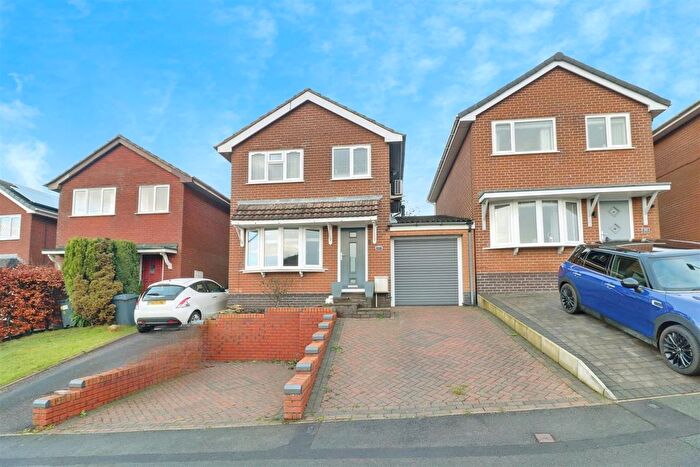
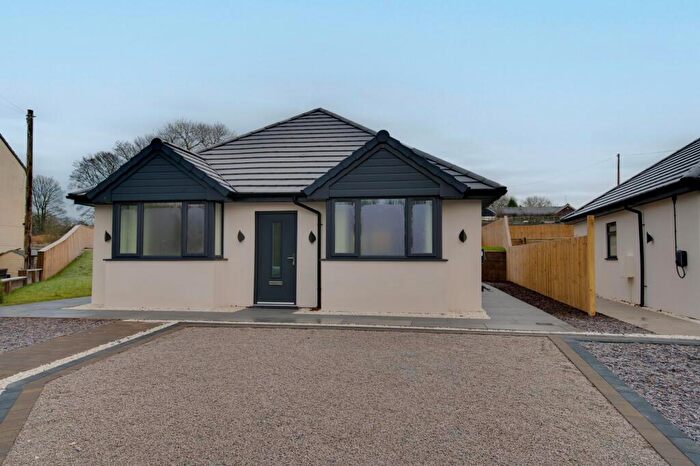
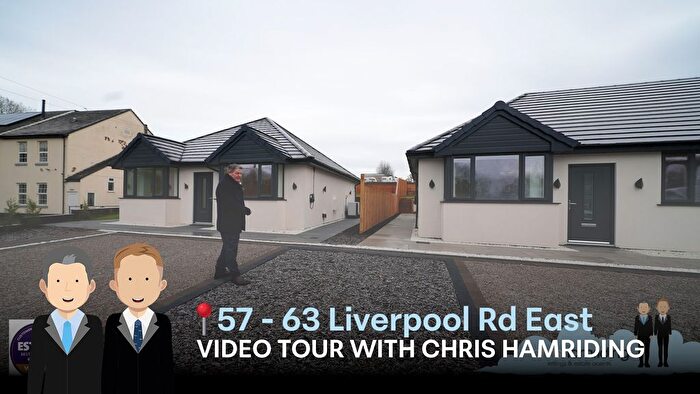
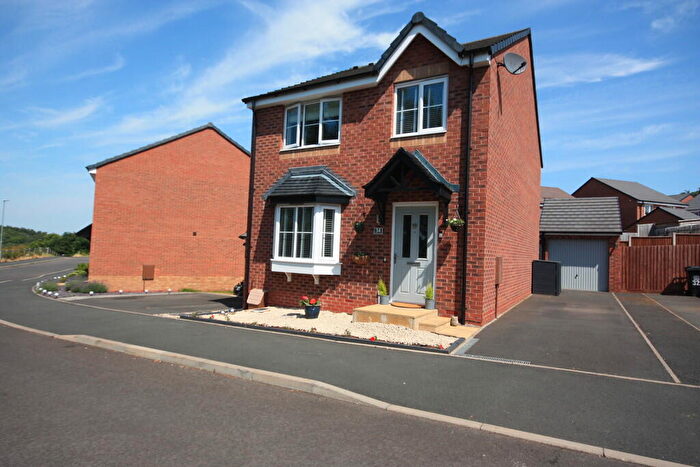
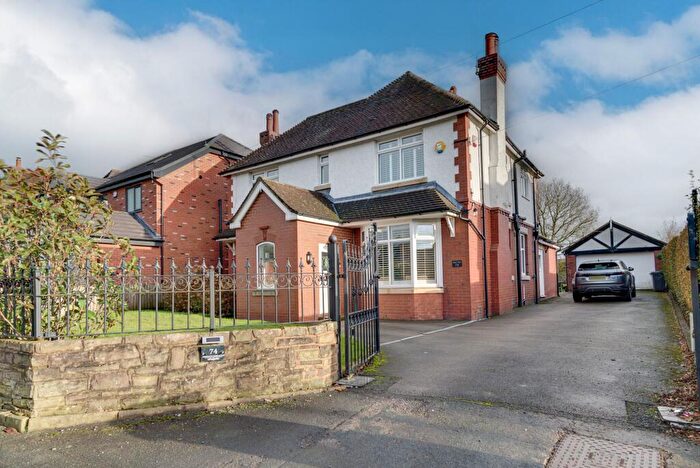
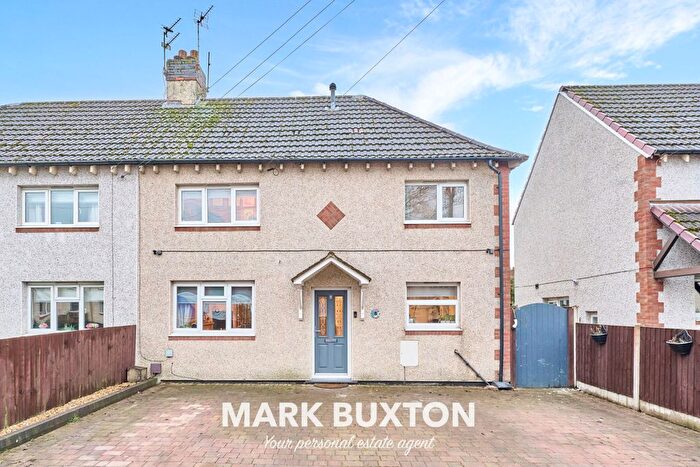
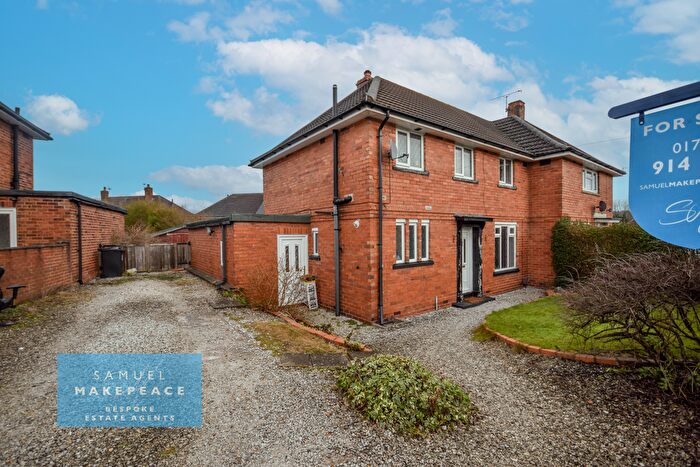
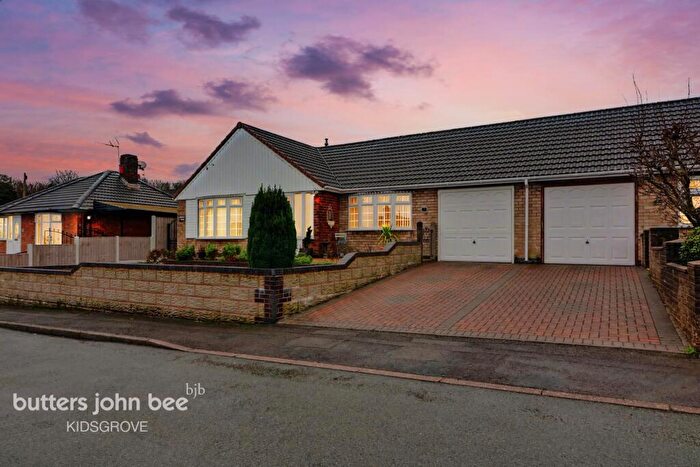
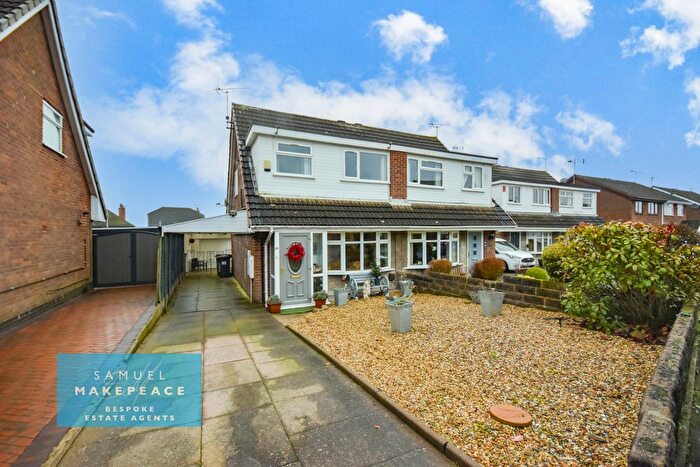
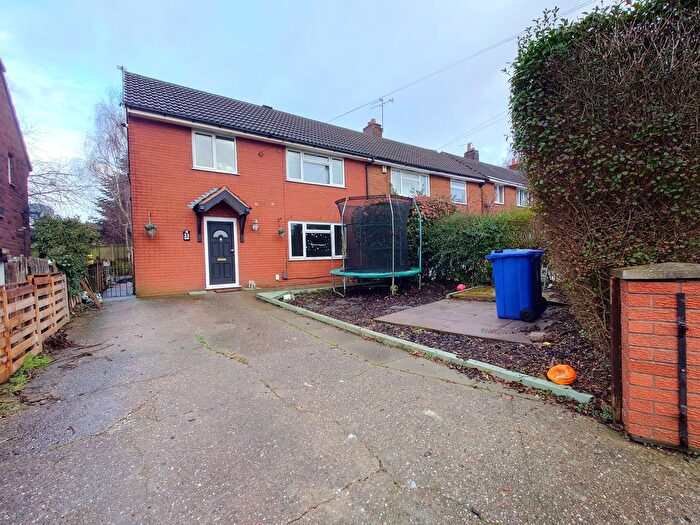
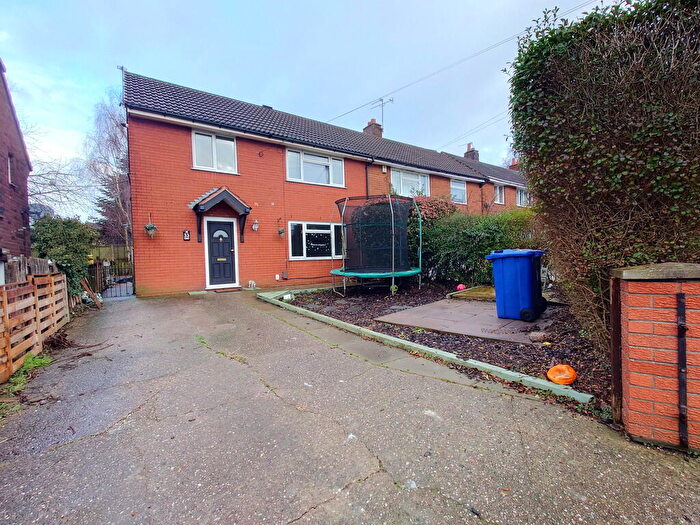
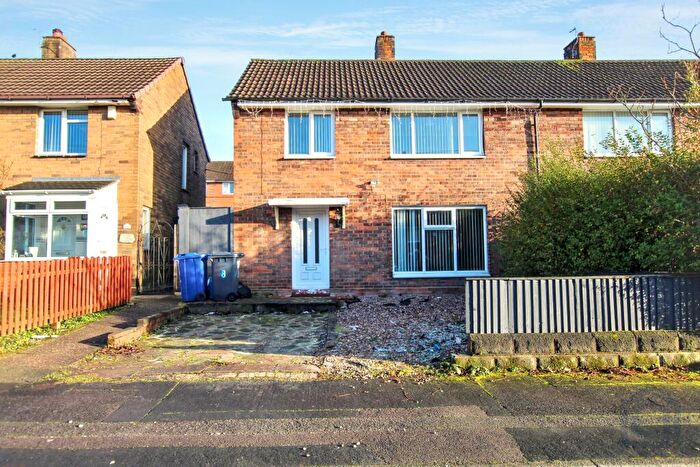
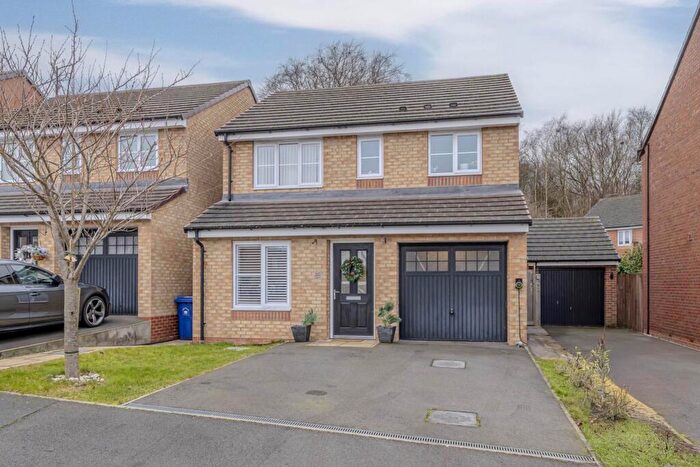
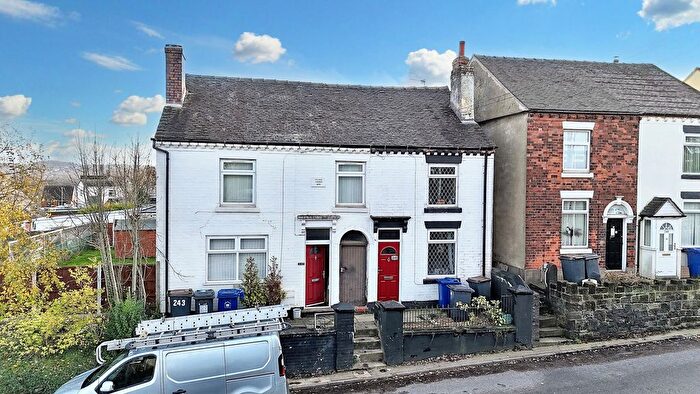
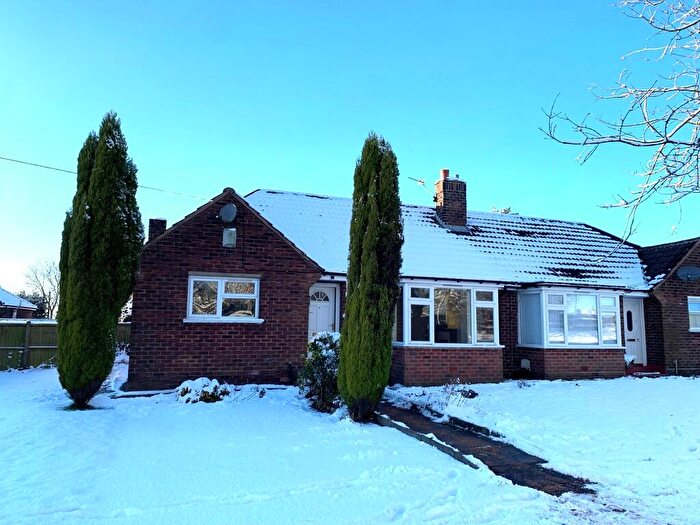
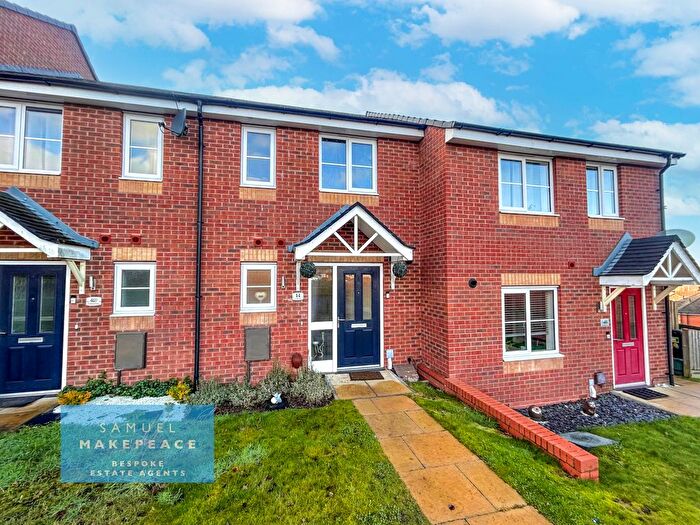
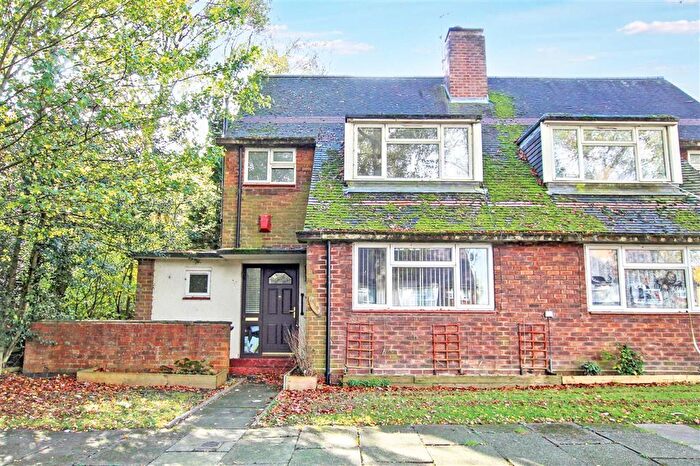
Houses for sale & to rent in Butt Lane, Stoke-on-trent
House Prices in Butt Lane
Properties in Butt Lane have an average house price of £159,770.00 and had 308 Property Transactions within the last 3 years¹.
Butt Lane is an area in Stoke-on-trent, Staffordshire with 2,260 households², where the most expensive property was sold for £370,000.00.
Properties for sale in Butt Lane
Roads and Postcodes in Butt Lane
Navigate through our locations to find the location of your next house in Butt Lane, Stoke-on-trent for sale or to rent.
| Streets | Postcodes |
|---|---|
| Banbury Gardens | ST7 1LH |
| Banbury Street | ST7 1JG |
| Beech Drive | ST7 1BA ST7 1BD |
| Bishops Close | ST7 1JP |
| Bowling Alley Street | ST7 1GA |
| Brindley Close | ST7 1JU |
| Bullhurst Close | ST7 1GD |
| Cedar Avenue | ST7 1JZ ST7 1LA |
| Chapel Street | ST7 1NN |
| Church Street | ST7 1NU ST7 1NX |
| Clough Hall Road | ST7 1AR ST7 1AU ST7 1AW ST7 1AX |
| Congleton Road | ST7 1LP ST7 1LS ST7 1LT ST7 1LW ST7 1LX ST7 1LY ST7 1ND ST7 1NE ST7 1NG |
| Covert Gardens | ST7 1RQ |
| Cumberland Close | ST7 1AY |
| Fifth Avenue | ST7 1DA |
| First Avenue | ST7 1DN ST7 1DW |
| Fox Gardens | ST7 1RG |
| Glebe Street | ST7 1NP |
| Grove Avenue | ST7 1DJ |
| Hardings Meadow | ST7 1DY |
| Hardings Wood | ST7 1EG |
| Hardings Wood Road | ST7 1EF |
| Harecastle Avenue | ST7 1JT |
| Harecastle Villas | ST7 1EQ |
| Higher Ash Road | ST7 1JN |
| Hollins Crescent | ST7 1JX |
| Hollinwood Road | ST7 1DQ |
| Hunters Way | ST7 1RT |
| Kinnersley Avenue | ST7 1AP |
| Laburnum Close | ST7 1BB |
| Limekiln Lane | ST7 3AG |
| Linley Road | ST7 1TZ |
| Liverpool Road East | ST7 3AD ST7 3AF |
| Lower Ash Road | ST7 1DF ST7 1DG |
| Maple Avenue | ST7 1JW |
| Millstone Avenue | ST7 1LG |
| Mitchell Avenue | ST7 1JJ ST7 1JR |
| Mitchell Drive | ST7 1JL |
| Old Butt Lane | ST7 1NJ ST7 1NL ST7 1NR ST7 1NS |
| Orchard Crescent | ST7 1JH |
| Park Avenue | ST7 1BG ST7 1BQ |
| Pickwick Place | ST7 1LF |
| Rowhurst Crescent | ST7 1GB |
| Second Avenue | ST7 1DD ST7 1DE |
| Skellern Street | ST7 1NW |
| Slacken Lane | ST7 1NQ |
| Springfield Drive | ST7 1BL |
| St Saviours Street | ST7 1LR |
| Sycamore Close | ST7 1BE |
| Telford Close | ST7 1DL |
| The Avenue | ST7 1AG |
| Third Avenue | ST7 1BY ST7 1BZ |
| Townfield Close | ST7 1NF |
| Unity Way | ST7 1RU |
| West Avenue | ST7 1NT |
| Westmorland Avenue | ST7 1AS ST7 1AT |
| Woodlands Avenue | ST7 1LE |
| Woodshutts Street | ST7 1LB ST7 1LD |
| Wright Street | ST7 1NY |
Transport near Butt Lane
- FAQ
- Price Paid By Year
- Property Type Price
Frequently asked questions about Butt Lane
What is the average price for a property for sale in Butt Lane?
The average price for a property for sale in Butt Lane is £159,770. This amount is 32% lower than the average price in Stoke-on-trent. There are 702 property listings for sale in Butt Lane.
What streets have the most expensive properties for sale in Butt Lane?
The streets with the most expensive properties for sale in Butt Lane are Hunters Way at an average of £285,000, Clough Hall Road at an average of £266,750 and Park Avenue at an average of £251,000.
What streets have the most affordable properties for sale in Butt Lane?
The streets with the most affordable properties for sale in Butt Lane are Skellern Street at an average of £98,333, Glebe Street at an average of £104,750 and Church Street at an average of £108,825.
Which train stations are available in or near Butt Lane?
Some of the train stations available in or near Butt Lane are Kidsgrove, Alsager and Longport.
Property Price Paid in Butt Lane by Year
The average sold property price by year was:
| Year | Average Sold Price | Price Change |
Sold Properties
|
|---|---|---|---|
| 2025 | £168,036 | 7% |
52 Properties |
| 2024 | £155,654 | -1% |
91 Properties |
| 2023 | £157,693 | -2% |
80 Properties |
| 2022 | £161,076 | 8% |
85 Properties |
| 2021 | £147,656 | 4% |
94 Properties |
| 2020 | £142,444 | 6% |
85 Properties |
| 2019 | £134,521 | -3% |
81 Properties |
| 2018 | £138,049 | 13% |
97 Properties |
| 2017 | £119,476 | 4% |
90 Properties |
| 2016 | £115,082 | 4% |
68 Properties |
| 2015 | £110,045 | -11% |
74 Properties |
| 2014 | £122,603 | -6% |
84 Properties |
| 2013 | £129,357 | 11% |
87 Properties |
| 2012 | £115,259 | 2% |
44 Properties |
| 2011 | £112,902 | -5% |
49 Properties |
| 2010 | £118,836 | 17% |
33 Properties |
| 2009 | £98,420 | -17% |
40 Properties |
| 2008 | £115,336 | 2% |
42 Properties |
| 2007 | £113,172 | -0,2% |
96 Properties |
| 2006 | £113,397 | 8% |
83 Properties |
| 2005 | £104,644 | 22% |
91 Properties |
| 2004 | £81,657 | 20% |
108 Properties |
| 2003 | £65,183 | 12% |
97 Properties |
| 2002 | £57,372 | 9% |
98 Properties |
| 2001 | £52,193 | 9% |
66 Properties |
| 2000 | £47,392 | 14% |
70 Properties |
| 1999 | £40,564 | 1% |
56 Properties |
| 1998 | £39,962 | -27% |
61 Properties |
| 1997 | £50,620 | 17% |
88 Properties |
| 1996 | £42,003 | 2% |
72 Properties |
| 1995 | £41,308 | - |
61 Properties |
Property Price per Property Type in Butt Lane
Here you can find historic sold price data in order to help with your property search.
The average Property Paid Price for specific property types in the last three years are:
| Property Type | Average Sold Price | Sold Properties |
|---|---|---|
| Semi Detached House | £164,441.00 | 151 Semi Detached Houses |
| Detached House | £233,160.00 | 52 Detached Houses |
| Terraced House | £118,483.00 | 99 Terraced Houses |
| Flat | £87,416.00 | 6 Flats |

