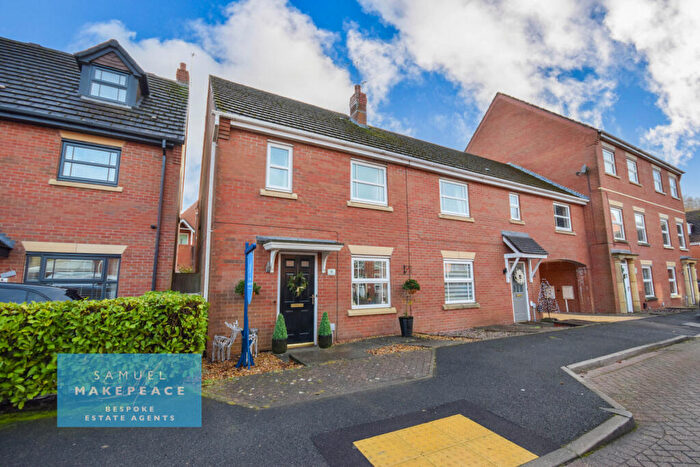
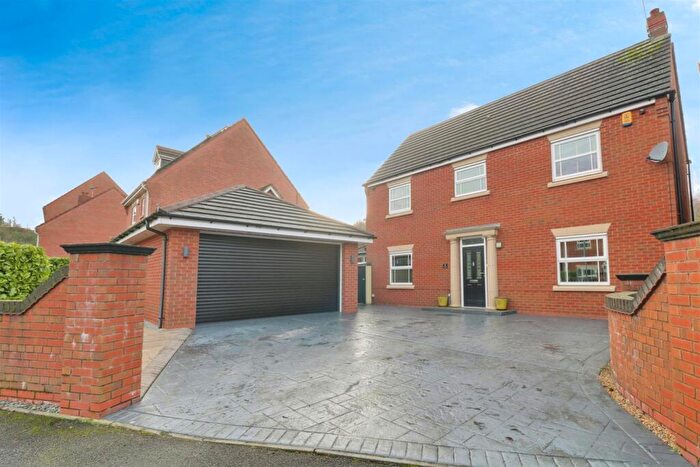
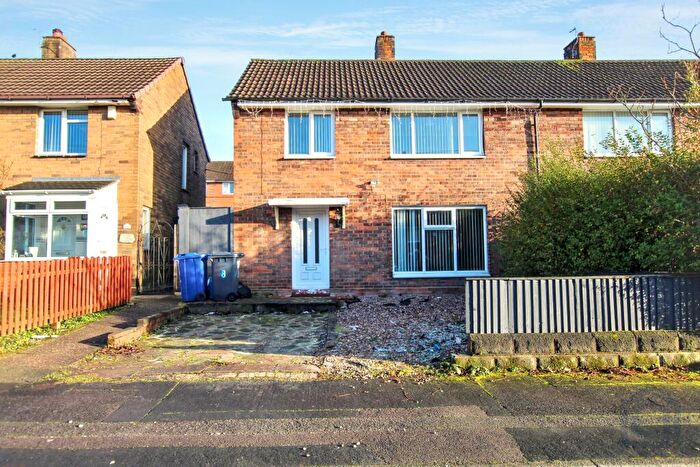
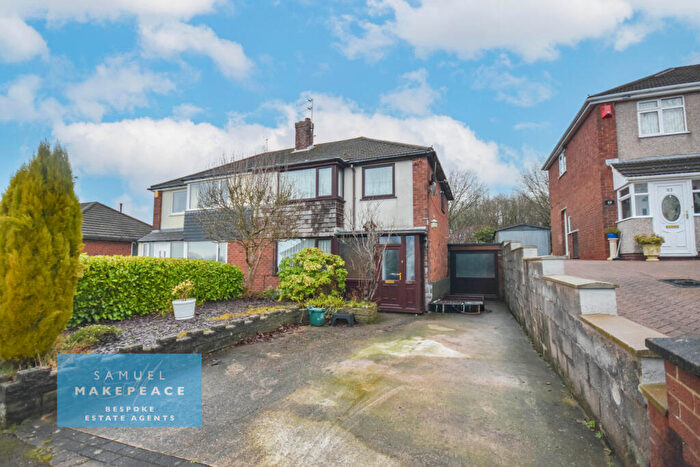
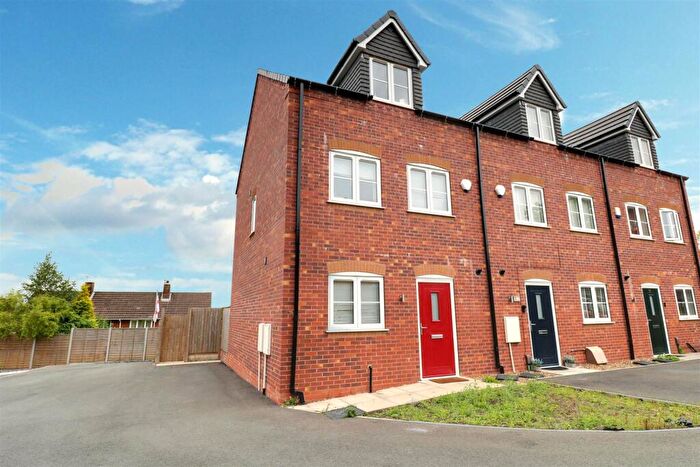
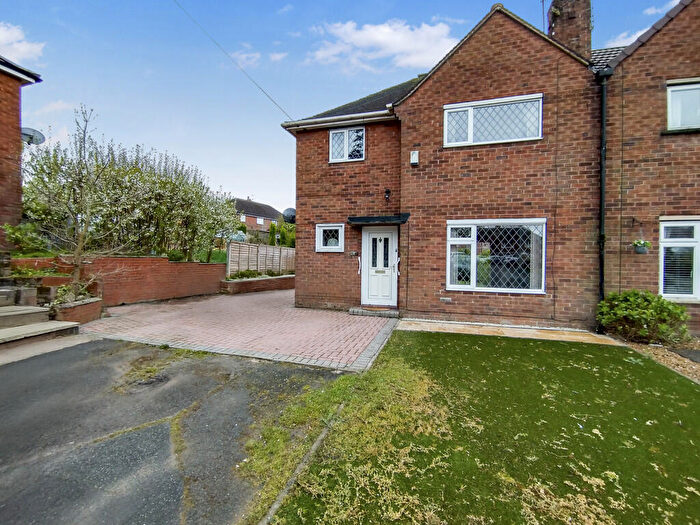
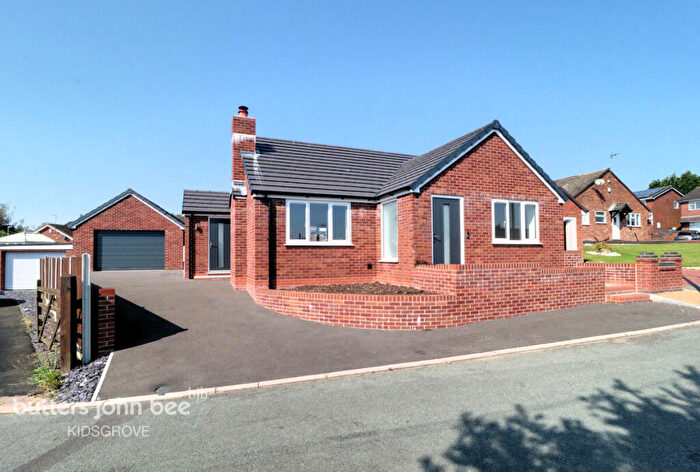
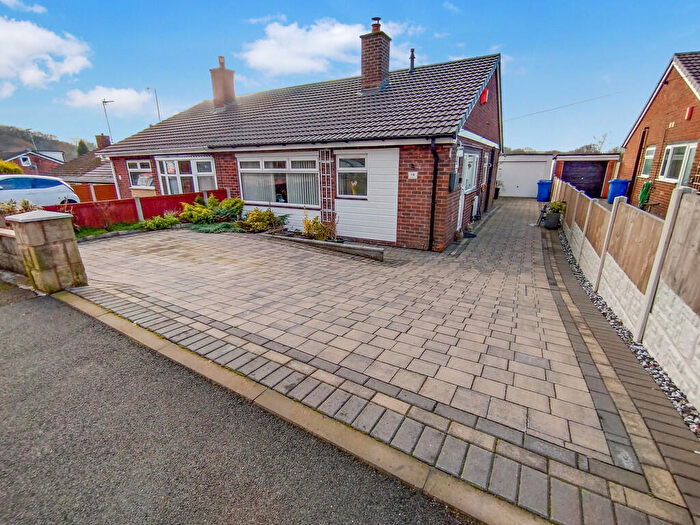
Houses for sale & to rent in Kidsgrove, Stoke-on-trent
House Prices in Kidsgrove
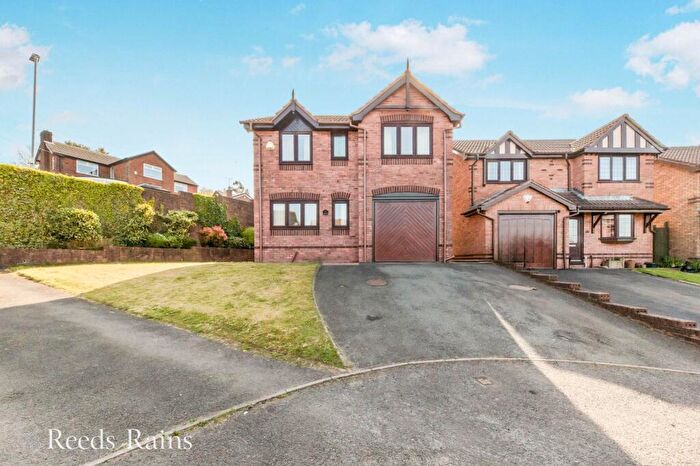
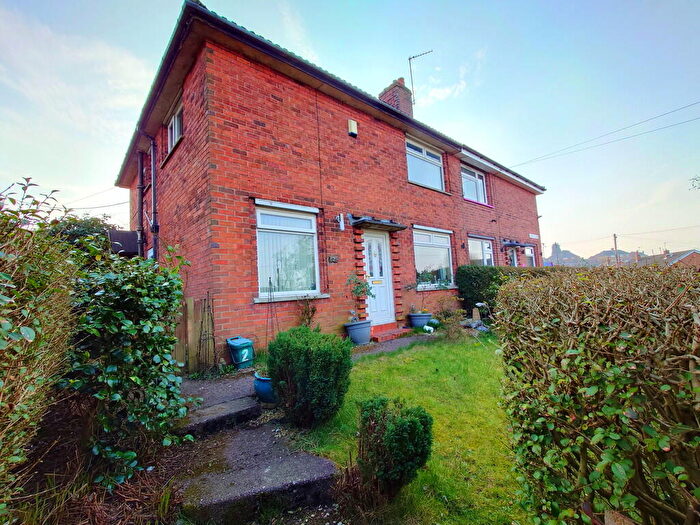
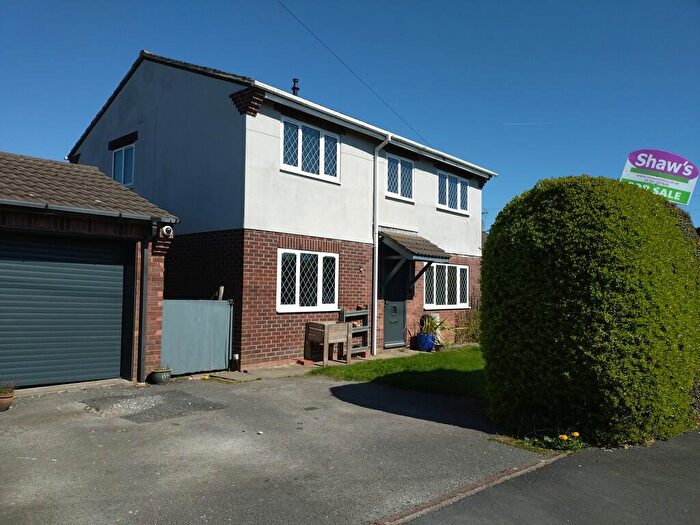
Properties in Kidsgrove have an average house price of £188,131.00 and had 225 Property Transactions within the last 3 years¹.
Kidsgrove is an area in Stoke-on-trent, Staffordshire with 2,664 households², where the most expensive property was sold for £795,000.00.
Properties for sale in Kidsgrove
Roads and Postcodes in Kidsgrove
Navigate through our locations to find the location of your next house in Kidsgrove, Stoke-on-trent for sale or to rent.
| Streets | Postcodes |
|---|---|
| Acacia Gardens | ST7 4RU ST7 4RX |
| Ash View | ST7 4XT |
| Astbury Close | ST7 4TY |
| Avon Close | ST7 4AG |
| Bank Street | ST7 4RR |
| Bedford Road | ST7 1HQ |
| Birches Way | ST7 4XU |
| Birkdale Drive | ST7 4SL |
| Bourne Road | ST7 1EU |
| Briarswood | ST7 4XA |
| Brieryhurst Road | ST7 4RZ ST7 4SD |
| Brights Avenue | ST7 4XX |
| Burnwood Grove | ST7 4XY |
| Charnwood | ST7 4UY |
| Church Street | ST7 4RS |
| Cobmoor Road | ST7 3PZ ST7 4DF |
| Dane Gardens | ST7 4PL |
| Derwent Crescent | ST7 4PH |
| Diamond Avenue | ST7 4XZ |
| Dorset Place | ST7 4BU |
| Essex Drive | ST7 1HE |
| Everest Road | ST7 4DW ST7 4DY ST7 4DZ ST7 4ED |
| Galleys Bank | ST7 4DD ST7 4DE |
| Gloucester Road | ST7 1EH ST7 1EL ST7 1EN ST7 4DQ |
| Hampshire Gardens | ST7 1HP |
| Hayhead Close | ST7 4AQ |
| Hazel Close | ST7 4SE |
| High Street | ST7 4RL ST7 4RN ST7 4RW |
| Highfield Avenue | ST7 4AT |
| Hillary Road | ST7 4DN ST7 4DP |
| King Street | ST7 1HJ ST7 1HL ST7 1HN ST7 1HW |
| Kingswood | ST7 4UX |
| Kite Grove | ST7 4XW |
| Lamb Street | ST7 4AL |
| Lapwing Road | ST7 4XP |
| Lark Avenue | ST7 4YJ |
| Larkfields | ST7 4UT |
| Lawton Street | ST7 4RP |
| Lincoln Road | ST7 1HA |
| Little Row | ST7 4YF |
| Magpie Crescent | ST7 4XQ |
| Maryhill Close | ST7 4DH |
| Merlin Way | ST7 4YL |
| Moss Place | ST7 4DB |
| Mossfield Crescent | ST7 4YA |
| Nabbs Close | ST7 4YB |
| Nabbswood Road | ST7 4AW |
| Newchapel Road | ST7 4RT ST7 4SF ST7 4SG ST7 4ST |
| Norfolk Road | ST7 1EZ |
| Osprey View | ST7 4XL |
| Park View Road | ST7 4DA |
| Parklands | ST7 4US |
| Phoenix Close | ST7 4YU |
| Priory Place | ST7 4SA |
| Queen Street | ST7 4AH |
| Rigby Road | ST7 4SQ |
| Rookery Road | ST7 4EA |
| Rutland Road | ST7 4AP |
| Salop Place | ST7 4BZ |
| Silvermine Close | ST7 4XN |
| Silverwood | ST7 4UZ |
| Somerset Avenue | ST7 1EX |
| Sparrow Butts Grove | ST7 4XH |
| Spey Drive | ST7 4AF ST7 4AJ |
| St Andrews Drive | ST7 4QU ST7 4QX |
| Starling Close | ST7 4XR |
| Summerfield | ST7 4UU |
| Surrey Road | ST7 4AR |
| Sussex Drive | ST7 1HG |
| Tamar Road | ST7 4BD |
| Tawney Close | ST7 4EN |
| Tern Avenue | ST7 4PJ |
| Trubshaw Place | ST7 4SB |
| Victoria Avenue | ST7 1EY ST7 1HB ST7 1HD ST7 1HF |
| Warwick Close | ST7 1HH |
| Wentworth Drive | ST7 4SU |
| Whitehall Avenue | ST7 1EP ST7 1ES ST7 1ET ST7 1EW |
| Whitehill Road | ST7 4AS ST7 4AU ST7 4DR ST7 4DS ST7 4DT ST7 4DU ST7 4EE |
| Whitfield Road | ST7 4YD |
| Wild Goose Avenue | ST7 4XS |
| William Road | ST7 4BS ST7 4BT ST7 4BX ST7 4BY |
| Winghay Road | ST7 4XJ |
| Woodhall Road | ST7 4QY |
Transport near Kidsgrove
- FAQ
- Price Paid By Year
- Property Type Price
Frequently asked questions about Kidsgrove
What is the average price for a property for sale in Kidsgrove?
The average price for a property for sale in Kidsgrove is £188,131. This amount is 20% lower than the average price in Stoke-on-trent. There are 634 property listings for sale in Kidsgrove.
What streets have the most expensive properties for sale in Kidsgrove?
The streets with the most expensive properties for sale in Kidsgrove are High Street at an average of £374,285, Parklands at an average of £323,750 and Kingswood at an average of £307,333.
What streets have the most affordable properties for sale in Kidsgrove?
The streets with the most affordable properties for sale in Kidsgrove are Lincoln Road at an average of £98,041, Victoria Avenue at an average of £100,666 and Essex Drive at an average of £103,250.
Which train stations are available in or near Kidsgrove?
Some of the train stations available in or near Kidsgrove are Kidsgrove, Alsager and Longport.
Property Price Paid in Kidsgrove by Year
The average sold property price by year was:
| Year | Average Sold Price | Price Change |
Sold Properties
|
|---|---|---|---|
| 2025 | £189,575 | 3% |
64 Properties |
| 2024 | £184,345 | -4% |
85 Properties |
| 2023 | £191,150 | 12% |
76 Properties |
| 2022 | £167,823 | 5% |
100 Properties |
| 2021 | £159,285 | 13% |
87 Properties |
| 2020 | £138,316 | -1% |
78 Properties |
| 2019 | £140,388 | 2% |
90 Properties |
| 2018 | £137,754 | 5% |
94 Properties |
| 2017 | £130,850 | 6% |
102 Properties |
| 2016 | £122,741 | -1% |
97 Properties |
| 2015 | £123,448 | 11% |
99 Properties |
| 2014 | £110,454 | 3% |
101 Properties |
| 2013 | £107,120 | -4% |
68 Properties |
| 2012 | £111,846 | 7% |
67 Properties |
| 2011 | £104,290 | -9% |
68 Properties |
| 2010 | £113,938 | -12% |
66 Properties |
| 2009 | £127,922 | 4% |
40 Properties |
| 2008 | £122,262 | -5% |
48 Properties |
| 2007 | £128,583 | 7% |
105 Properties |
| 2006 | £119,349 | 6% |
140 Properties |
| 2005 | £112,559 | 10% |
111 Properties |
| 2004 | £101,321 | 20% |
101 Properties |
| 2003 | £80,871 | 15% |
154 Properties |
| 2002 | £68,726 | 19% |
146 Properties |
| 2001 | £55,593 | 2% |
109 Properties |
| 2000 | £54,543 | 4% |
105 Properties |
| 1999 | £52,397 | -9% |
112 Properties |
| 1998 | £56,899 | 2% |
153 Properties |
| 1997 | £55,571 | 12% |
152 Properties |
| 1996 | £48,635 | 4% |
176 Properties |
| 1995 | £46,774 | - |
104 Properties |
Property Price per Property Type in Kidsgrove
Here you can find historic sold price data in order to help with your property search.
The average Property Paid Price for specific property types in the last three years are:
| Property Type | Average Sold Price | Sold Properties |
|---|---|---|
| Semi Detached House | £153,642.00 | 154 Semi Detached Houses |
| Detached House | £296,184.00 | 57 Detached Houses |
| Terraced House | £130,478.00 | 13 Terraced Houses |
| Flat | £89,995.00 | 1 Flat |

