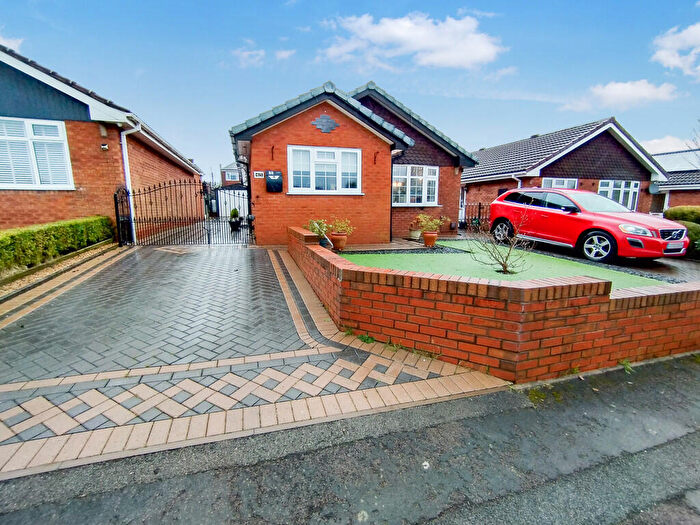
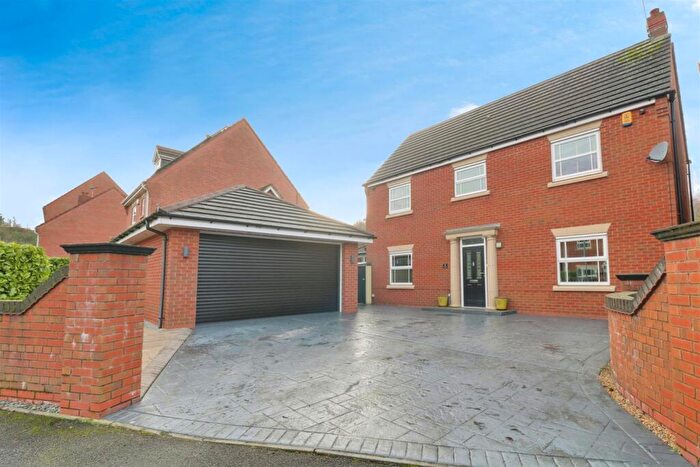
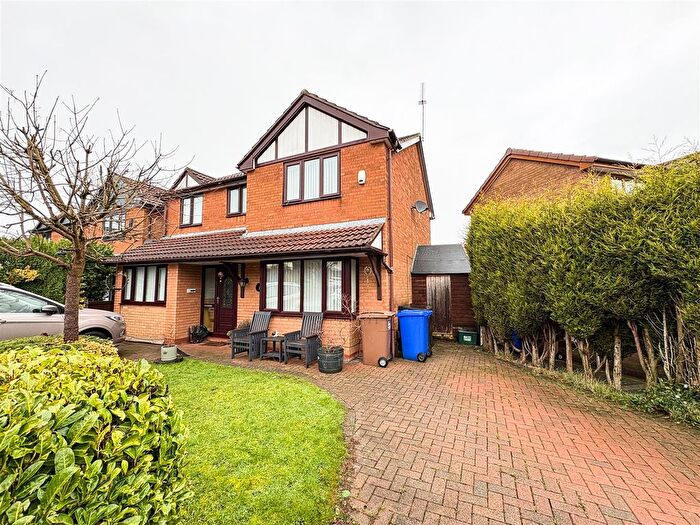
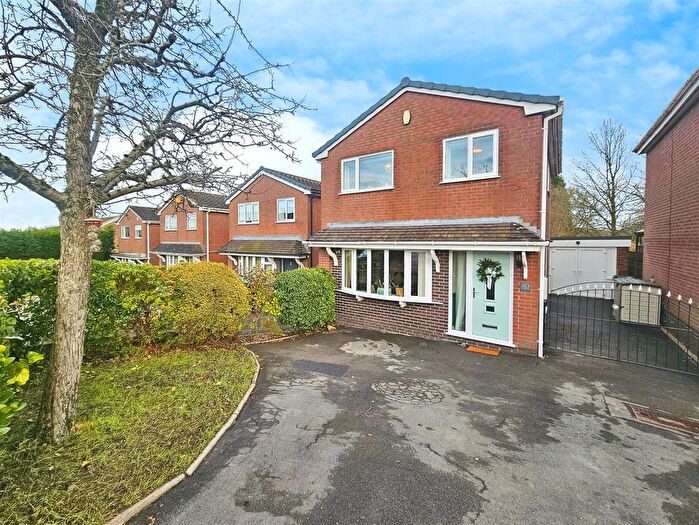
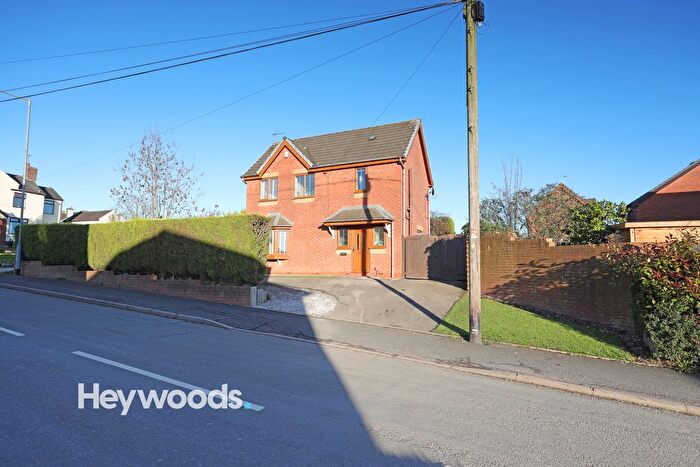
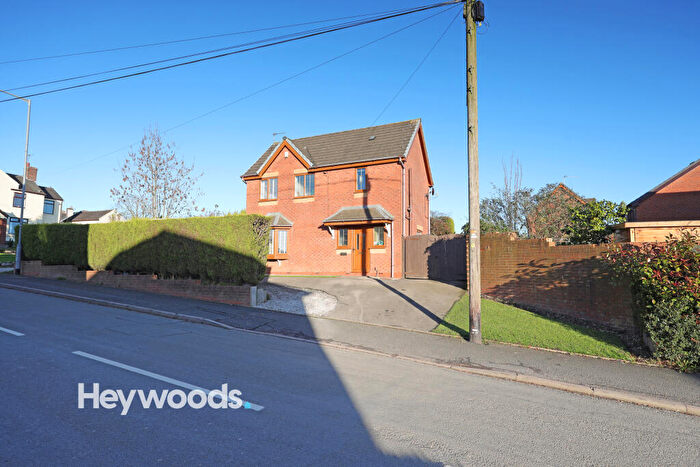
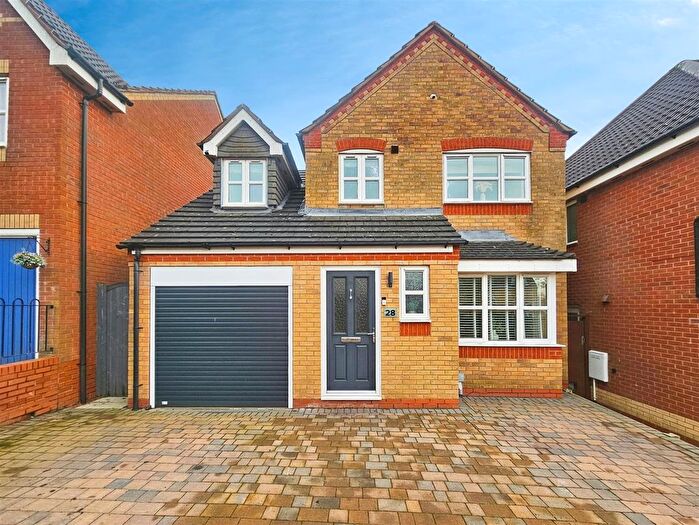
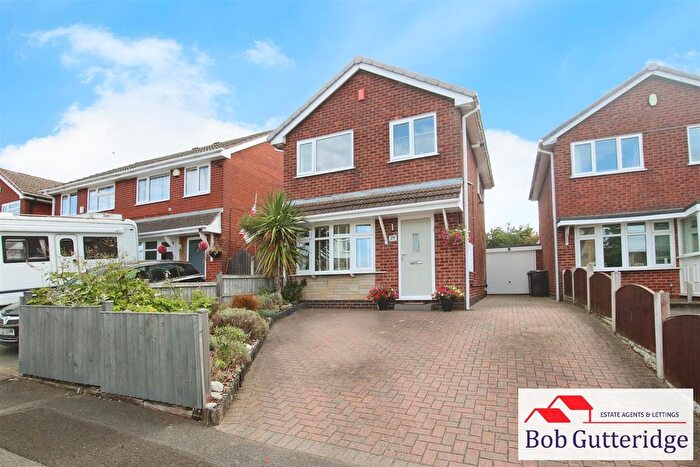
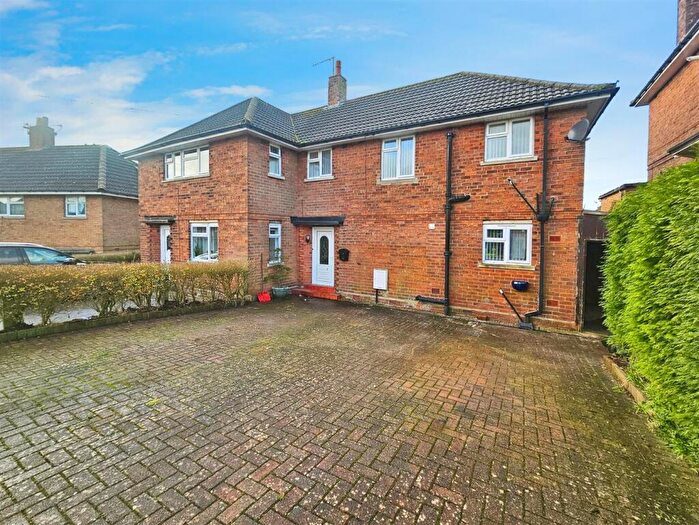
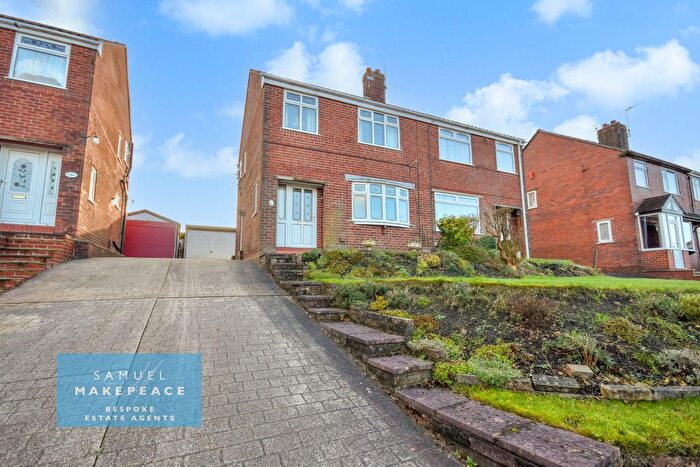
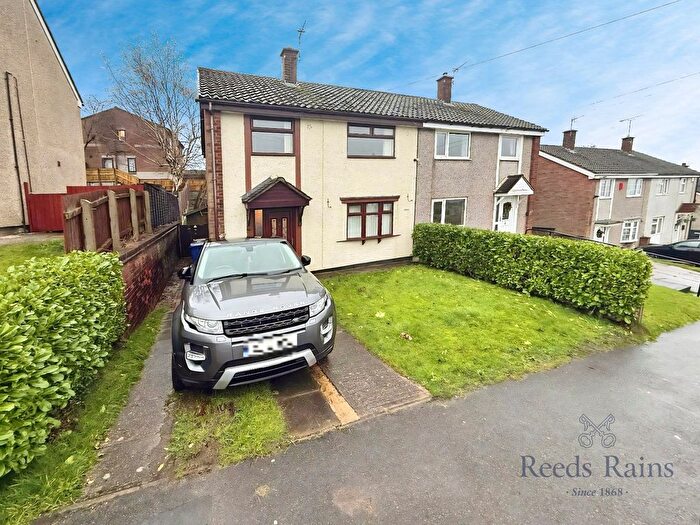
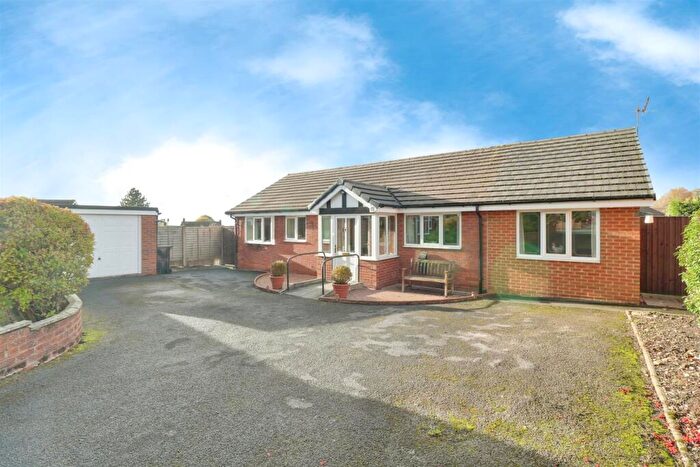
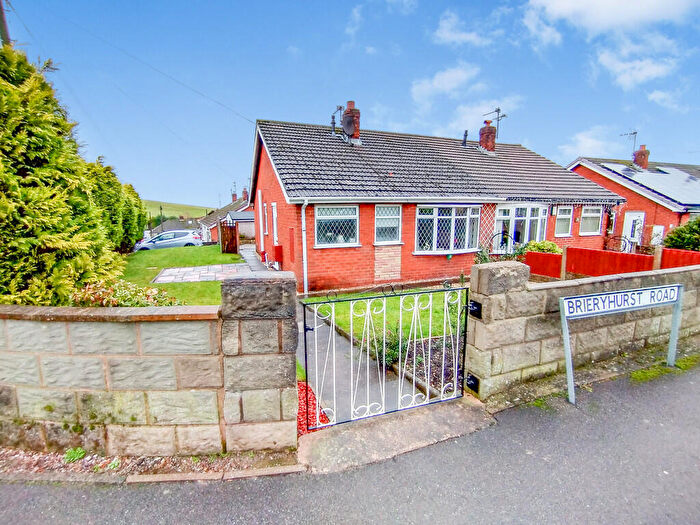
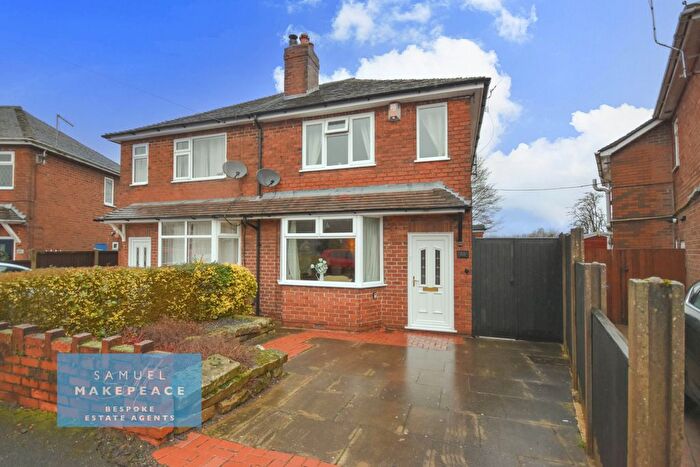
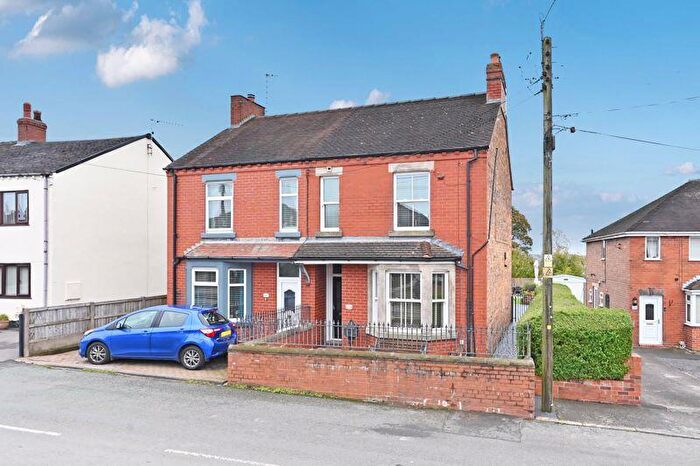
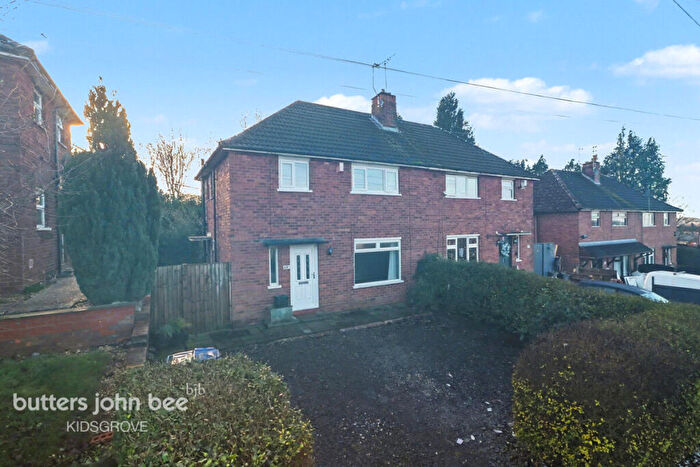
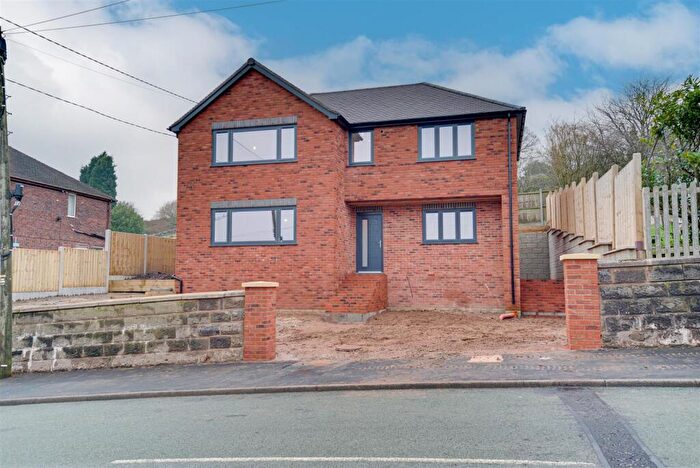
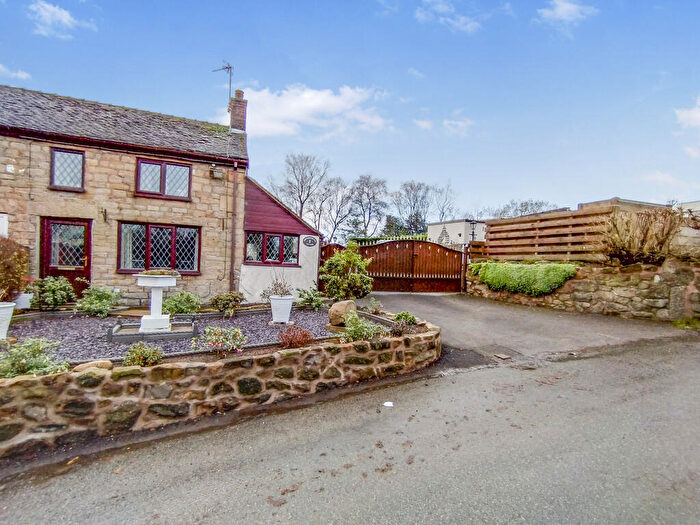
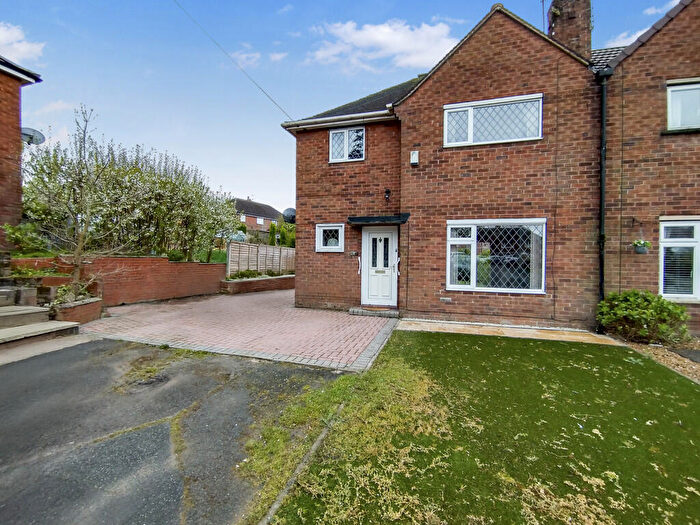
Houses for sale & to rent in Newchapel, Stoke-on-trent
House Prices in Newchapel
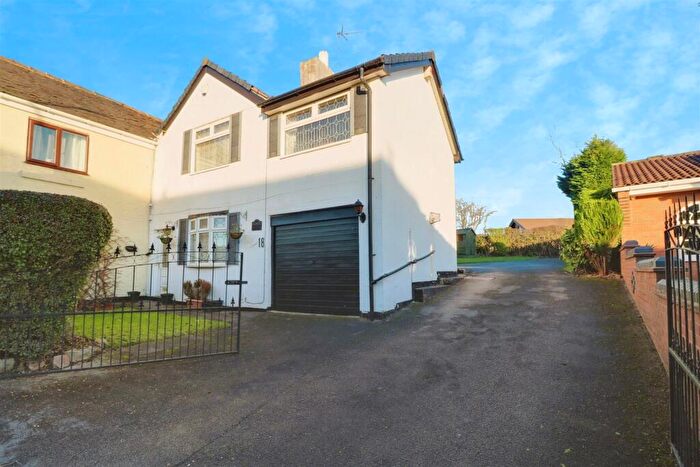
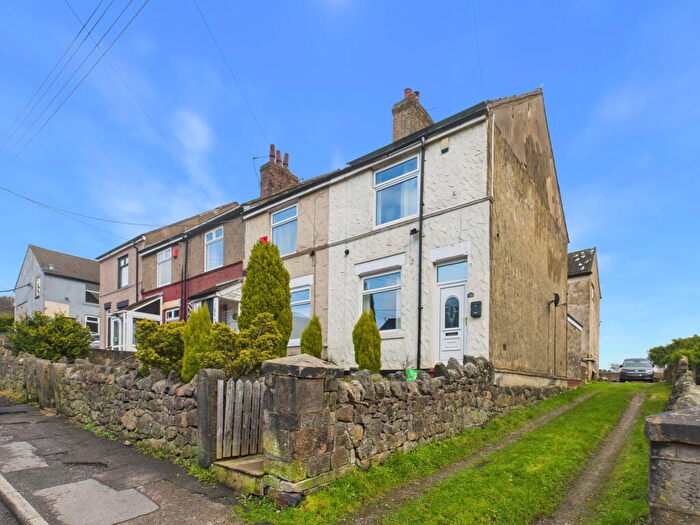
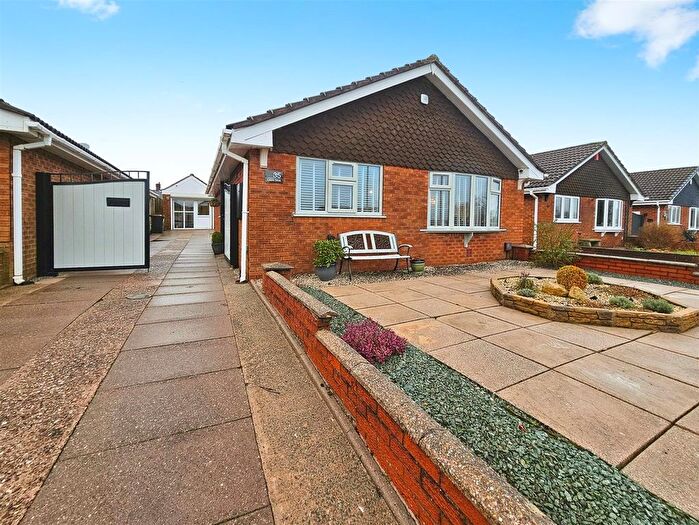
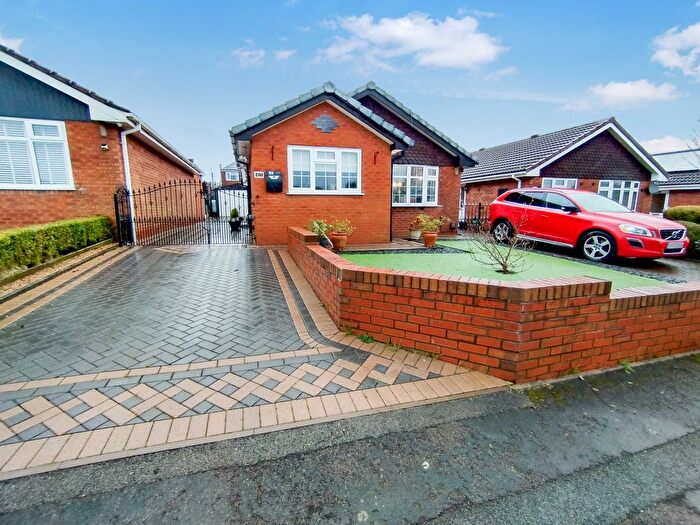
Properties in Newchapel have an average house price of £218,992.00 and had 199 Property Transactions within the last 3 years¹.
Newchapel is an area in Stoke-on-trent, Staffordshire with 1,496 households², where the most expensive property was sold for £645,000.00.
Properties for sale in Newchapel
Roads and Postcodes in Newchapel
Navigate through our locations to find the location of your next house in Newchapel, Stoke-on-trent for sale or to rent.
| Streets | Postcodes |
|---|---|
| Alderhay Lane | ST7 4RQ |
| Aspen Close | ST7 4HD |
| Biddulph Road | ST7 4LB ST7 4LD |
| Bullocks House Road | ST7 4JH ST7 4JQ |
| Castle Road | ST7 3PG ST7 3PH |
| Chapel Bank | ST7 3NA ST7 3NB ST7 4ND |
| Chapel Lane | ST7 4JJ ST7 4JL ST7 4JN ST7 4JW |
| Church Lane | ST7 4LR ST7 4LS ST7 4LX ST7 4LY |
| Clare Street | ST7 4JP |
| Congleton Road | ST7 3PJ |
| Cottonwood Grove | ST7 4UG |
| Dales Green Road | ST7 4RH ST7 4RJ |
| Ferndale Gardens | ST7 4FG |
| Fords Lane | ST7 4NG |
| Freedom Drive | ST7 4UQ |
| Hardings Row | ST7 3NE |
| Harriseahead Lane | ST7 4QZ ST7 4RB ST7 4RD |
| High Street | ST7 3ND ST7 3NZ ST7 4JG ST7 4JS ST7 4JT ST7 4JU ST7 4JX ST7 4PR ST7 4PT ST7 4PU |
| Hillside Close | ST7 4PQ |
| Holly Lane | ST7 4JY ST7 4LE |
| Ian Road | ST7 4PP ST7 4PW |
| Jasmine Crescent | ST7 4GZ |
| Laurel Drive | ST7 4LP ST7 4TX |
| Long Lane | ST7 4LH ST7 4LQ |
| Marsh Avenue | ST7 4PX |
| Meadow Court | ST7 4YW |
| Mellors Bank | ST7 4NQ |
| Moorland Road | ST7 4LT |
| Moorview Gardens | ST7 4XB |
| Mow Cop Road | ST7 4LZ ST7 4NA ST7 4NE ST7 4NF ST7 4NH |
| Newtown | ST7 4PZ ST7 4QA |
| Pennyfields Road | ST7 4PN ST7 4PS |
| Rockside | ST7 4PG |
| Sands Road | ST7 4JZ ST7 4LA |
| St Thomas Street | ST7 4LU |
| Stadmoreslow Lane | ST7 4SH |
| Station Road | ST7 4QS ST7 4QT |
| The Views | ST7 4PY |
| Wain Lee | ST7 4LF |
| Willowcroft Way | ST7 4YZ |
| ST7 4NB |
Transport near Newchapel
- FAQ
- Price Paid By Year
- Property Type Price
Frequently asked questions about Newchapel
What is the average price for a property for sale in Newchapel?
The average price for a property for sale in Newchapel is £218,992. This amount is 7% lower than the average price in Stoke-on-trent. There are 1,032 property listings for sale in Newchapel.
What streets have the most expensive properties for sale in Newchapel?
The streets with the most expensive properties for sale in Newchapel are Chapel Bank at an average of £433,666, Hillside Close at an average of £308,500 and Hardings Row at an average of £292,500.
What streets have the most affordable properties for sale in Newchapel?
The streets with the most affordable properties for sale in Newchapel are Clare Street at an average of £78,125, Chapel Lane at an average of £138,038 and Mellors Bank at an average of £140,000.
Which train stations are available in or near Newchapel?
Some of the train stations available in or near Newchapel are Kidsgrove, Alsager and Congleton.
Property Price Paid in Newchapel by Year
The average sold property price by year was:
| Year | Average Sold Price | Price Change |
Sold Properties
|
|---|---|---|---|
| 2025 | £220,207 | 6% |
31 Properties |
| 2024 | £207,266 | -8% |
58 Properties |
| 2023 | £224,187 | -1% |
61 Properties |
| 2022 | £225,635 | 4% |
49 Properties |
| 2021 | £215,680 | 17% |
87 Properties |
| 2020 | £179,992 | 15% |
74 Properties |
| 2019 | £153,492 | -6% |
53 Properties |
| 2018 | £163,359 | 8% |
69 Properties |
| 2017 | £150,220 | -7% |
58 Properties |
| 2016 | £161,312 | 10% |
63 Properties |
| 2015 | £145,334 | 12% |
52 Properties |
| 2014 | £127,824 | -14% |
61 Properties |
| 2013 | £145,908 | 23% |
49 Properties |
| 2012 | £112,566 | -26% |
44 Properties |
| 2011 | £141,741 | 11% |
35 Properties |
| 2010 | £126,543 | -1% |
37 Properties |
| 2009 | £128,201 | -8% |
34 Properties |
| 2008 | £138,614 | -15% |
36 Properties |
| 2007 | £158,891 | 3% |
76 Properties |
| 2006 | £154,776 | 16% |
44 Properties |
| 2005 | £129,607 | -2% |
71 Properties |
| 2004 | £132,689 | 26% |
65 Properties |
| 2003 | £98,439 | 2% |
71 Properties |
| 2002 | £96,102 | 39% |
105 Properties |
| 2001 | £58,835 | -6% |
72 Properties |
| 2000 | £62,654 | 8% |
61 Properties |
| 1999 | £57,619 | 14% |
78 Properties |
| 1998 | £49,743 | 7% |
75 Properties |
| 1997 | £46,100 | 11% |
51 Properties |
| 1996 | £40,859 | 0,1% |
64 Properties |
| 1995 | £40,813 | - |
46 Properties |
Property Price per Property Type in Newchapel
Here you can find historic sold price data in order to help with your property search.
The average Property Paid Price for specific property types in the last three years are:
| Property Type | Average Sold Price | Sold Properties |
|---|---|---|
| Semi Detached House | £193,655.00 | 97 Semi Detached Houses |
| Detached House | £328,588.00 | 56 Detached Houses |
| Terraced House | £137,605.00 | 42 Terraced Houses |
| Flat | £153,625.00 | 4 Flats |

