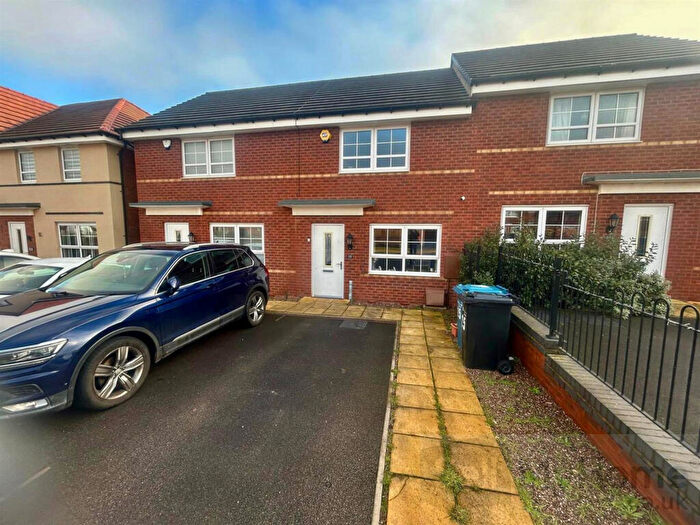
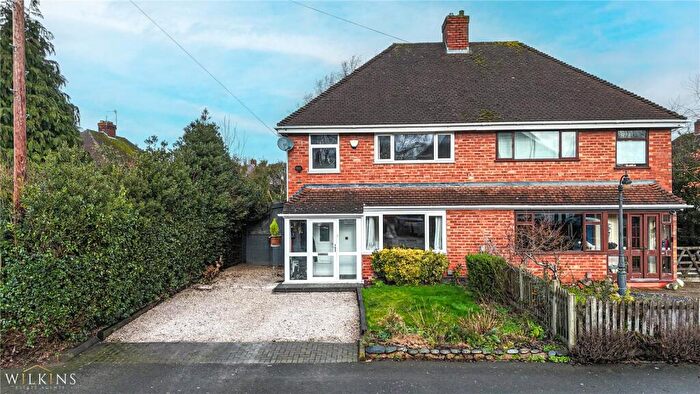
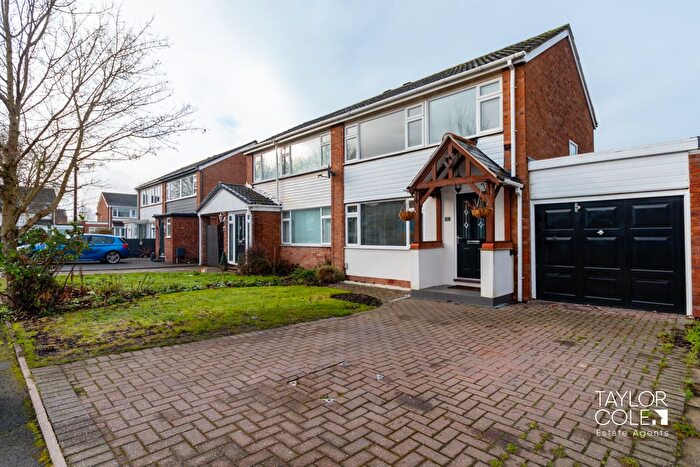
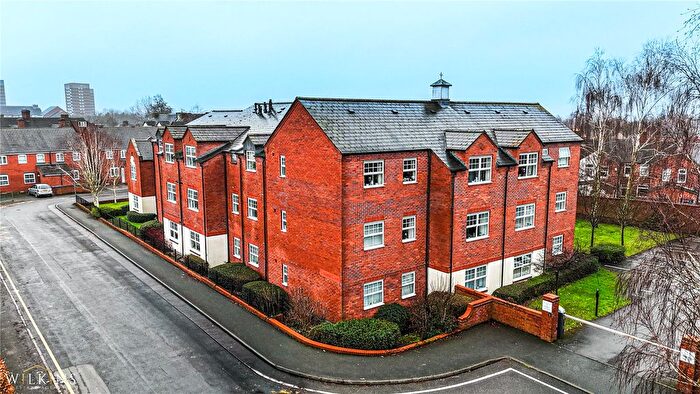
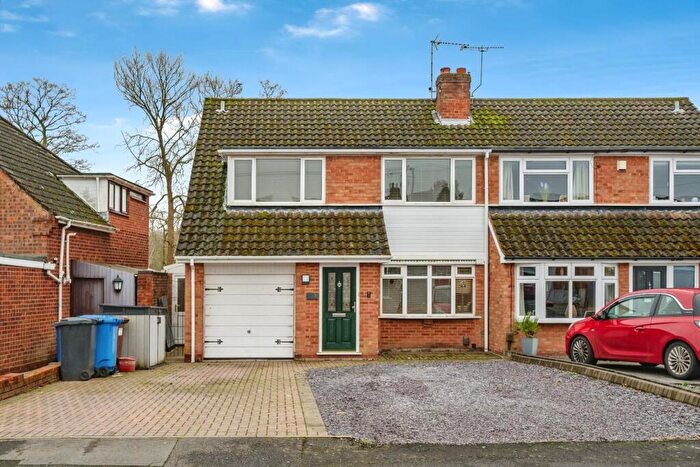
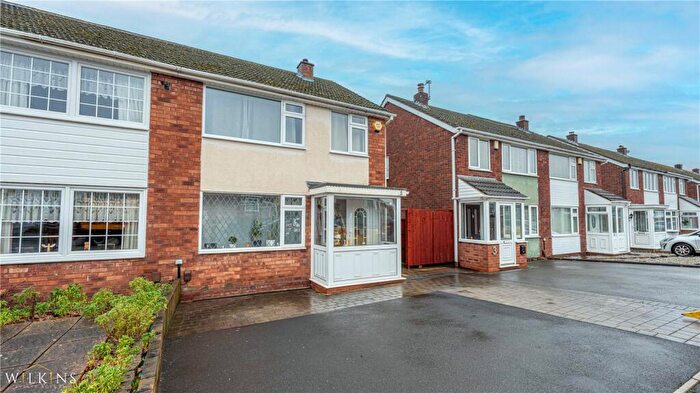
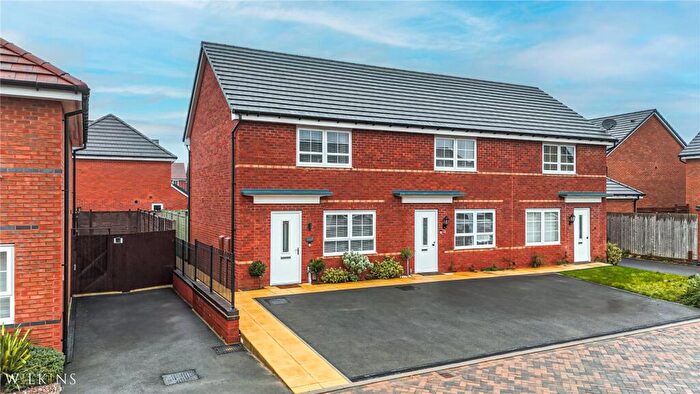
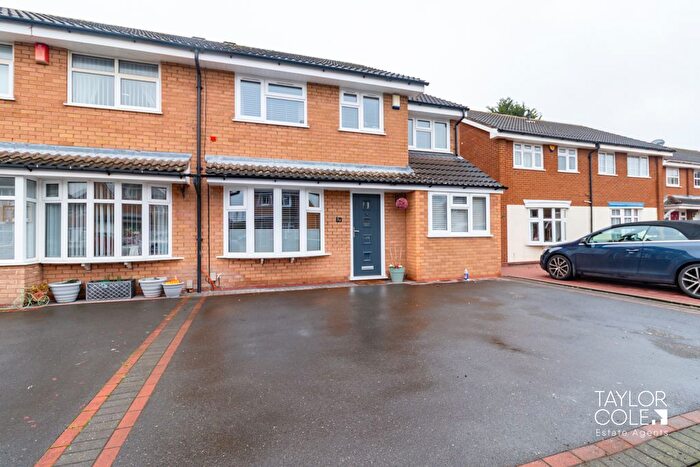
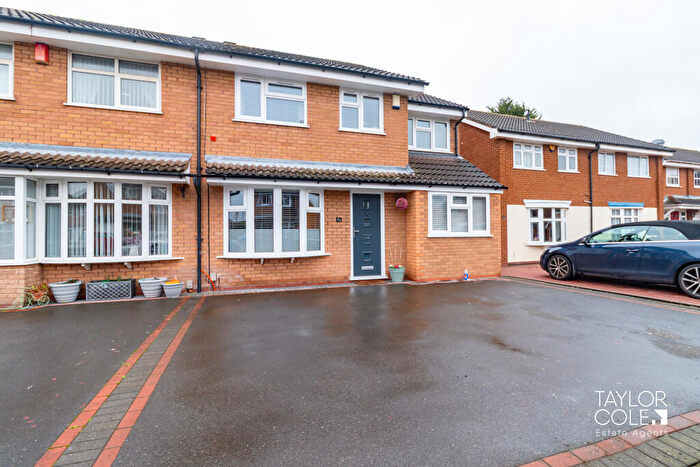
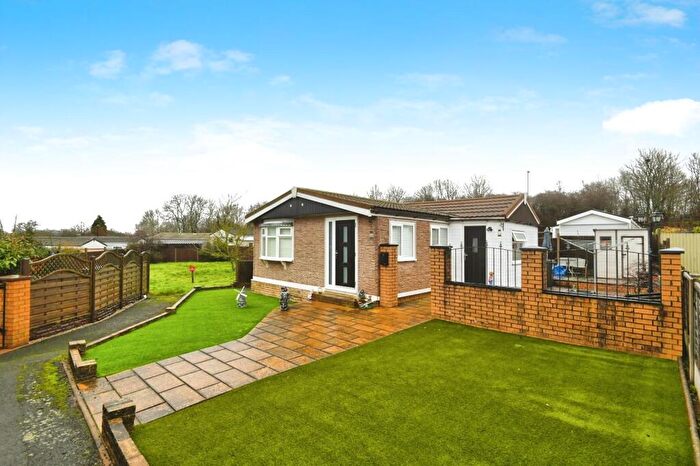
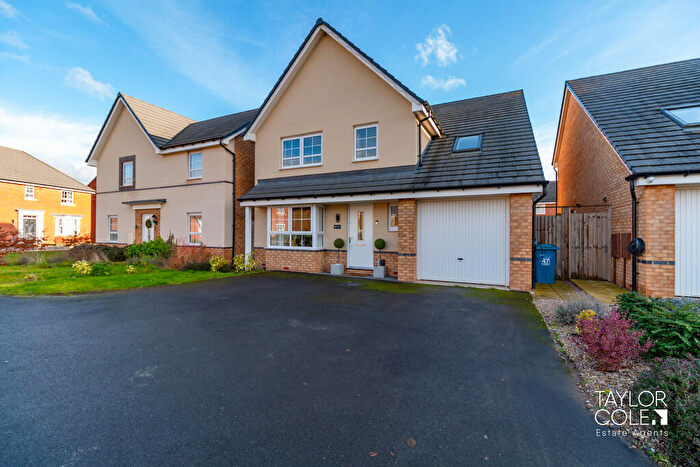
Houses for sale & to rent in Fazeley, Tamworth
House Prices in Fazeley
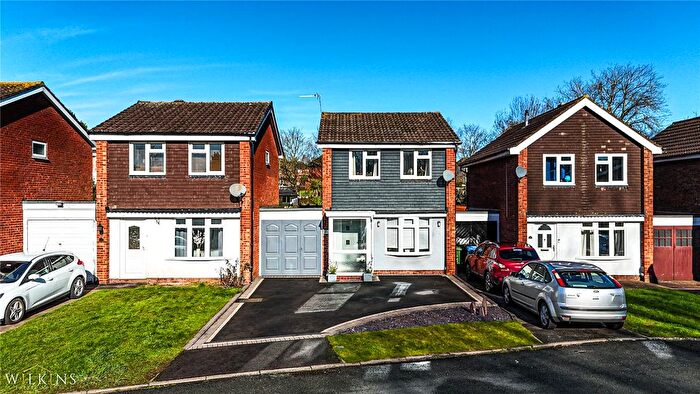
Properties in Fazeley have an average house price of £265,669.00 and had 178 Property Transactions within the last 3 years¹.
Fazeley is an area in Tamworth, Staffordshire with 1,987 households², where the most expensive property was sold for £850,000.00.
Properties for sale in Fazeley
Roads and Postcodes in Fazeley
Navigate through our locations to find the location of your next house in Fazeley, Tamworth for sale or to rent.
| Streets | Postcodes |
|---|---|
| Affleck Avenue | B78 3NJ |
| Albert Road | B78 3QJ |
| Aldin Close | B78 3HT |
| Allton Avenue | B78 3NH |
| Atherstone Street | B78 3RF |
| Bonehill Mews | B78 3QU |
| Bonehill Road | B78 3PS B78 3HP |
| Bourne Avenue | B78 3TB |
| Brewster Close | B78 3QT |
| Brook End | B78 3RR B78 3RS B78 3RT |
| Brookside Road | B78 3NR |
| Broomfield Avenue | B78 3QL |
| Buxton Avenue | B78 3RP |
| Caistor Close | B78 3PT |
| Chapel Drive | B78 3PX |
| Coleshill Road | B78 3RY B78 3SA |
| Coleshill Street | B78 3RA B78 3RB B78 3RG B78 3RQ |
| Coronation Avenue | B78 3NN B78 3NW |
| Cranwell Rise | B78 3PU |
| Dama Road | B78 3SU |
| Deer Park Road | B78 3SY B78 3SZ B78 3QP |
| Drayton Manor Drive | B78 3SH B78 3TJ |
| Evans Croft | B78 3QY |
| Fallow Road | B78 3SJ |
| Fox Hollow Drive | B78 3LX |
| French Avenue | B78 3PB |
| Gainsborough Drive | B78 3PJ |
| George Avenue | B78 3PN B78 3PW |
| Greenwood Place | B78 3BL |
| Heathcote Drive | B78 3PY |
| Hints Road | B78 3DR B78 3DS B78 3PQ B78 3DJ B78 3PG |
| Kirkland Way | B78 3PL |
| Lakeside Industrial Park | B78 3NT |
| Lichfield Street | B78 3QE B78 3QF B78 3QG B78 3QN B78 3QQ B78 3QA B78 3QS B78 3QW |
| Littlefield Close | B78 3QR |
| Longwood Path | B78 3NP |
| Manor Court | B78 3NY |
| Manor Road | B78 3NA B78 3NB |
| Marina View | B78 3BF |
| Mayama Road | B78 3SX |
| Mayfair Drive | B78 3TG |
| Mill Lane | B78 3QD |
| New Mill Lane | B78 3RX |
| New Street | B78 3RD |
| Oak Drive | B78 3PR |
| Park Lane | B78 3HX B78 3HY B78 3HZ |
| Plantation Lane | B78 3DQ B78 3NG |
| Price Avenue | B78 3NL |
| Rangifer Road | B78 3ST |
| Reindeer Road | B78 3SL B78 3SN B78 3SP B78 3SR B78 3SW |
| Riverside Industrial Estate | B78 3RW B78 3SD |
| Sambar Road | B78 3SS |
| Stud Farm Drive | B78 3HS |
| Sutton Road | B78 3PA B78 3PD B78 3PE B78 3PF B78 3PH |
| Tamworth Road | B78 3RJ B78 3RH |
| The Green | B78 3HW |
| The Island | B78 3PP |
| The Laurels | B78 3EH B78 3EJ |
| Tolson Avenue | B78 3RU |
| Tolson Court | B78 3UZ |
| Victoria Drive | B78 3QH |
| Victory Terrace | B78 3RE |
| Watling Street | B78 3ND B78 3NE B78 3NF B78 3RN |
| West Drive | B78 3HR |
| Yorksand Road | B78 3TA |
Transport near Fazeley
- FAQ
- Price Paid By Year
- Property Type Price
Frequently asked questions about Fazeley
What is the average price for a property for sale in Fazeley?
The average price for a property for sale in Fazeley is £265,669. This amount is 4% higher than the average price in Tamworth. There are 1,908 property listings for sale in Fazeley.
What streets have the most expensive properties for sale in Fazeley?
The streets with the most expensive properties for sale in Fazeley are Chapel Drive at an average of £750,000, Gainsborough Drive at an average of £655,000 and Park Lane at an average of £533,000.
What streets have the most affordable properties for sale in Fazeley?
The streets with the most affordable properties for sale in Fazeley are Marina View at an average of £140,875, Oak Drive at an average of £152,237 and Allton Avenue at an average of £155,000.
Which train stations are available in or near Fazeley?
Some of the train stations available in or near Fazeley are Wilnecote, Tamworth Low Level and Polesworth.
Property Price Paid in Fazeley by Year
The average sold property price by year was:
| Year | Average Sold Price | Price Change |
Sold Properties
|
|---|---|---|---|
| 2025 | £244,583 | -10% |
48 Properties |
| 2024 | £269,978 | -3% |
70 Properties |
| 2023 | £277,510 | 7% |
60 Properties |
| 2022 | £257,287 | -1% |
79 Properties |
| 2021 | £259,883 | 12% |
83 Properties |
| 2020 | £229,450 | 8% |
65 Properties |
| 2019 | £211,394 | -5% |
67 Properties |
| 2018 | £222,480 | -2% |
75 Properties |
| 2017 | £226,644 | 15% |
78 Properties |
| 2016 | £193,110 | 5% |
83 Properties |
| 2015 | £183,644 | 8% |
68 Properties |
| 2014 | £168,879 | 3% |
85 Properties |
| 2013 | £164,285 | 1% |
58 Properties |
| 2012 | £161,908 | -5% |
57 Properties |
| 2011 | £169,856 | -6% |
49 Properties |
| 2010 | £180,724 | -5% |
35 Properties |
| 2009 | £189,830 | -3% |
30 Properties |
| 2008 | £195,159 | 5% |
47 Properties |
| 2007 | £185,772 | -4% |
100 Properties |
| 2006 | £192,364 | 16% |
71 Properties |
| 2005 | £162,490 | -5% |
32 Properties |
| 2004 | £170,704 | 13% |
92 Properties |
| 2003 | £148,050 | 14% |
65 Properties |
| 2002 | £126,678 | 30% |
92 Properties |
| 2001 | £88,772 | 4% |
78 Properties |
| 2000 | £85,054 | 13% |
100 Properties |
| 1999 | £74,373 | 4% |
67 Properties |
| 1998 | £71,169 | -0,2% |
52 Properties |
| 1997 | £71,328 | -0,3% |
64 Properties |
| 1996 | £71,576 | 20% |
85 Properties |
| 1995 | £57,466 | - |
37 Properties |
Property Price per Property Type in Fazeley
Here you can find historic sold price data in order to help with your property search.
The average Property Paid Price for specific property types in the last three years are:
| Property Type | Average Sold Price | Sold Properties |
|---|---|---|
| Semi Detached House | £255,068.00 | 80 Semi Detached Houses |
| Detached House | £448,725.00 | 33 Detached Houses |
| Terraced House | £223,074.00 | 27 Terraced Houses |
| Flat | £159,281.00 | 38 Flats |

