
Houses for sale & to rent in NR35 1DE, Castle Lane, Bungay, Bungay
House Prices in NR35 1DE, Castle Lane, Bungay
Properties in NR35 1DE have no sales history available within the last 3 years. NR35 1DE is a postcode in Castle Lane located in Bungay, an area in Bungay, Suffolk, with 5 households².
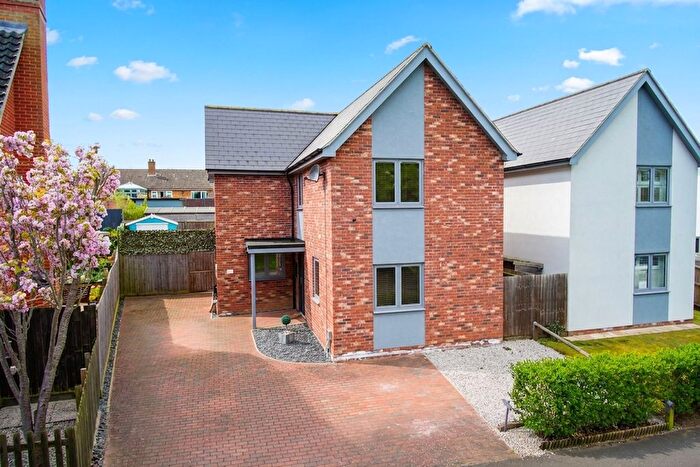
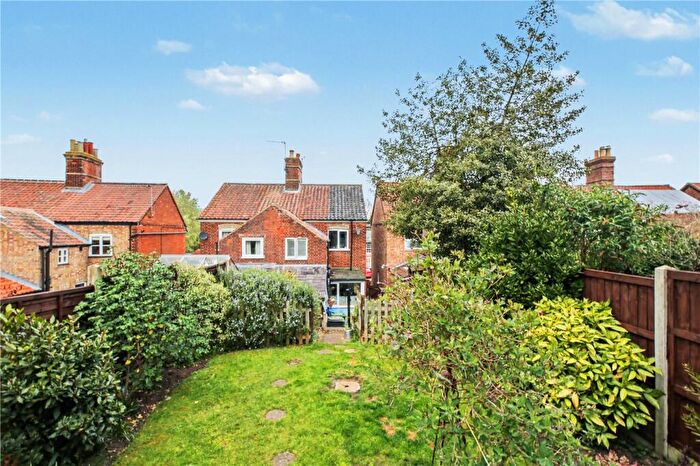
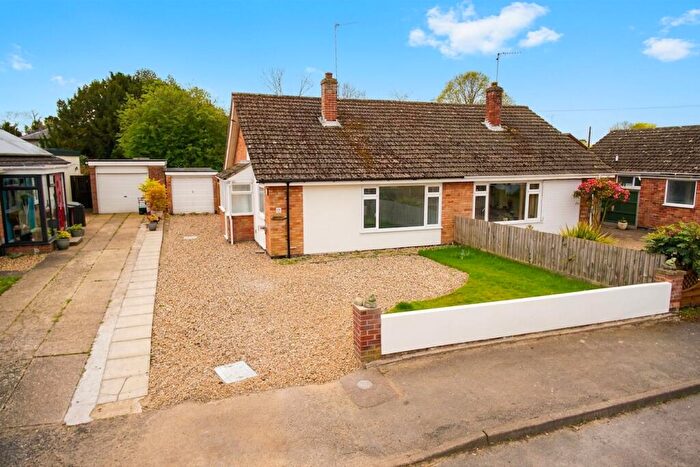
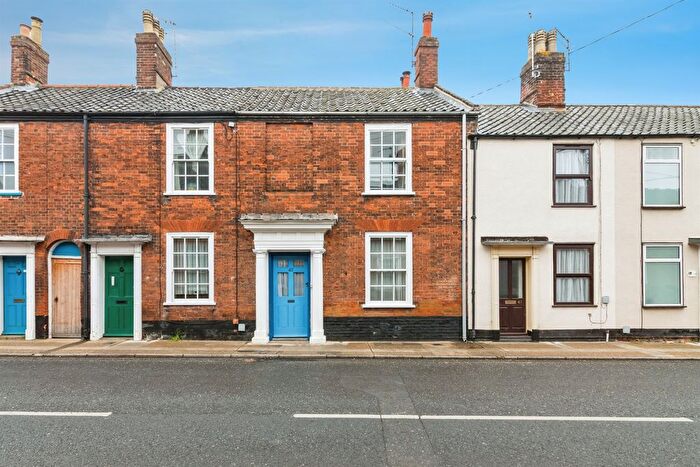
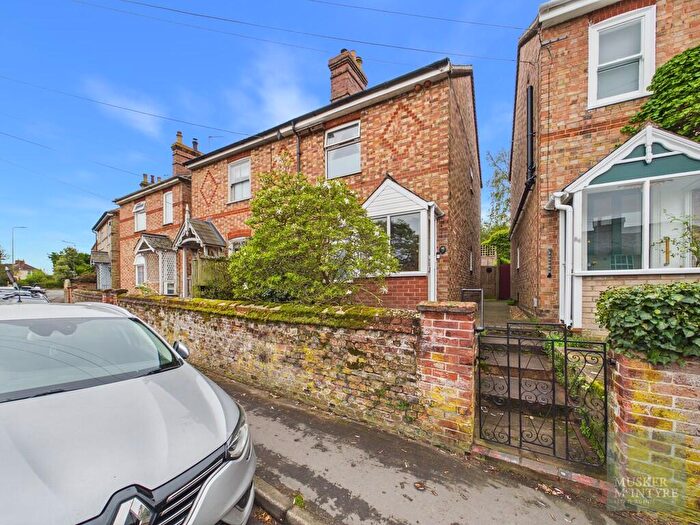
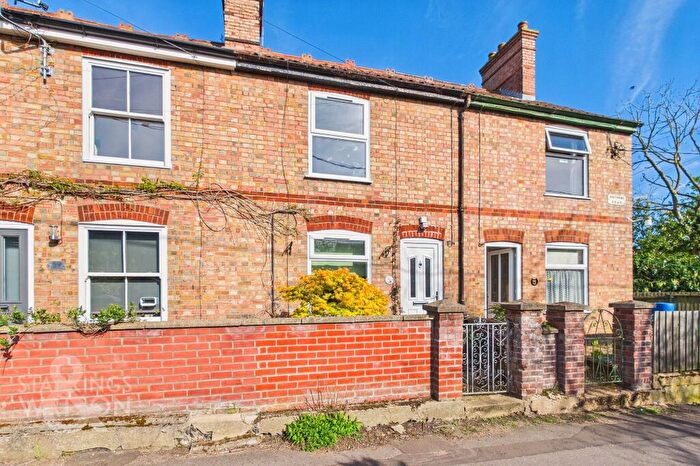
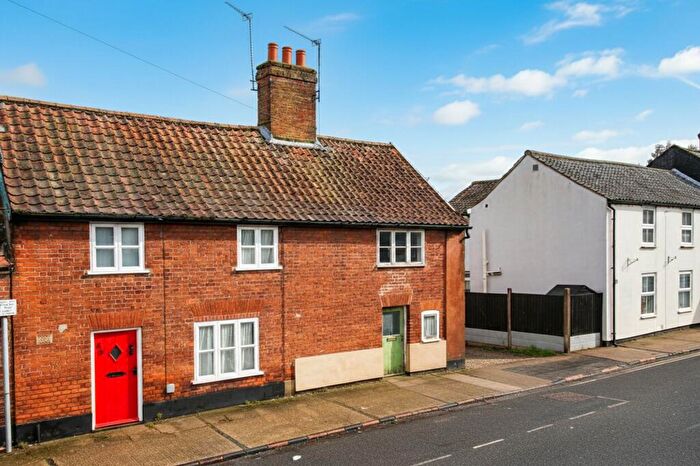
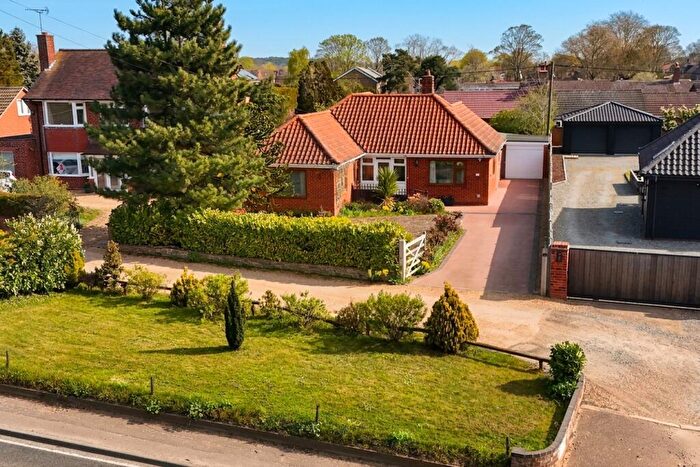
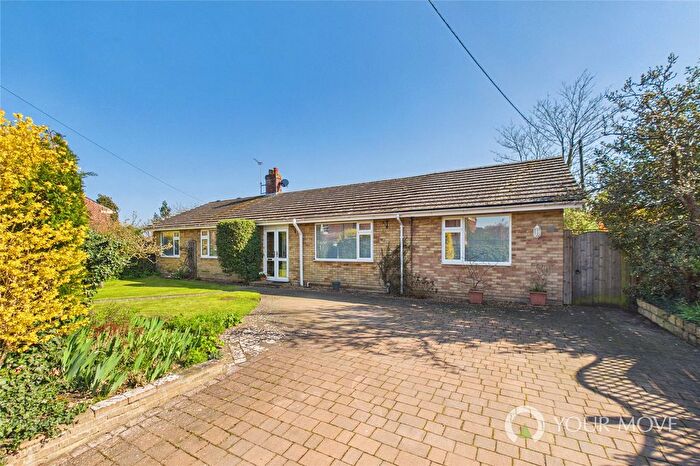
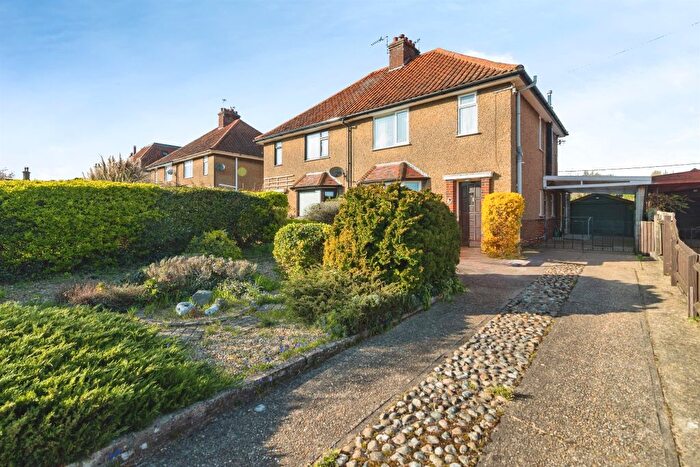
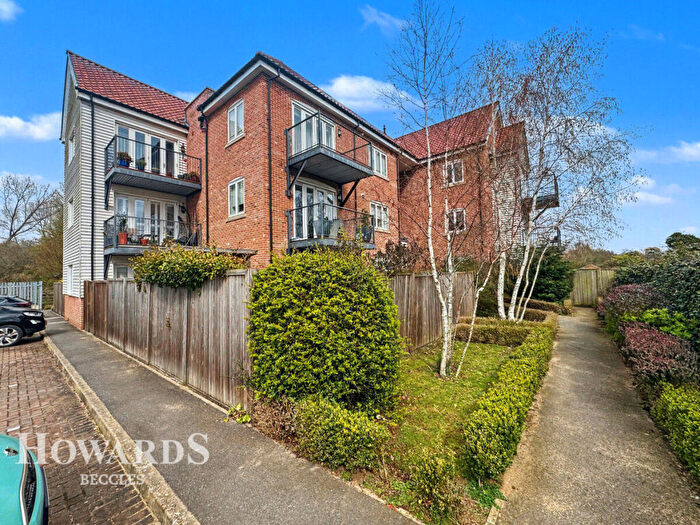
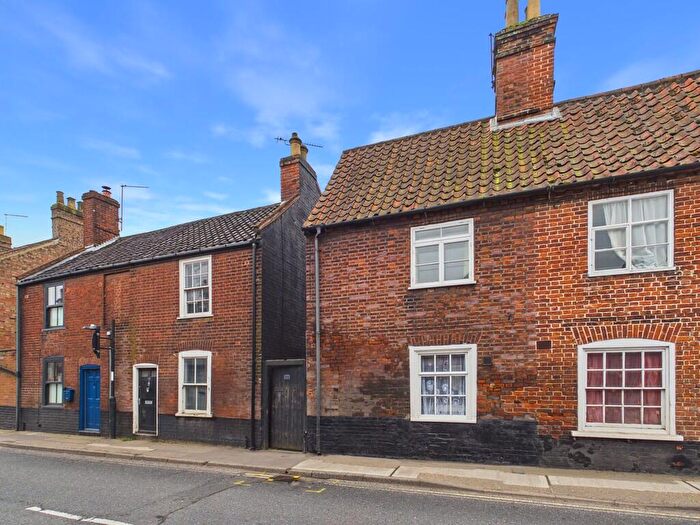
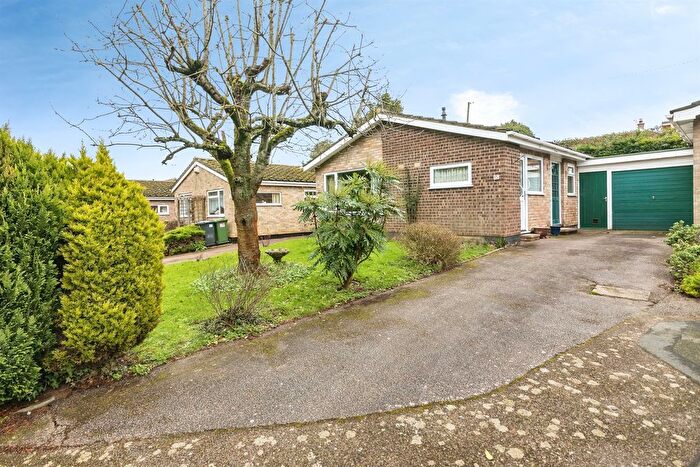
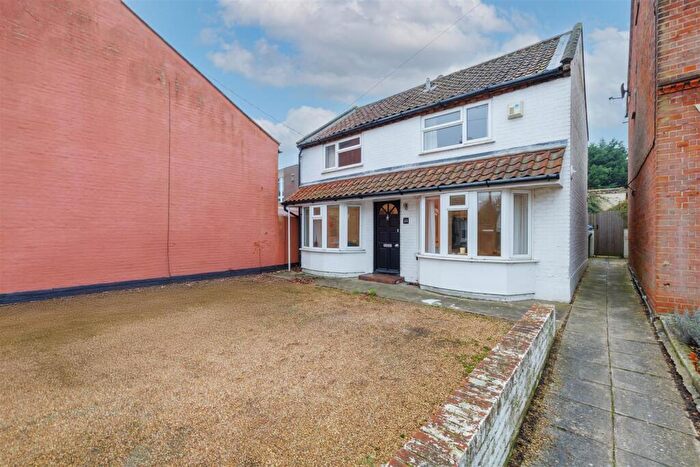
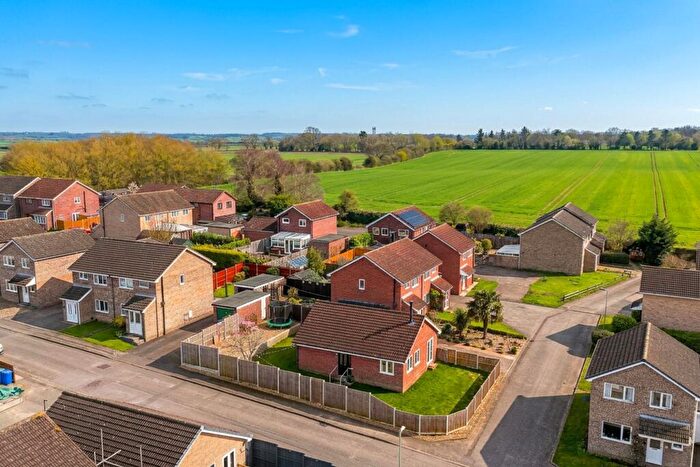
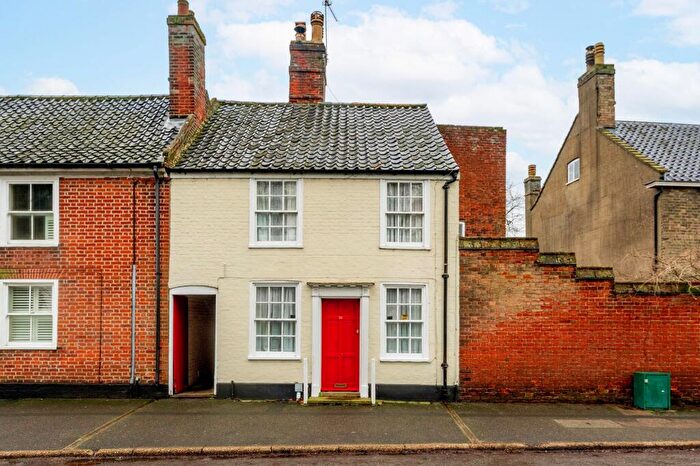
Properties for sale near NR35 1DE, Castle Lane
![]()
If you are looking to sell your house, let it out, or receive a property valuation, an expert can help you.
Click the button below to get started.
Price Paid in Castle Lane, NR35 1DE, Bungay
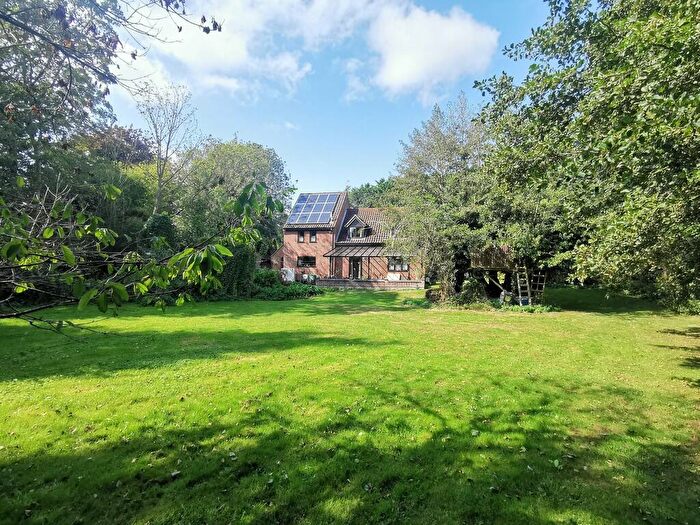
WILLOW FEN Castle Lane, NR35 1DE, Bungay Bungay
Property WILLOW FEN has been sold 3 times. The last time it was sold was in 08/10/2021 and the sold price was £756,500.00.
This detached house, sold as a freehold on 08/10/2021, is a 168 sqm detached bungalow with an EPC rating of D.
| Date | Price | Property Type | Tenure | Classification |
|---|---|---|---|---|
| 08/10/2021 | £756,500.00 | Detached House | freehold | Established Building |
| 11/10/2002 | £250,000.00 | Detached House | freehold | Established Building |
| 19/09/2000 | £160,000.00 | Detached House | freehold | Established Building |
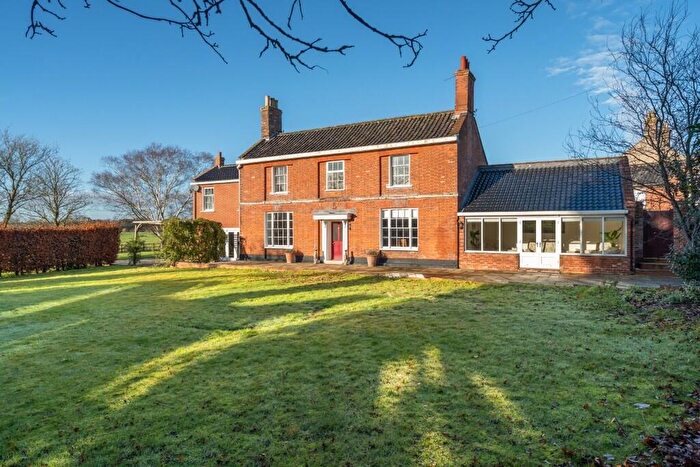
THE MOORINGS Castle Lane, NR35 1DE, Bungay Bungay
Property THE MOORINGS has been sold 1 time. The last time it was sold was in 01/04/2004 and the sold price was £345,000.00.
This is a Detached House which was sold as a freehold in 01/04/2004
| Date | Price | Property Type | Tenure | Classification |
|---|---|---|---|---|
| 01/04/2004 | £345,000.00 | Detached House | freehold | Established Building |
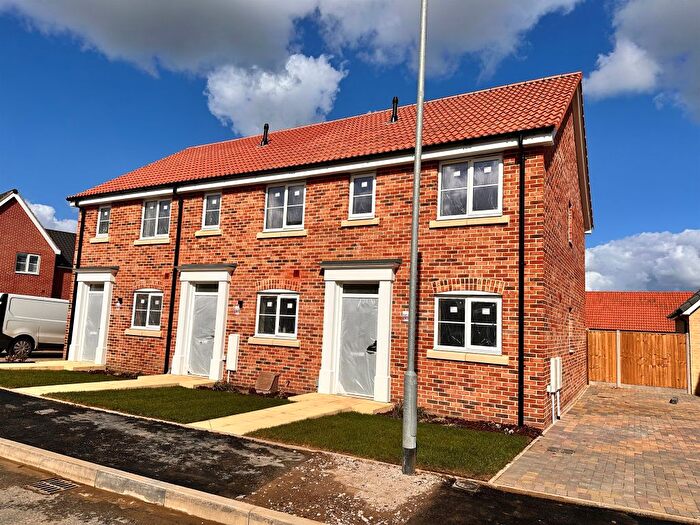
3 Castle Lane, NR35 1DE, Bungay Bungay
This is a 65 square meter Detached House with an EPC rating of D. Currently, there is no transaction history available for this property.
Transport near NR35 1DE, Castle Lane
-
 Beccles Station
 -
Brampton (Suffolk) Station
-
Halesworth Station
-
Cantley Station
-
Reedham (Norfolk) Station
-
Haddiscoe Station
-
Somerleyton Station
-
Buckenham Station
House price paid reports for NR35 1DE, Castle Lane
Click on the buttons below to see price paid reports by year or property price:
- Price Paid By Year
Property Price Paid in NR35 1DE, Castle Lane by Year
The average sold property price by year was:
| Year | Average Sold Price | Price Change |
Sold Properties
|
|---|---|---|---|
| 2021 | £756,500 | 54% |
1 Property |
| 2004 | £345,000 | 28% |
1 Property |
| 2002 | £250,000 | 36% |
1 Property |
| 2000 | £160,000 | - |
1 Property |