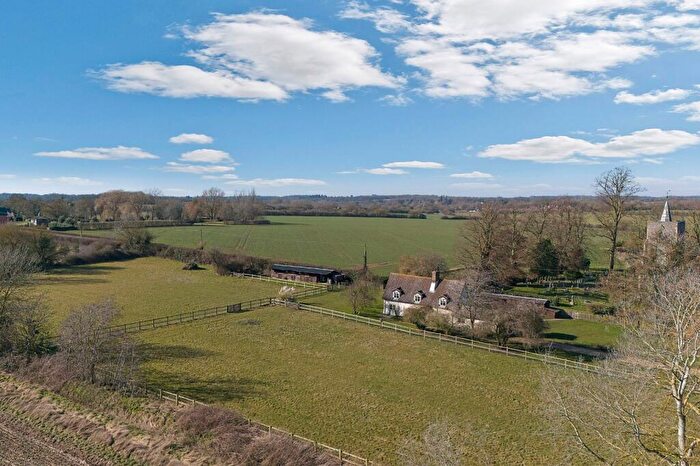
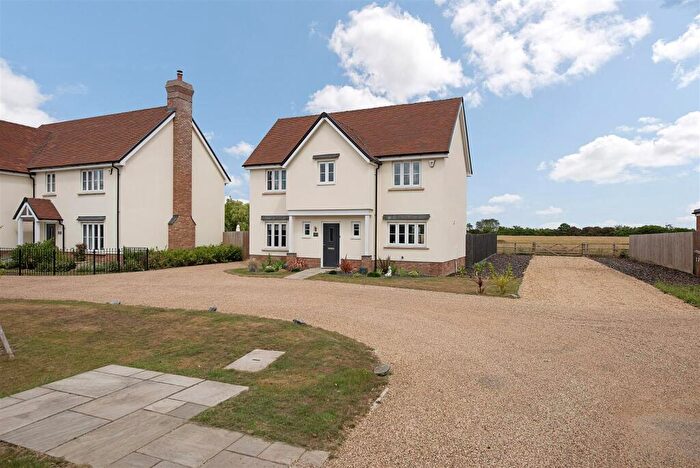
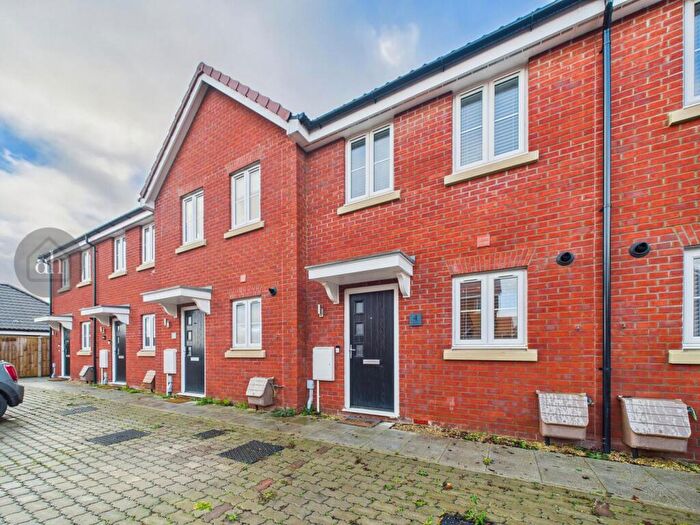
Houses for sale & to rent in Badwell Ash, Bury St Edmunds
House Prices in Badwell Ash
Properties in Badwell Ash have an average house price of £469,251.00 and had 52 Property Transactions within the last 3 years¹.
Badwell Ash is an area in Bury St Edmunds, Suffolk with 588 households², where the most expensive property was sold for £1,440,000.00.
Properties for sale in Badwell Ash
Roads and Postcodes in Badwell Ash
Navigate through our locations to find the location of your next house in Badwell Ash, Bury St Edmunds for sale or to rent.
| Streets | Postcodes |
|---|---|
| Ash Mead | IP31 3DX |
| Austin Close | IP31 3EQ |
| Back Lane | IP31 3DW |
| Badwell Green | IP31 3JG |
| Church Green | IP31 3HG |
| Church View | IP31 3JW |
| Daisy Green | IP31 3HS IP31 3HT IP31 3HX IP31 3HW |
| Dovedale Close | IP31 3EY |
| Elmswell Road | IP31 3HH IP31 3HQ |
| Hall Farm Cottages | IP31 3EG |
| Hunston Road | IP31 3DJ |
| Ixworth Road | IP31 3JS |
| Kiln Lane | IP31 3JZ |
| Langham Road | IP31 3DS |
| Long Thurlow | IP31 3JA IP31 3JE IP31 3JF |
| Long Thurlow Road | IP31 3EX IP31 3HY IP31 3HZ |
| Main Road | IP31 3HE |
| Norton Road | IP31 3HJ |
| Old School Cottage | IP31 3EE |
| Old Vicarage Drive | IP31 3DU |
| Orchard Way | IP31 3JL |
| Richer Close | IP31 3ET |
| Richer Road | IP31 3DQ IP31 3EU |
| Saxon Meadows | IP31 3EJ |
| School Road | IP31 3HN |
| St Georges Road | IP31 3JP |
| St Marys Crescent | IP31 3DN |
| The Broadway | IP31 3DR |
| The Green | IP31 3EP |
| The Paddocks | IP31 3LW |
| The Row | IP31 3JD |
| The Street | IP31 3DG IP31 3DH IP31 3JX IP31 3DP IP31 3JN |
| Walsham Road | IP31 3JH |
| Warren Close | IP31 3ER |
| Westley Way | IP31 3DL |
| Wetherden Road | IP31 3HR |
| Wheelers Lane | IP31 3HP |
| Willow Close | IP31 3DT |
| Willow Drive | IP31 3JQ |
| IP31 3EB IP31 3EL IP31 3EN IP31 3HA |
Transport near Badwell Ash
- FAQ
- Price Paid By Year
- Property Type Price
Frequently asked questions about Badwell Ash
What is the average price for a property for sale in Badwell Ash?
The average price for a property for sale in Badwell Ash is £469,251. This amount is 34% higher than the average price in Bury St Edmunds. There are 638 property listings for sale in Badwell Ash.
What streets have the most expensive properties for sale in Badwell Ash?
The streets with the most expensive properties for sale in Badwell Ash are Langham Road at an average of £642,500, Daisy Green at an average of £615,000 and Wetherden Road at an average of £615,000.
What streets have the most affordable properties for sale in Badwell Ash?
The streets with the most affordable properties for sale in Badwell Ash are The Row at an average of £198,500, Richer Close at an average of £210,000 and St Marys Crescent at an average of £254,000.
Which train stations are available in or near Badwell Ash?
Some of the train stations available in or near Badwell Ash are Elmswell, Thurston and Stowmarket.
Property Price Paid in Badwell Ash by Year
The average sold property price by year was:
| Year | Average Sold Price | Price Change |
Sold Properties
|
|---|---|---|---|
| 2025 | £459,423 | -2% |
13 Properties |
| 2024 | £470,218 | -1% |
25 Properties |
| 2023 | £476,651 | 2% |
14 Properties |
| 2022 | £468,539 | -18% |
23 Properties |
| 2021 | £553,440 | 20% |
41 Properties |
| 2020 | £444,800 | 11% |
15 Properties |
| 2019 | £396,365 | 9% |
26 Properties |
| 2018 | £359,416 | -0,5% |
18 Properties |
| 2017 | £361,206 | -3% |
23 Properties |
| 2016 | £372,569 | 15% |
36 Properties |
| 2015 | £315,590 | 8% |
38 Properties |
| 2014 | £290,257 | 8% |
27 Properties |
| 2013 | £267,061 | 1% |
26 Properties |
| 2012 | £265,724 | 6% |
20 Properties |
| 2011 | £250,066 | -5% |
15 Properties |
| 2010 | £262,598 | 2% |
17 Properties |
| 2009 | £258,023 | -3% |
21 Properties |
| 2008 | £266,248 | -17% |
21 Properties |
| 2007 | £311,978 | 7% |
37 Properties |
| 2006 | £289,497 | 6% |
23 Properties |
| 2005 | £271,649 | 12% |
22 Properties |
| 2004 | £239,419 | -4% |
33 Properties |
| 2003 | £248,839 | 18% |
28 Properties |
| 2002 | £205,112 | 37% |
35 Properties |
| 2001 | £129,842 | -6% |
28 Properties |
| 2000 | £137,944 | 19% |
23 Properties |
| 1999 | £111,185 | -8% |
27 Properties |
| 1998 | £120,402 | 15% |
25 Properties |
| 1997 | £102,481 | 21% |
32 Properties |
| 1996 | £80,994 | 7% |
26 Properties |
| 1995 | £75,218 | - |
22 Properties |
Property Price per Property Type in Badwell Ash
Here you can find historic sold price data in order to help with your property search.
The average Property Paid Price for specific property types in the last three years are:
| Property Type | Average Sold Price | Sold Properties |
|---|---|---|
| Semi Detached House | £302,294.00 | 17 Semi Detached Houses |
| Detached House | £596,191.00 | 29 Detached Houses |
| Terraced House | £328,750.00 | 6 Terraced Houses |

