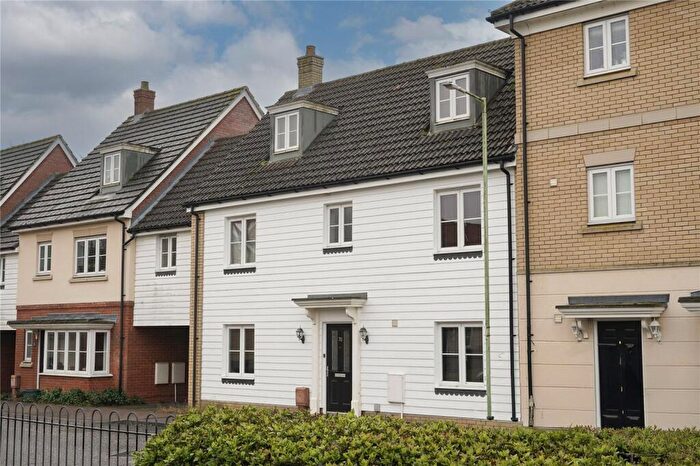
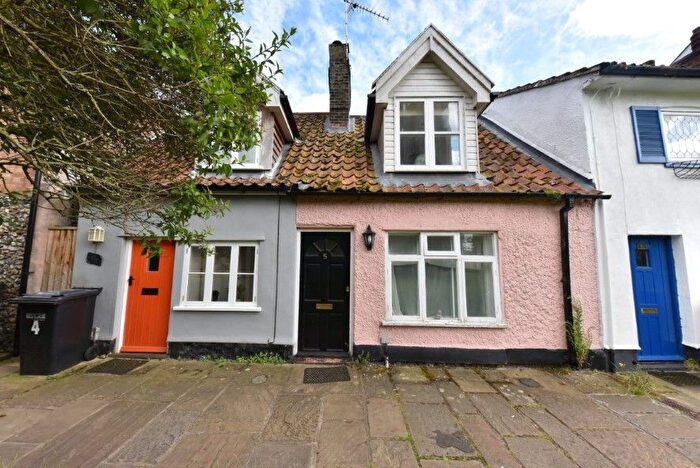
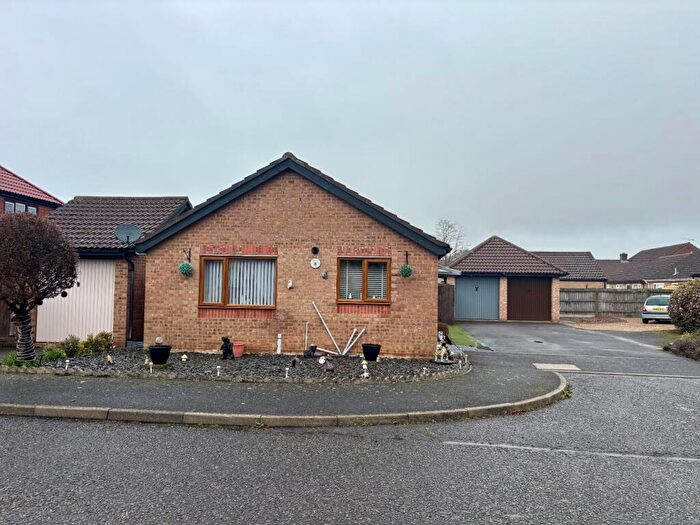
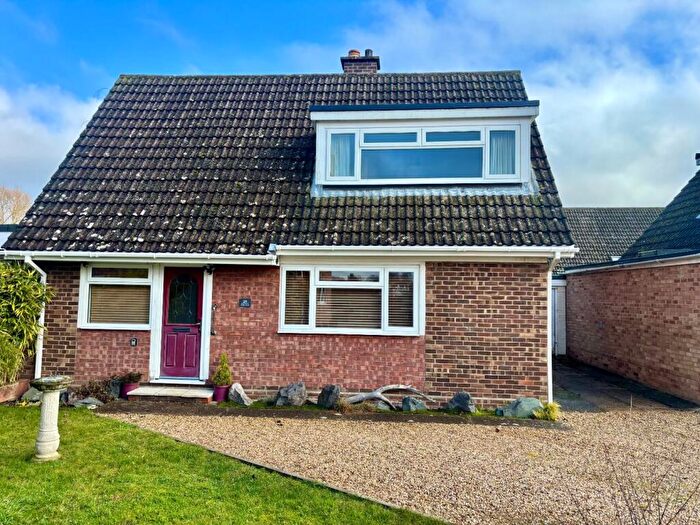
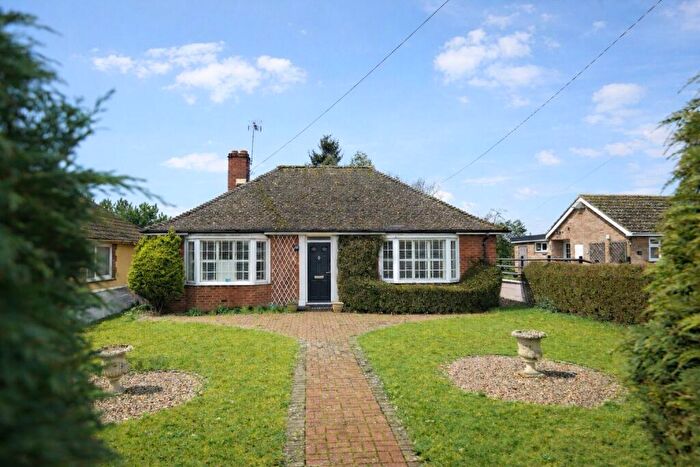
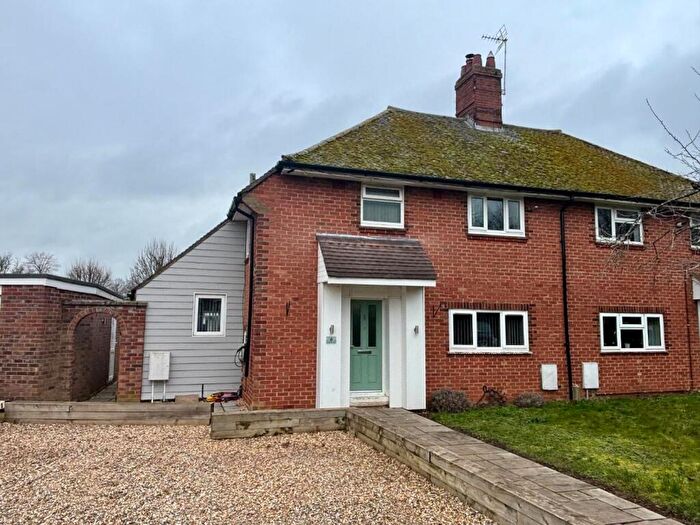
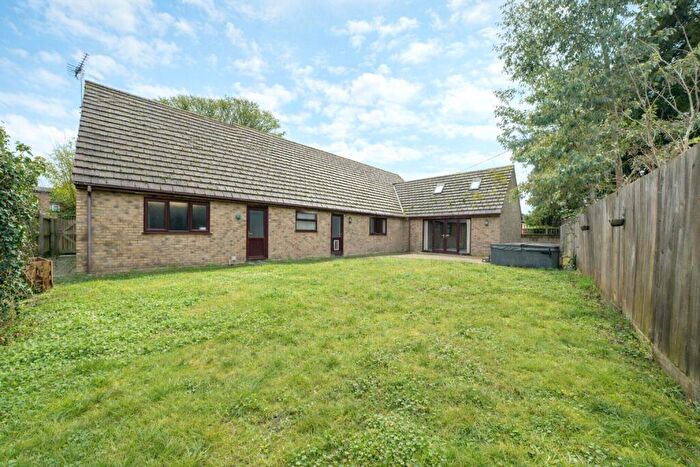
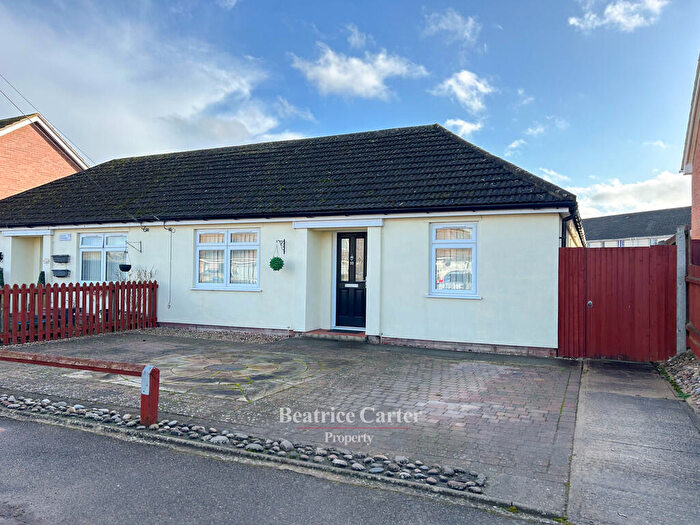
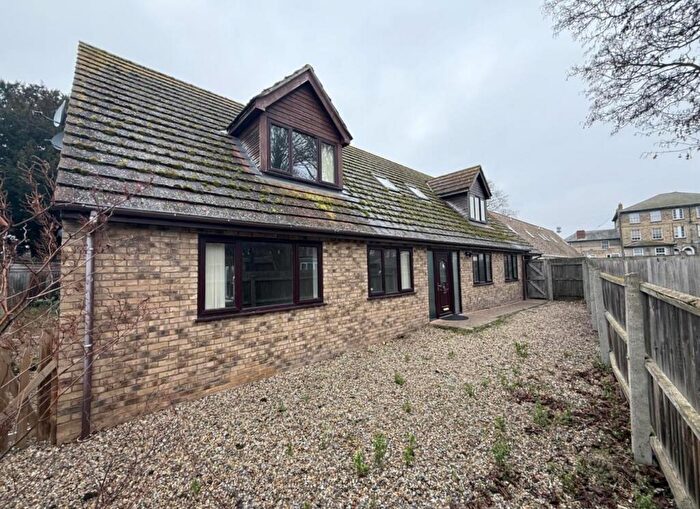
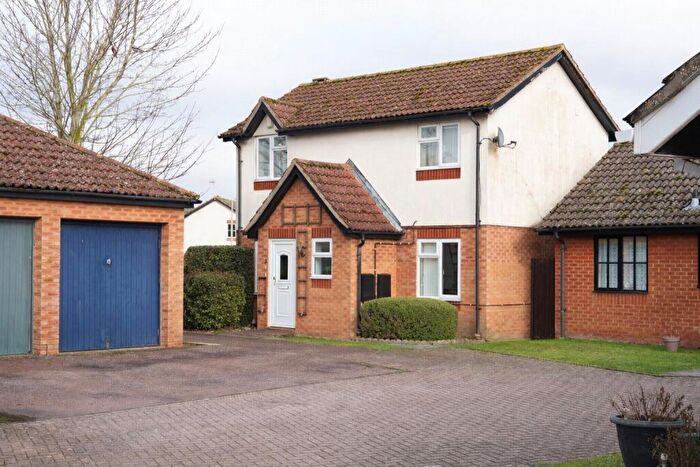
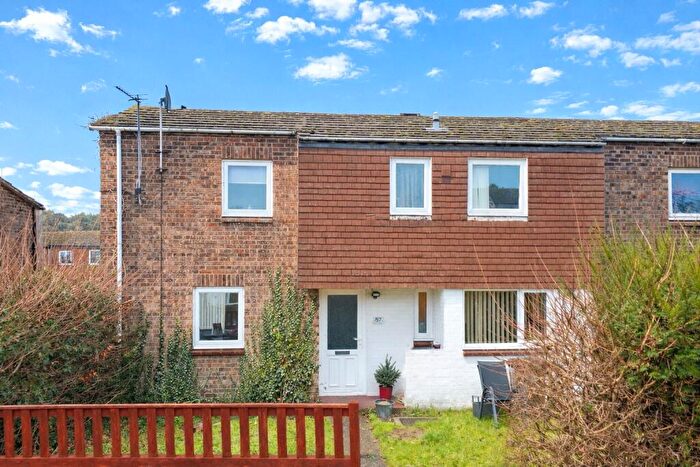
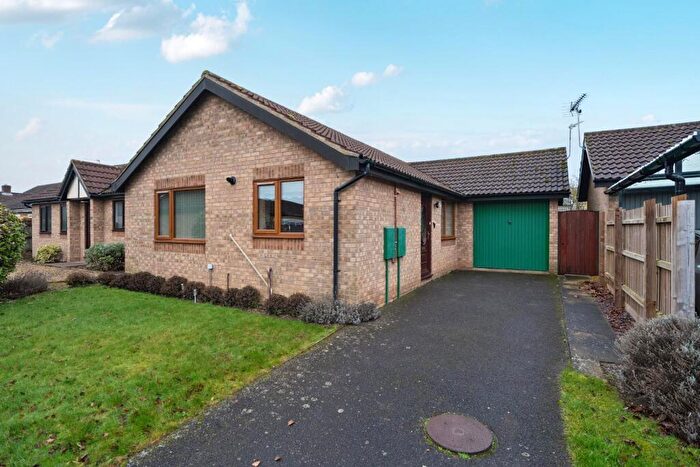
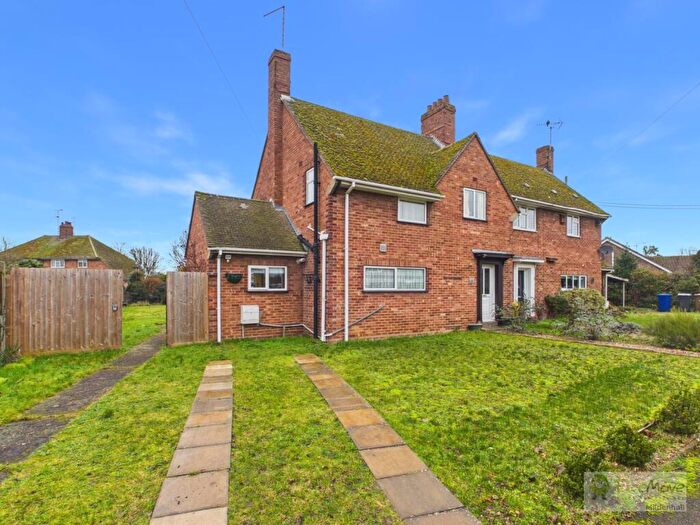
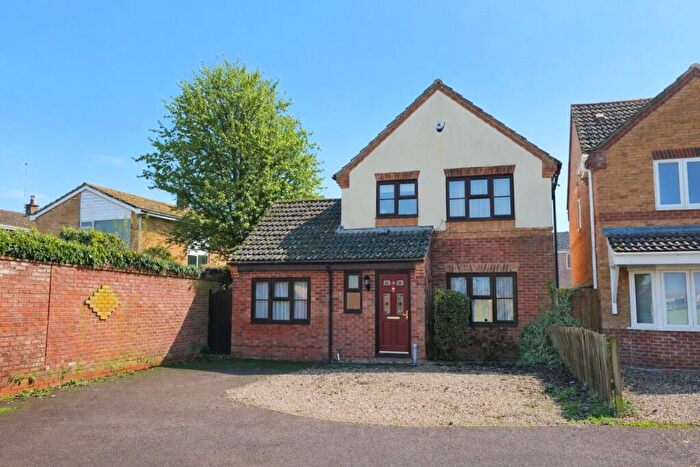
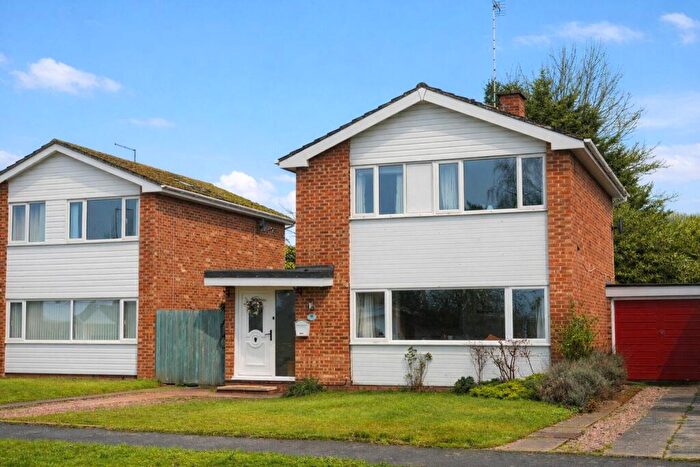
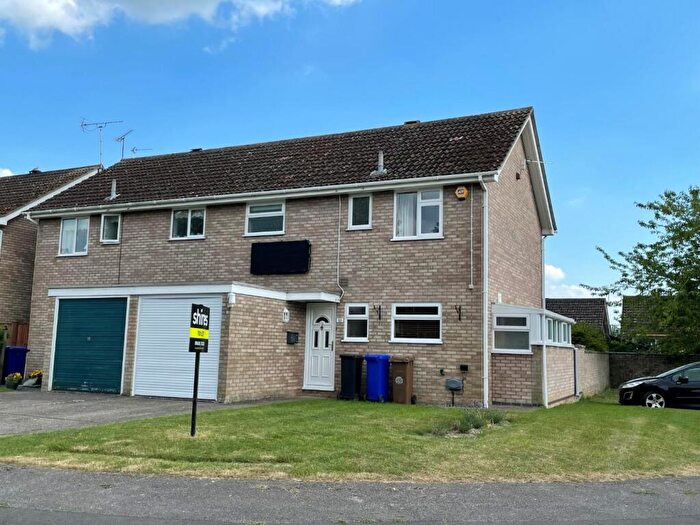
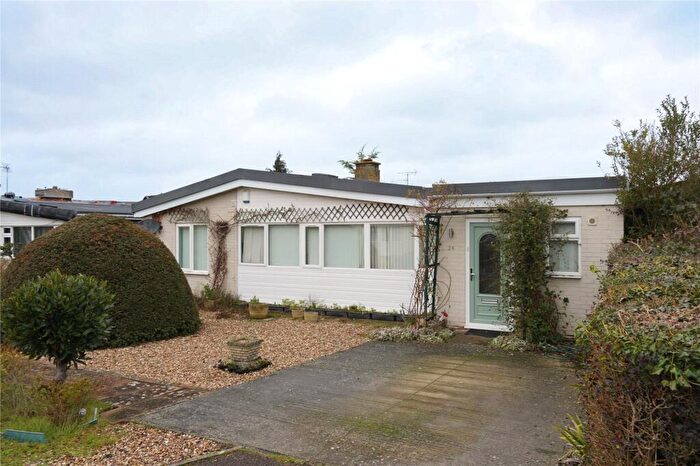
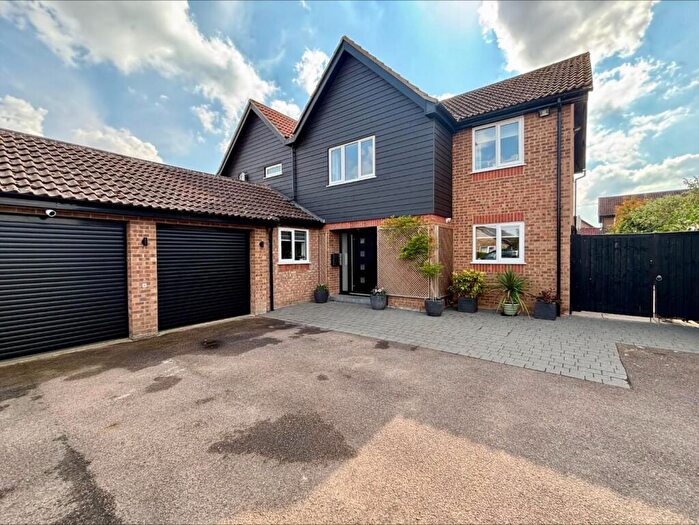
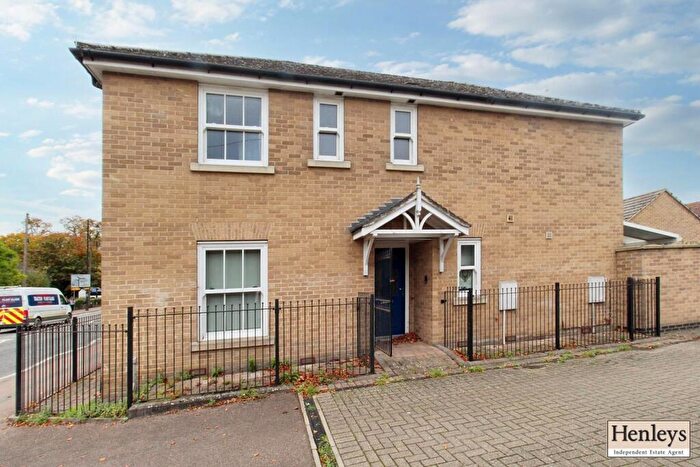
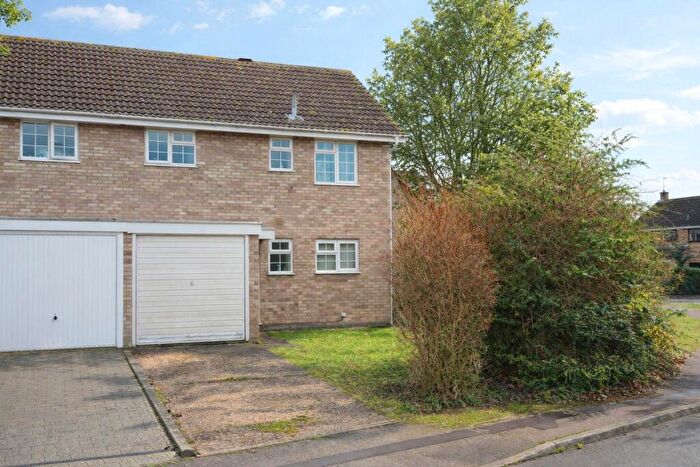
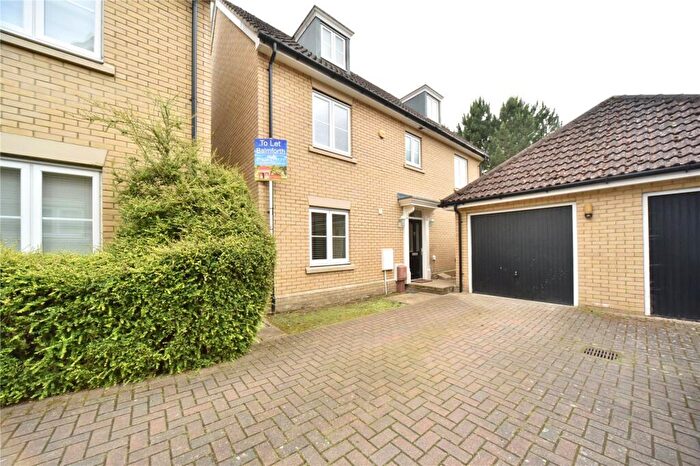
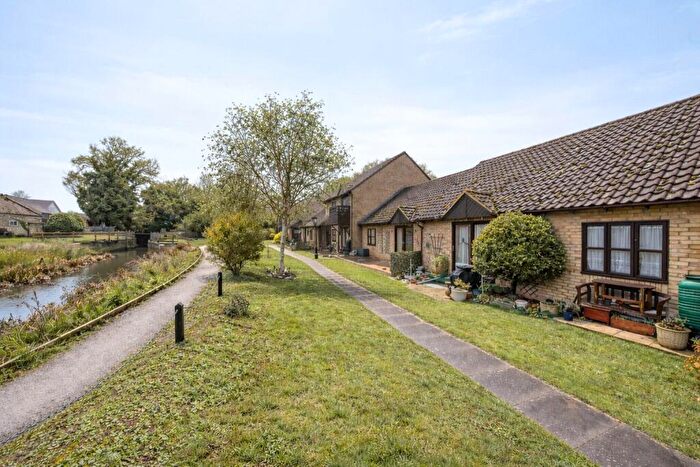
Houses for sale & to rent in Market, Bury St Edmunds
House Prices in Market
Properties in Market have an average house price of £246,180.00 and had 174 Property Transactions within the last 3 years¹.
Market is an area in Bury St Edmunds, Suffolk with 1,813 households², where the most expensive property was sold for £722,000.00.
Properties for sale in Market
Roads and Postcodes in Market
Navigate through our locations to find the location of your next house in Market, Bury St Edmunds for sale or to rent.
| Streets | Postcodes |
|---|---|
| Birkdale Avenue | IP28 7JS |
| Blooms Court | IP28 7GB |
| Brandon Road | IP28 7JD IP28 7JQ IP28 7HZ |
| Brent Close | IP28 7LG |
| Brick Kiln Road | IP28 7HY |
| Bridewell Close | IP28 7RB |
| Chestnut Close | IP28 7NL |
| Church Walk | IP28 7ED |
| Churchyard | IP28 7EE |
| Cobblers Court | IP28 7QG |
| Conifer Close | IP28 7SG |
| Croft Place | IP28 7LN |
| Cypress Close | IP28 7SH |
| Evergreen Way | IP28 7SA |
| Fir Tree Court | IP28 7SL |
| Fleming Avenue | IP28 7NF |
| Forest Way | IP28 7LD |
| Grebe Close | IP28 7LJ |
| Hazel Close | IP28 7HU |
| Heath Road | IP28 7JB |
| Heathland Way | IP28 7SF |
| Hereward Avenue | IP28 7LW |
| High Street | IP28 7EQ IP28 7EA IP28 7EJ |
| Hornbeam Road | IP28 7PJ IP28 7PQ |
| Juniper Close | IP28 7PN |
| King Street | IP28 7EZ IP28 7ES |
| Kingfisher Way | IP28 7HF |
| Kings Close | IP28 7NN |
| Kingsway | IP28 7HN IP28 7HP IP28 7HR IP28 7HS IP28 7HW |
| Laburnum Avenue | IP28 7PL IP28 7PW |
| Lapwing Court | IP28 7RH |
| Lark Road | IP28 7HA IP28 7HL IP28 7LA |
| Lime Close | IP28 7PR |
| Manor Court | IP28 7EH |
| Manor Road | IP28 7EL |
| Market Place | IP28 7EF |
| Martin Close | IP28 7LQ |
| Mill Park Gardens | IP28 7FE |
| Mill Street | IP28 7DP |
| Mulberry Close | IP28 7LL |
| New Street | IP28 7EN |
| Nightingale Close | IP28 7HQ |
| North Place | IP28 7AB |
| North Terrace | IP28 7AA |
| Peterhouse Close | IP28 7NH IP28 7NJ IP28 7NQ |
| Pine Trees Avenue | IP28 7HT |
| Police Station Square | IP28 7ER |
| Pound Meadow Court | IP28 7GY |
| Queens Drive | IP28 7JW |
| Queensway | IP28 7EW IP28 7JJ IP28 7JL IP28 7JY |
| Raven Close | IP28 7LF |
| Robin Close | IP28 7HJ |
| Rowan Walk | IP28 7PP |
| Sanderling Close | IP28 7LE |
| Sharpes Court | IP28 7RN |
| Ship Gardens | IP28 7DL |
| St Andrews Street | IP28 7HB |
| St Annes Drive | IP28 7JP |
| Sunningdale Avenue | IP28 7JR |
| The Shrublands | IP28 7ET |
| The Willows | IP28 7QJ |
| Thetford Road | IP28 7HX |
| Threshers Yard | IP28 7QD |
| Turnstone Close | IP28 7LB |
| Vicarage Gardens | IP28 7RW |
| Wake Avenue | IP28 7NG |
| Wamil Road | IP28 7JZ |
| Wamil Way | IP28 7JU |
| Wentworth Drive | IP28 7JT |
| West Drive | IP28 7JN |
| Wheatsheaf View | IP28 7GD |
| Woodlands Way | IP28 7JA IP28 7JF |
| Wren Close | IP28 7HH |
| Yew Tree Close | IP28 7SJ |
Transport near Market
- FAQ
- Price Paid By Year
- Property Type Price
Frequently asked questions about Market
What is the average price for a property for sale in Market?
The average price for a property for sale in Market is £246,180. This amount is 30% lower than the average price in Bury St Edmunds. There are 375 property listings for sale in Market.
What streets have the most expensive properties for sale in Market?
The streets with the most expensive properties for sale in Market are Manor Road at an average of £515,000, Forest Way at an average of £400,000 and Pine Trees Avenue at an average of £383,333.
What streets have the most affordable properties for sale in Market?
The streets with the most affordable properties for sale in Market are High Street at an average of £111,000, Ship Gardens at an average of £126,630 and Lapwing Court at an average of £145,833.
Which train stations are available in or near Market?
Some of the train stations available in or near Market are Kennett, Lakenheath and Shippea Hill.
Property Price Paid in Market by Year
The average sold property price by year was:
| Year | Average Sold Price | Price Change |
Sold Properties
|
|---|---|---|---|
| 2025 | £253,664 | 5% |
56 Properties |
| 2024 | £240,159 | -2% |
49 Properties |
| 2023 | £244,383 | -7% |
69 Properties |
| 2022 | £261,438 | 7% |
73 Properties |
| 2021 | £243,586 | 8% |
102 Properties |
| 2020 | £223,176 | 9% |
51 Properties |
| 2019 | £203,569 | -9% |
65 Properties |
| 2018 | £222,660 | 11% |
49 Properties |
| 2017 | £199,236 | 11% |
76 Properties |
| 2016 | £176,984 | -11% |
95 Properties |
| 2015 | £196,796 | 14% |
123 Properties |
| 2014 | £168,628 | 6% |
88 Properties |
| 2013 | £158,924 | -7% |
65 Properties |
| 2012 | £169,851 | 4% |
69 Properties |
| 2011 | £163,835 | 5% |
80 Properties |
| 2010 | £155,377 | 7% |
115 Properties |
| 2009 | £144,021 | -27% |
86 Properties |
| 2008 | £182,362 | 13% |
89 Properties |
| 2007 | £159,349 | 2% |
102 Properties |
| 2006 | £156,762 | -1% |
121 Properties |
| 2005 | £159,100 | 8% |
75 Properties |
| 2004 | £146,200 | 8% |
137 Properties |
| 2003 | £133,964 | 11% |
88 Properties |
| 2002 | £119,540 | 26% |
95 Properties |
| 2001 | £88,258 | 4% |
110 Properties |
| 2000 | £85,080 | 18% |
85 Properties |
| 1999 | £69,504 | 1% |
96 Properties |
| 1998 | £68,735 | 12% |
101 Properties |
| 1997 | £60,451 | 5% |
87 Properties |
| 1996 | £57,591 | 3% |
92 Properties |
| 1995 | £55,905 | - |
69 Properties |
Property Price per Property Type in Market
Here you can find historic sold price data in order to help with your property search.
The average Property Paid Price for specific property types in the last three years are:
| Property Type | Average Sold Price | Sold Properties |
|---|---|---|
| Semi Detached House | £245,165.00 | 62 Semi Detached Houses |
| Detached House | £328,847.00 | 51 Detached Houses |
| Terraced House | £216,220.00 | 35 Terraced Houses |
| Flat | £126,780.00 | 26 Flats |

