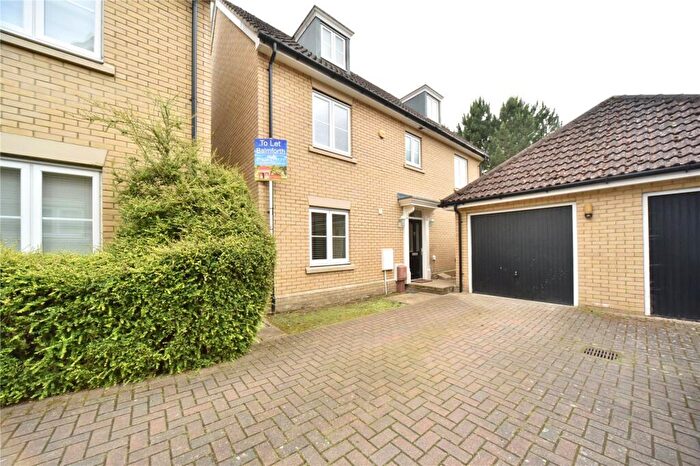
Houses for sale & to rent in Manor, Bury St Edmunds
House Prices in Manor
Properties in Manor have an average house price of £401,261.00 and had 77 Property Transactions within the last 3 years¹.
Manor is an area in Bury St Edmunds, Suffolk with 818 households², where the most expensive property was sold for £1,000,000.00.
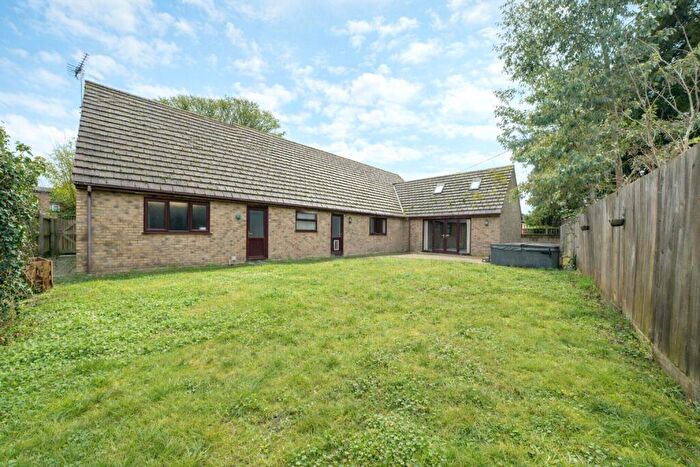
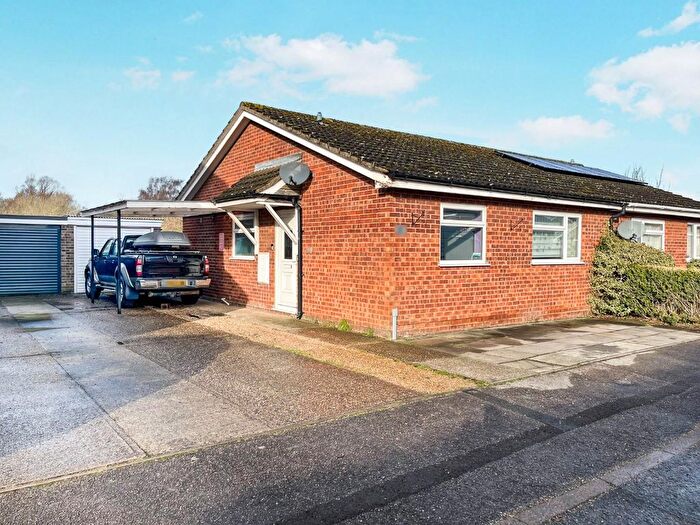
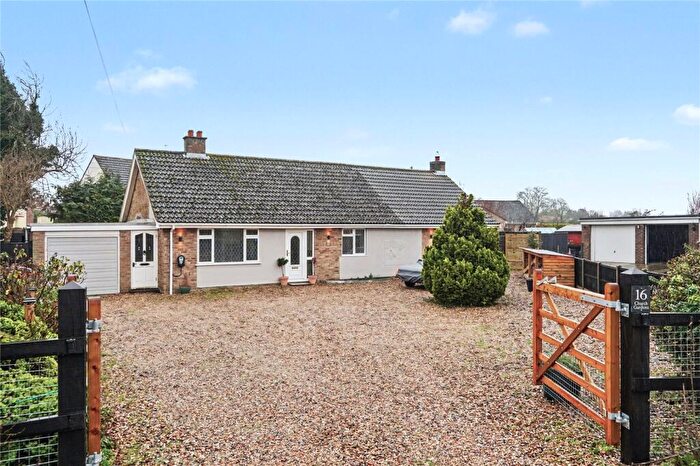
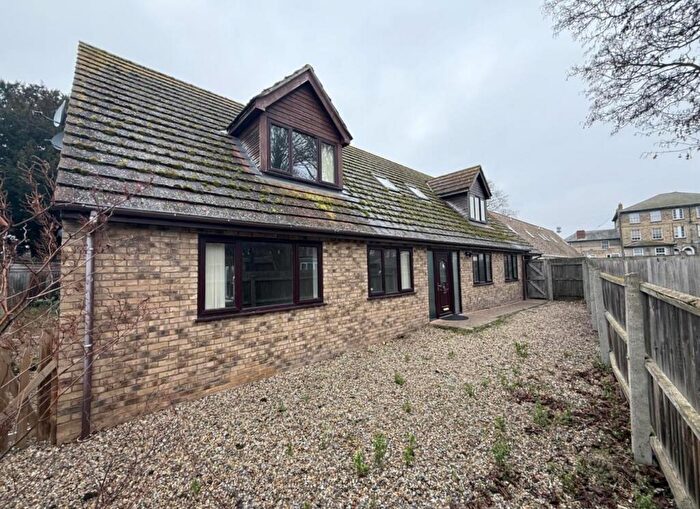
Properties for sale in Manor
Roads and Postcodes in Manor
Navigate through our locations to find the location of your next house in Manor, Bury St Edmunds for sale or to rent.
| Streets | Postcodes |
|---|---|
| All Saints Walk | IP28 8SP |
| Anchor Court | IP28 6SZ |
| Barton Mills | IP28 6BL IP28 6BF IP28 6BG IP28 6BN IP28 6BW |
| Barton Mills Road | IP28 6TH |
| Bay Farm | IP28 6BS |
| Bell Lane | IP28 8SE IP28 6AJ |
| Bridge Farm Close | IP28 7FF |
| Burrell Crescent | IP28 6AY |
| Chase Avenue | IP28 1AD |
| Chestnut Close | IP28 6AF |
| Chippenham Road | IP28 8JA |
| Church Lane | IP28 6AU IP28 6BQ IP28 8SG IP28 8JF |
| Church Lane Close | IP28 6AX |
| Church Meadow | IP28 6AT IP28 6AR |
| Cricket View | IP28 7FA |
| East View | IP28 8HU |
| Elevenways | IP28 8UQ |
| Elms Road | IP28 8JG IP28 8JE IP28 8EW |
| Fiveways | IP28 6AE |
| Fordham Road | IP28 8JB |
| Freckenham Road | IP28 8SQ IP28 8PX IP28 8SN |
| Grange Lane | IP28 6BA IP28 6AZ |
| Hawkers Street | IP28 1AG |
| Herringswell Road | IP28 6BP |
| Higham Road | IP28 6TA |
| Hunters Drive | IP28 1AH |
| Icklingham Road | IP28 6AH IP28 6TB |
| Isleham Road | IP28 8SW IP28 8HR IP28 8HP |
| Lamb Court | IP28 6BB |
| Lark Close | IP28 8SA |
| Lee Brook Close | IP28 8QZ |
| Links Close | IP28 8SR |
| Mace Road | IP28 7FP |
| Manor View | IP28 6BH |
| Mildenhall Road | IP28 6BD IP28 8HX IP28 8RX IP28 8RY IP28 8HT |
| Mortimer Lane | IP28 8JD |
| Newmarket Road | IP28 6AQ IP28 8RZ IP28 6BJ |
| North Street | IP28 8HY |
| Old Dairy Court | IP28 7FG |
| Old Mill Lane | IP28 6AS |
| Olive Court | IP28 6BE |
| Reeve Close | IP28 6SJ |
| Rolfe Close | IP28 8XX |
| Sandy Drove | IP28 6TD |
| Sceptre Drive | IP28 7FN |
| Shores Close | IP28 8NJ |
| St Marys View | IP28 6FE |
| Station Road | IP28 6BT IP28 7DR IP28 7DS |
| Station Yard | IP28 7DT |
| The Green | IP28 8SJ |
| The Meadows | IP28 8SH |
| The Paddocks | IP28 8SB |
| The Street | IP28 6AA IP28 6AP IP28 8RU IP28 6AW IP28 8HZ |
| Tuddenham Road | IP28 6AG |
| Walnut Grove | IP28 8SF |
| Wiggin Close | IP28 6AN |
| Worlington Road | IP28 7DY IP28 7DX IP28 7FL |
| IP28 8SD IP28 6DD IP28 6DE IP28 6NU IP28 8NF |
Transport near Manor
- FAQ
- Price Paid By Year
- Property Type Price
Frequently asked questions about Manor
What is the average price for a property for sale in Manor?
The average price for a property for sale in Manor is £401,261. This amount is 14% higher than the average price in Bury St Edmunds. There are 1,652 property listings for sale in Manor.
What streets have the most expensive properties for sale in Manor?
The streets with the most expensive properties for sale in Manor are Mildenhall Road at an average of £695,800, Worlington Road at an average of £693,333 and Freckenham Road at an average of £542,500.
What streets have the most affordable properties for sale in Manor?
The streets with the most affordable properties for sale in Manor are Church Lane at an average of £127,000, Tuddenham Road at an average of £163,500 and North Street at an average of £215,000.
Which train stations are available in or near Manor?
Some of the train stations available in or near Manor are Kennett, Newmarket and Shippea Hill.
Property Price Paid in Manor by Year
The average sold property price by year was:
| Year | Average Sold Price | Price Change |
Sold Properties
|
|---|---|---|---|
| 2025 | £385,487 | -8% |
29 Properties |
| 2024 | £416,500 | 3% |
24 Properties |
| 2023 | £405,083 | -15% |
24 Properties |
| 2022 | £464,466 | 3% |
45 Properties |
| 2021 | £452,670 | 33% |
48 Properties |
| 2020 | £304,262 | -8% |
62 Properties |
| 2019 | £328,624 | 3% |
79 Properties |
| 2018 | £318,881 | 1% |
38 Properties |
| 2017 | £314,105 | -9% |
19 Properties |
| 2016 | £342,702 | 13% |
52 Properties |
| 2015 | £298,773 | -13% |
37 Properties |
| 2014 | £338,117 | 6% |
34 Properties |
| 2013 | £317,499 | 14% |
25 Properties |
| 2012 | £273,664 | 13% |
21 Properties |
| 2011 | £238,264 | -5% |
32 Properties |
| 2010 | £250,553 | 26% |
55 Properties |
| 2009 | £185,516 | -82% |
29 Properties |
| 2008 | £337,972 | 15% |
20 Properties |
| 2007 | £286,484 | -2% |
23 Properties |
| 2006 | £292,353 | 1% |
32 Properties |
| 2005 | £289,419 | 21% |
31 Properties |
| 2004 | £228,789 | 9% |
24 Properties |
| 2003 | £207,935 | -2% |
32 Properties |
| 2002 | £211,335 | 11% |
40 Properties |
| 2001 | £187,724 | 23% |
40 Properties |
| 2000 | £145,008 | 4% |
28 Properties |
| 1999 | £138,679 | 30% |
44 Properties |
| 1998 | £97,101 | -19% |
30 Properties |
| 1997 | £115,594 | 11% |
34 Properties |
| 1996 | £102,391 | 25% |
24 Properties |
| 1995 | £76,342 | - |
27 Properties |
Property Price per Property Type in Manor
Here you can find historic sold price data in order to help with your property search.
The average Property Paid Price for specific property types in the last three years are:
| Property Type | Average Sold Price | Sold Properties |
|---|---|---|
| Semi Detached House | £298,479.00 | 24 Semi Detached Houses |
| Detached House | £510,525.00 | 40 Detached Houses |
| Terraced House | £212,056.00 | 11 Terraced Houses |
| Flat | £490,000.00 | 2 Flats |

