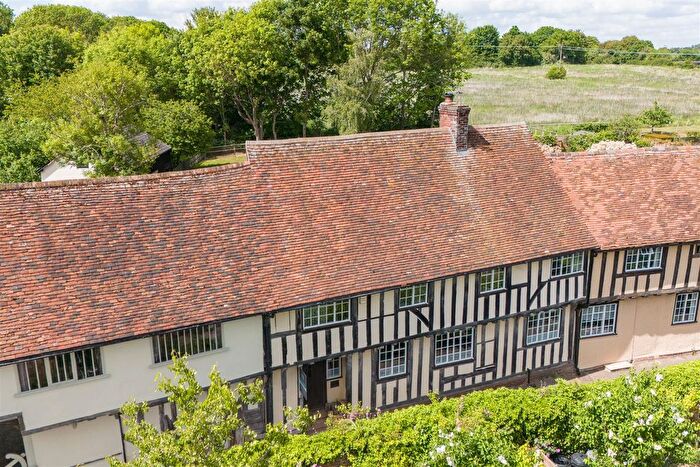
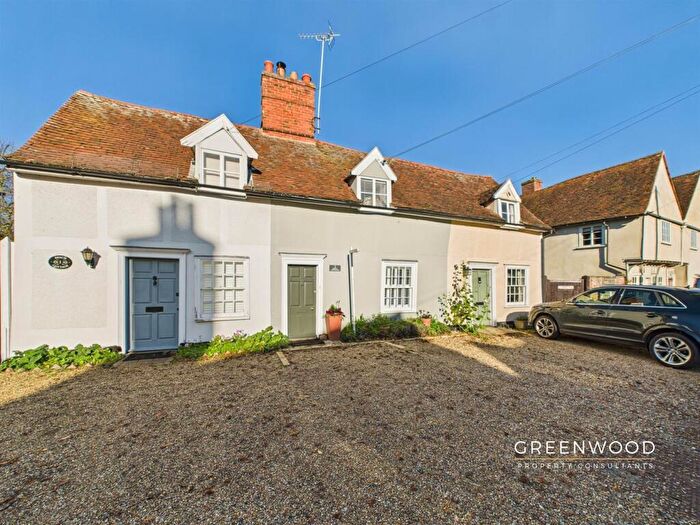
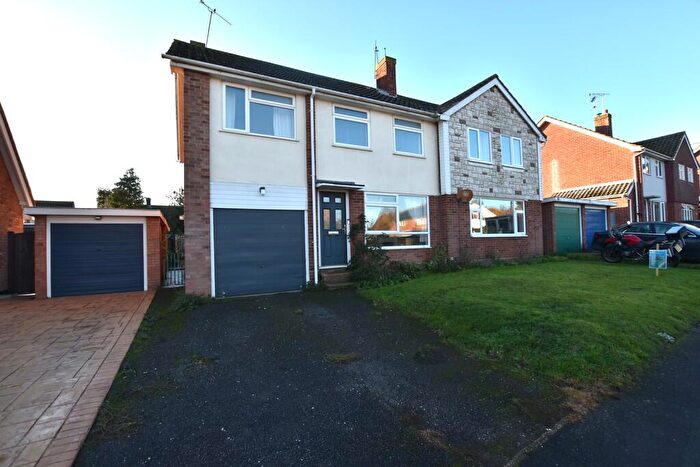
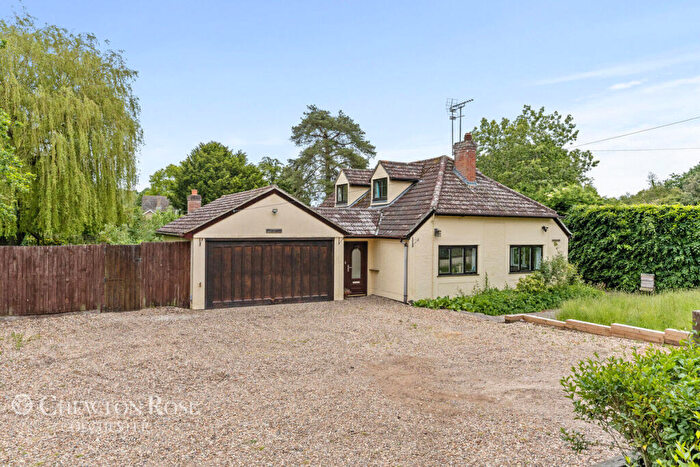
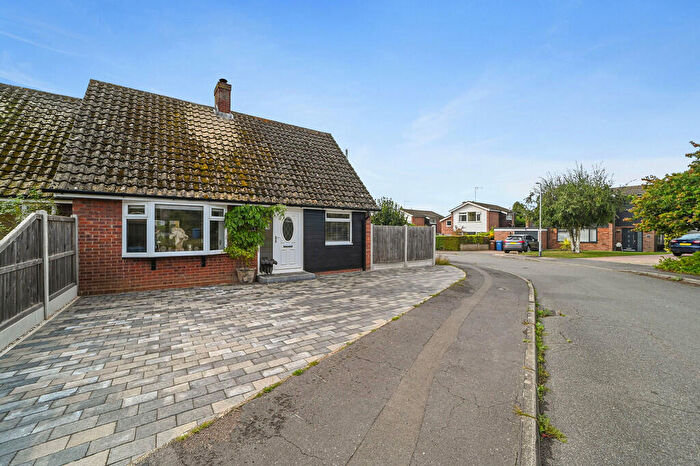
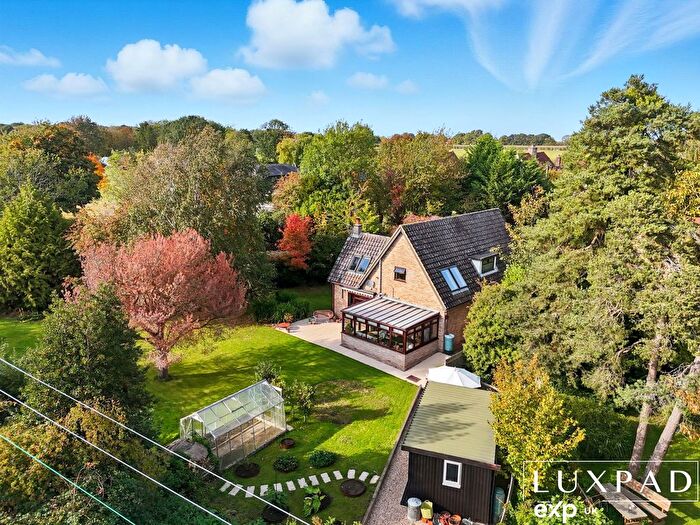
Houses for sale & to rent in Bures St Mary & Nayland, Colchester
House Prices in Bures St Mary & Nayland
Properties in Bures St Mary & Nayland have no sales history available within the last 3 years.
Bures St Mary & Nayland is an area in Colchester, Suffolk with 104 households².
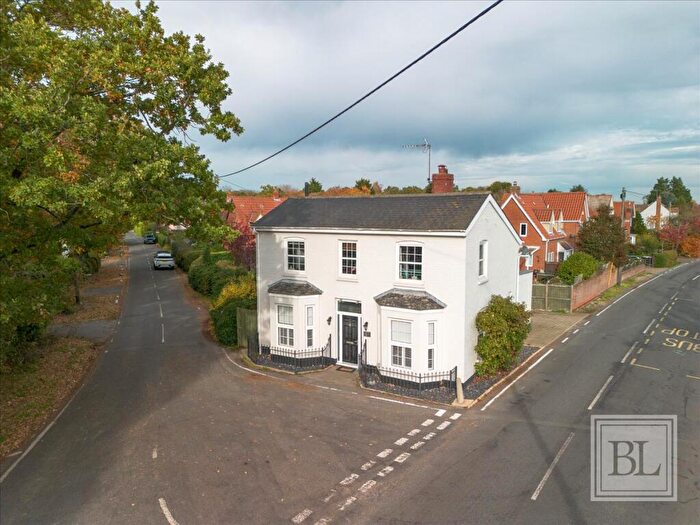
Properties for sale in Bures St Mary & Nayland
Roads and Postcodes in Bures St Mary & Nayland
Navigate through our locations to find the location of your next house in Bures St Mary & Nayland, Colchester for sale or to rent.
| Streets | Postcodes |
|---|---|
| Beachams Lane | CO6 4FA |
| Bear Street | CO6 4HZ |
| Calves Lane | CO6 4RR |
| Cawley Road | CO6 4NH |
| Church Street | CO6 4QL CO6 4QN CO6 4QR CO6 4QW |
| Giffords Hall Park | CO6 4SZ |
| Grove Close | CO6 4QQ |
| High Street | CO6 4JG |
| Higham Marsh | CO6 4SX CO6 4SY |
| Keepers Lane | CO6 4PZ |
| Nayland | CO6 4LX CO6 4NF CO6 4UY CO6 4YW CO6 4YX |
| Nayland Road | CO6 4QS |
| Orcs Barn Cottages | CO6 4SW |
| Paddock Grove | CO6 4FU |
| Park Road | CO6 4FF CO6 4SH |
| Parkers Way | CO6 4HS |
| Poplars Farm Lane | CO6 4RT |
| School Street | CO6 4QZ |
| Scotland Street | CO6 4QD |
| Stoke By Nayland | CO6 4RL CO6 4WJ |
| Stoke Tye | CO6 4RP |
| Sudbury Road | CO6 4RN CO6 4RW |
| Tendring Hall Park | CO6 4SG |
| The Downs | CO6 4TQ |
| Thorington Street | CO6 4SS |
| Walsh Rise | CO6 4GY |
| Wick Road | CO6 4SL |
| Wiston Road | CO6 4FR CO6 4LS |
| Withermarsh Green | CO6 4TA CO6 4TD |
| CO6 4AY CO6 4GB CO6 4UB CO6 4XE CO6 4XG CO6 4YR |
Transport near Bures St Mary & Nayland
-
Bures Station
-
Colchester Station
-
Colchester Town Station
-
Manningtree Station
-
Chappel and Wakes Colne Station
-
Hythe Station
-
Sudbury Station
-
Mistley Station
-
Marks Tey Station
-
Wivenhoe Station
- FAQ
- Price Paid By Year
Frequently asked questions about Bures St Mary & Nayland
Which train stations are available in or near Bures St Mary & Nayland?
Some of the train stations available in or near Bures St Mary & Nayland are Bures, Colchester and Colchester Town.
Property Price Paid in Bures St Mary & Nayland by Year
The average sold property price by year was:
| Year | Average Sold Price | Price Change |
Sold Properties
|
|---|---|---|---|
| 2020 | £315,000 | -368% |
1 Property |
| 2017 | £1,475,000 | 70% |
1 Property |
| 1999 | £440,000 | 80% |
1 Property |
| 1995 | £88,350 | - |
1 Property |

