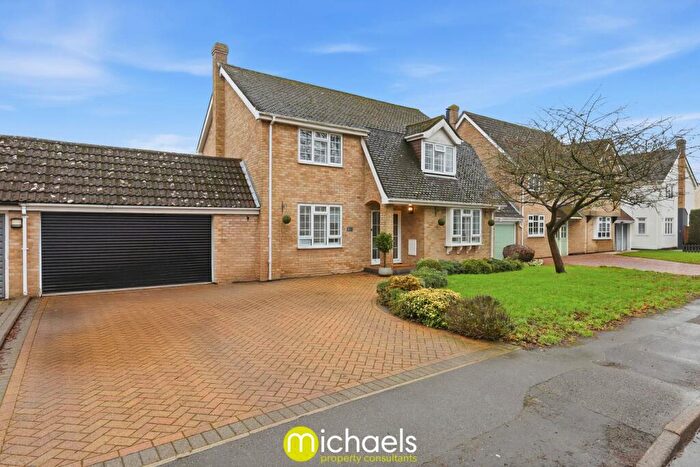
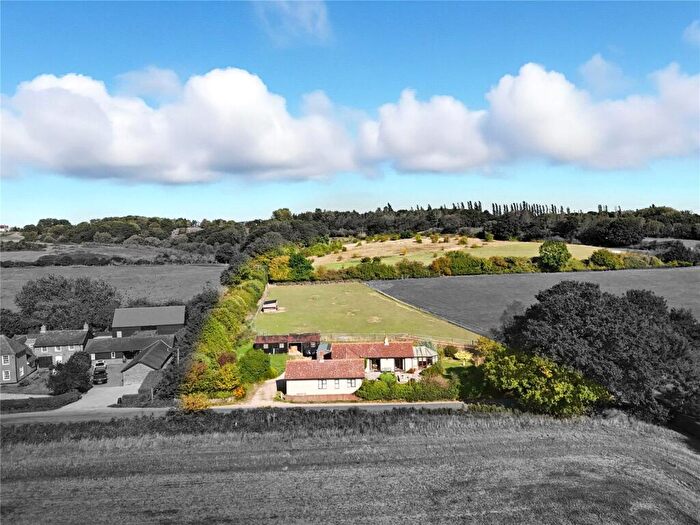
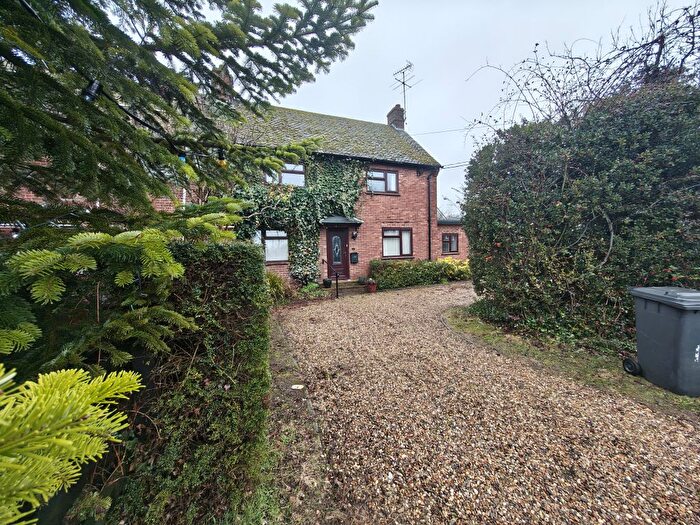
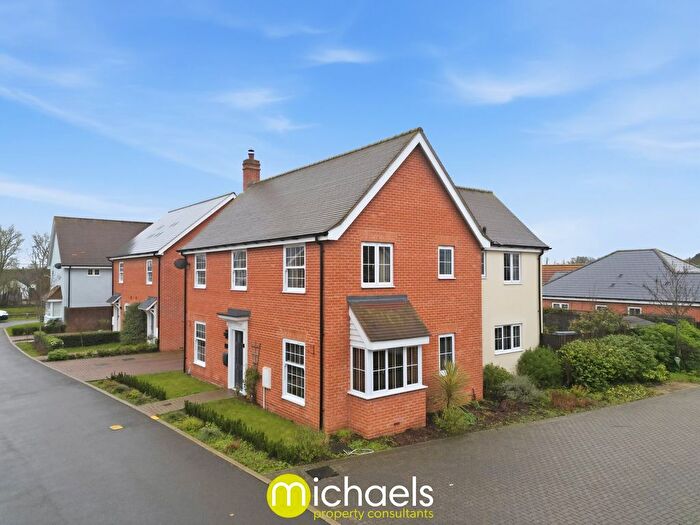
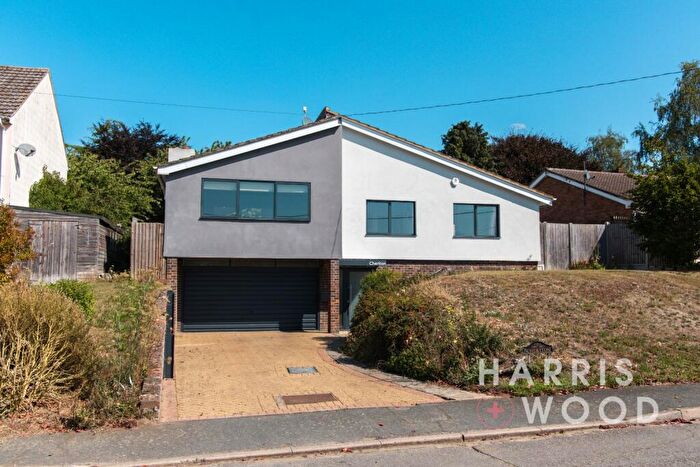
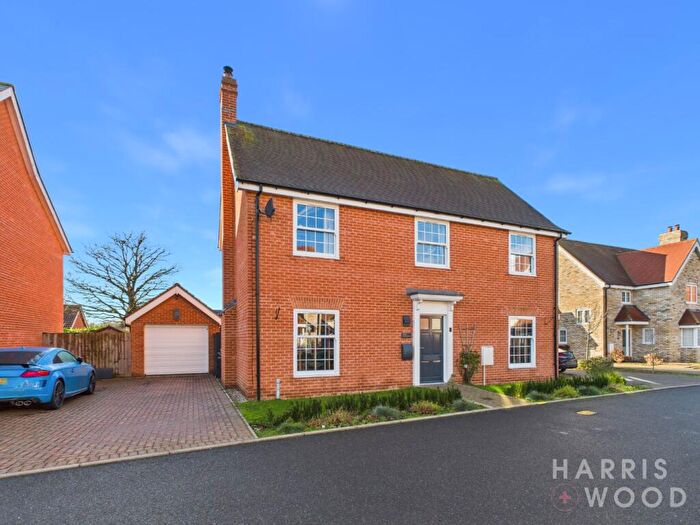
Houses for sale & to rent in Nayland, Colchester
House Prices in Nayland
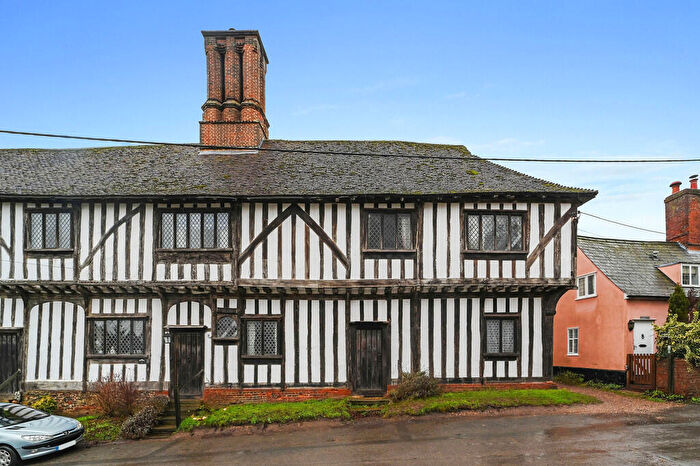
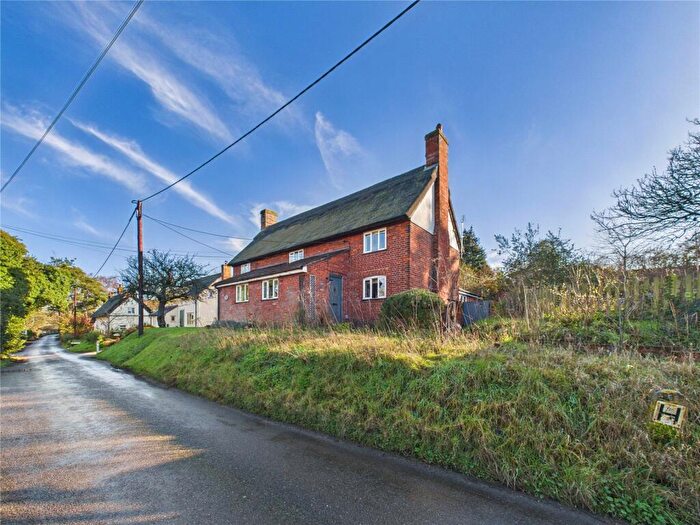
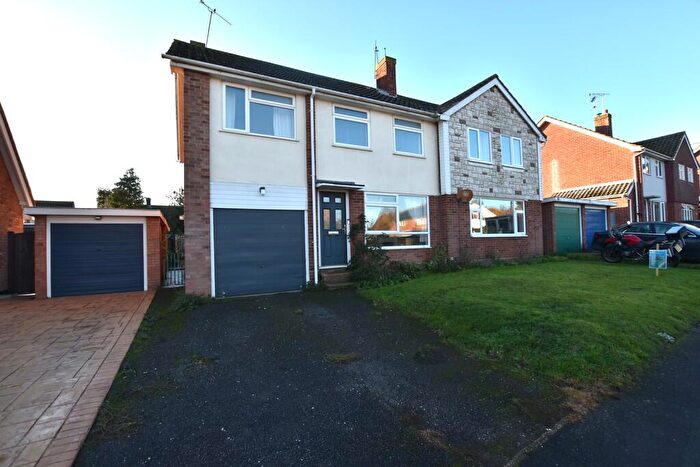
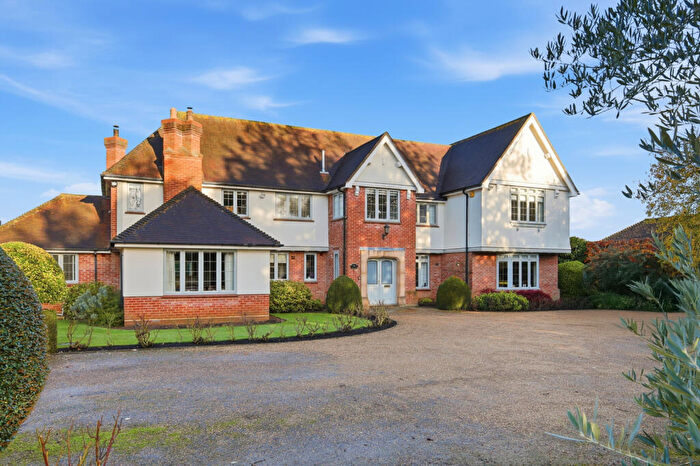
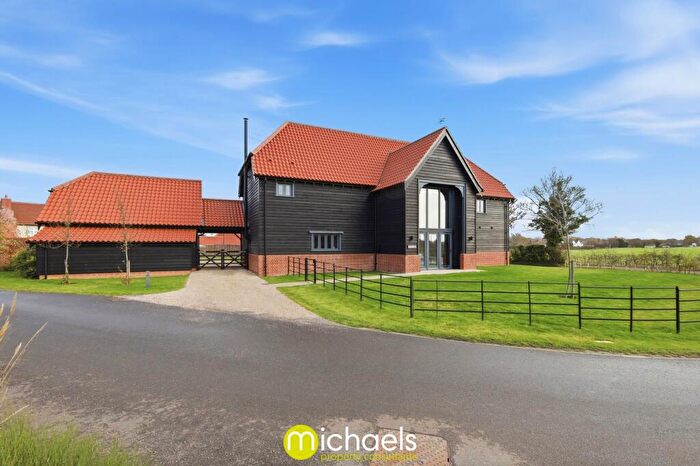
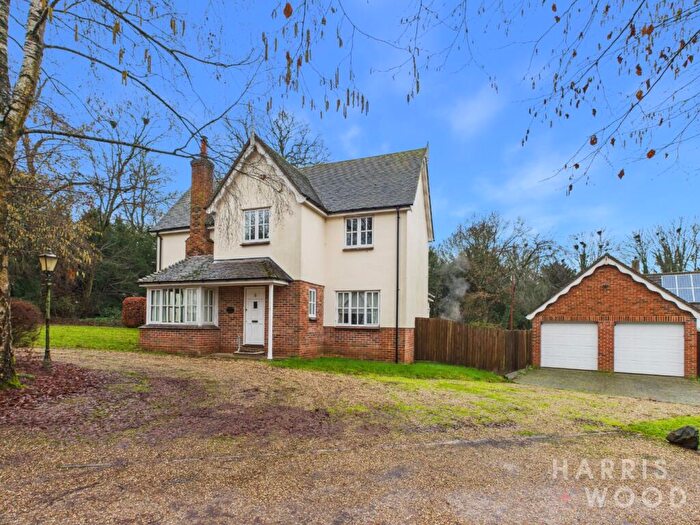
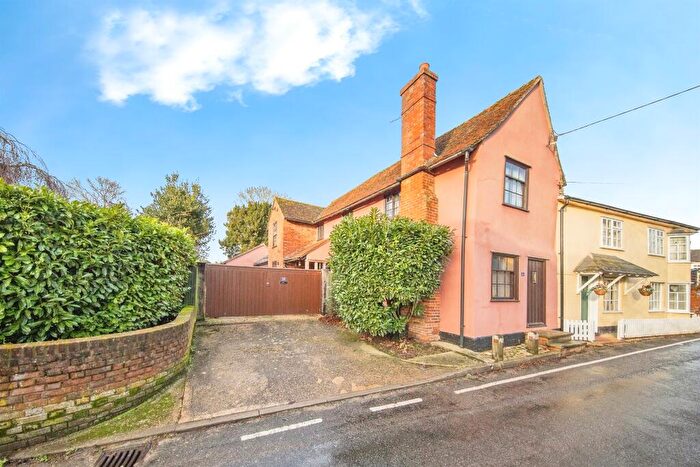
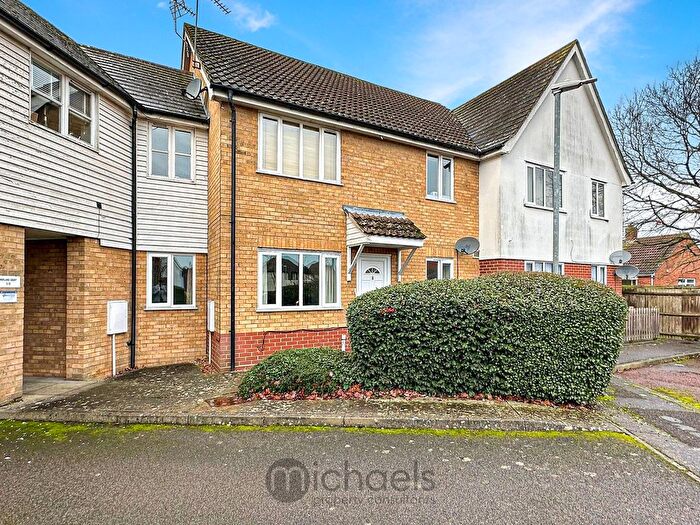
Properties in Nayland have an average house price of £508,014.00 and had 67 Property Transactions within the last 3 years¹.
Nayland is an area in Colchester, Suffolk with 711 households², where the most expensive property was sold for £1,880,000.00.
Properties for sale in Nayland
Roads and Postcodes in Nayland
Navigate through our locations to find the location of your next house in Nayland, Colchester for sale or to rent.
| Streets | Postcodes |
|---|---|
| Ash Rise | CO6 4LP |
| Bear Street | CO6 4HX CO6 4HY CO6 4LA CO6 4LR |
| Birch Fall | CO6 4LD |
| Birch Street | CO6 4JA |
| Blundens Corner | CO6 4RA |
| Bures Road | CO6 4LZ CO6 4NA CO6 4NB CO6 4ND |
| Butt Road | CO6 4RB CO6 4RD |
| Campion Lane | CO6 4NJ |
| Campions Hill | CO6 4NL |
| Cawley Road | CO6 4NE CO6 4NQ |
| Church Lane | CO6 4JH |
| Church Street | CO6 4QH CO6 4QJ CO6 4QP |
| Court Street | CO6 4JL |
| Crossfields | CO6 4RG |
| Dead Lane | CO6 4LY |
| Elm Grove | CO6 4LL |
| Fen Street | CO6 4HT |
| Goldenlonds | CO6 4RE |
| Gravel Hill | CO6 4JB |
| Harpers Estate | CO6 4LB |
| Harpers Hill | CO6 4NT CO6 4NU |
| Heycroft Way | CO6 4LF CO6 4LN |
| High Street | CO6 4JE CO6 4JF |
| Higham Marsh | CO6 4SU |
| Horkesley Road | CO6 4JN |
| Jane Walker Park | CO6 4JW |
| Keepers Lane | CO6 4PX |
| Laburnum Way | CO6 4LG |
| Larch Grove | CO6 4LE |
| Mill Street | CO6 4HU |
| Newlands Lane | CO6 4JJ |
| Park Street | CO6 4SE |
| Polstead Street | CO6 4SA CO6 4SD |
| School Street | CO6 4QT CO6 4QU CO6 4QX CO6 4QY |
| Scotland Street | CO6 4QE CO6 4QF CO6 4QG |
| Stoke Road | CO6 4JD |
| Sudbury Road | CO6 4RJ CO6 4RS |
| The Blundens | CO6 4RH |
| The Westerings | CO6 4LJ |
| Thorington Street | CO6 4SP CO6 4SR CO6 4ST |
| Thorrington Street | CO6 4SN |
| Willow Grove | CO6 4LH |
| Wissington Road | CO6 4LU |
| Wissington Uplands | CO6 4JQ |
| Wiston Road | CO6 4LT |
| Withermarsh Green | CO6 4TB |
Transport near Nayland
-
Bures Station
-
Colchester Station
-
Chappel and Wakes Colne Station
-
Colchester Town Station
-
Hythe Station
-
Sudbury Station
-
Manningtree Station
-
Marks Tey Station
-
Mistley Station
-
Wivenhoe Station
- FAQ
- Price Paid By Year
- Property Type Price
Frequently asked questions about Nayland
What is the average price for a property for sale in Nayland?
The average price for a property for sale in Nayland is £508,014. This amount is 5% higher than the average price in Colchester. There are 653 property listings for sale in Nayland.
What streets have the most expensive properties for sale in Nayland?
The streets with the most expensive properties for sale in Nayland are Cawley Road at an average of £1,880,000, Campions Hill at an average of £1,835,000 and Church Lane at an average of £817,499.
What streets have the most affordable properties for sale in Nayland?
The streets with the most affordable properties for sale in Nayland are Larch Grove at an average of £245,000, Crossfields at an average of £275,833 and Harpers Estate at an average of £280,000.
Which train stations are available in or near Nayland?
Some of the train stations available in or near Nayland are Bures, Colchester and Chappel and Wakes Colne.
Property Price Paid in Nayland by Year
The average sold property price by year was:
| Year | Average Sold Price | Price Change |
Sold Properties
|
|---|---|---|---|
| 2025 | £537,547 | 5% |
21 Properties |
| 2024 | £512,541 | 7% |
24 Properties |
| 2023 | £474,886 | -6% |
22 Properties |
| 2022 | £505,390 | 3% |
24 Properties |
| 2021 | £488,627 | -9% |
43 Properties |
| 2020 | £530,769 | -3% |
26 Properties |
| 2019 | £547,273 | 27% |
21 Properties |
| 2018 | £398,905 | -49% |
28 Properties |
| 2017 | £593,035 | 20% |
14 Properties |
| 2016 | £477,370 | 11% |
27 Properties |
| 2015 | £424,706 | 28% |
29 Properties |
| 2014 | £306,978 | -26% |
25 Properties |
| 2013 | £386,513 | -38% |
28 Properties |
| 2012 | £533,944 | 27% |
27 Properties |
| 2011 | £387,703 | 5% |
22 Properties |
| 2010 | £369,211 | 17% |
26 Properties |
| 2009 | £308,000 | -36% |
17 Properties |
| 2008 | £417,740 | 8% |
20 Properties |
| 2007 | £383,654 | 23% |
47 Properties |
| 2006 | £295,031 | 4% |
40 Properties |
| 2005 | £284,350 | -6% |
20 Properties |
| 2004 | £301,301 | 11% |
31 Properties |
| 2003 | £267,981 | -1% |
42 Properties |
| 2002 | £270,747 | 25% |
34 Properties |
| 2001 | £203,036 | 21% |
38 Properties |
| 2000 | £159,983 | -5% |
33 Properties |
| 1999 | £167,636 | -3% |
38 Properties |
| 1998 | £173,263 | 13% |
26 Properties |
| 1997 | £150,999 | 7% |
37 Properties |
| 1996 | £139,741 | 31% |
28 Properties |
| 1995 | £96,750 | - |
30 Properties |
Property Price per Property Type in Nayland
Here you can find historic sold price data in order to help with your property search.
The average Property Paid Price for specific property types in the last three years are:
| Property Type | Average Sold Price | Sold Properties |
|---|---|---|
| Semi Detached House | £347,950.00 | 20 Semi Detached Houses |
| Detached House | £697,344.00 | 29 Detached Houses |
| Terraced House | £380,833.00 | 18 Terraced Houses |

