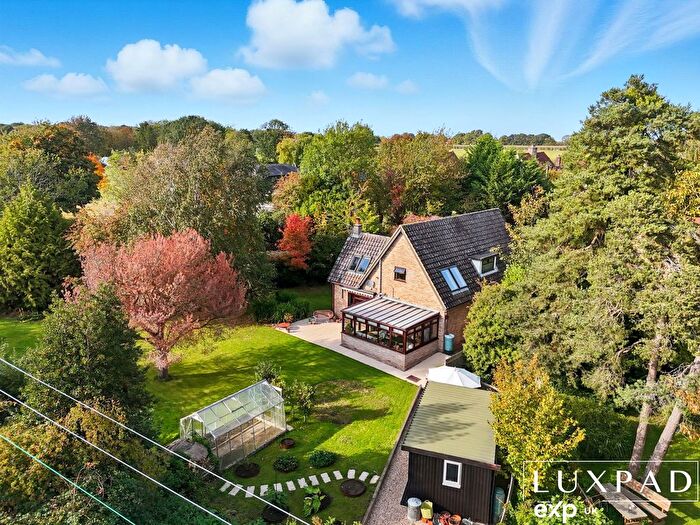
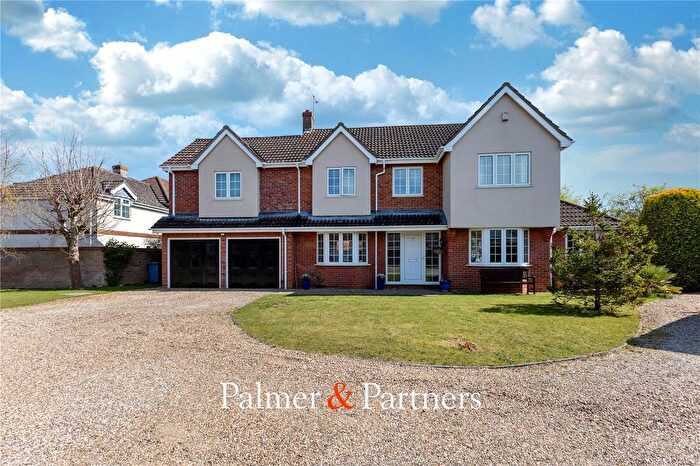
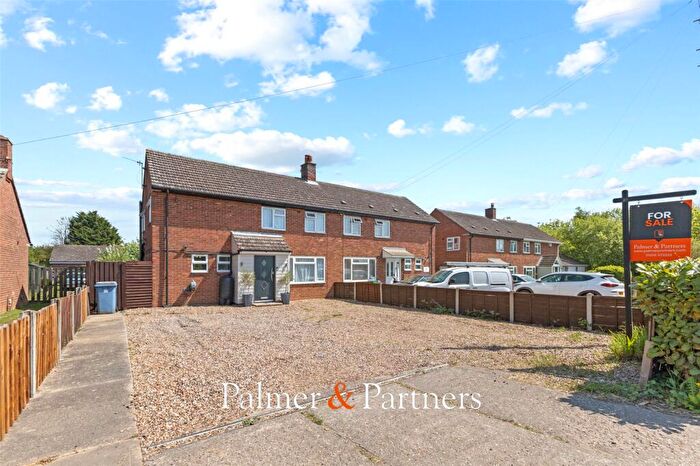
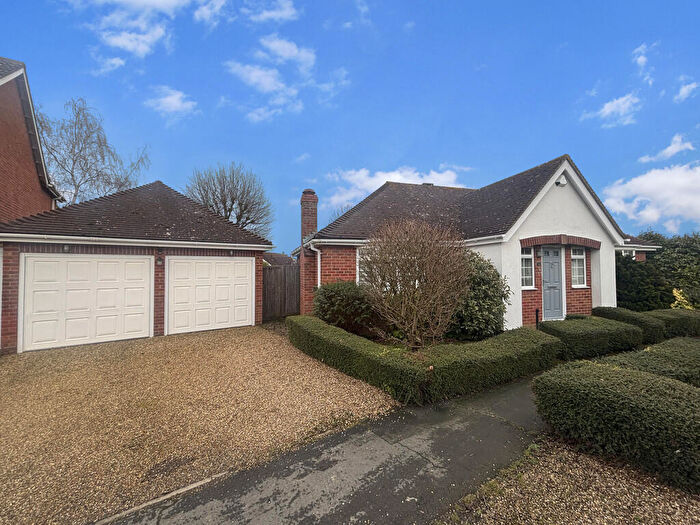
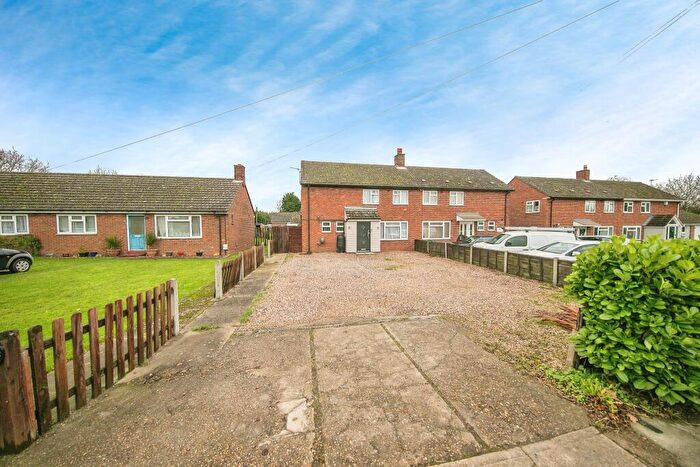
Houses for sale & to rent in Leavenheath, Colchester
House Prices in Leavenheath
Properties in Leavenheath have an average house price of £400,610.00 and had 63 Property Transactions within the last 3 years¹.
Leavenheath is an area in Colchester, Suffolk with 600 households², where the most expensive property was sold for £1,075,000.00.
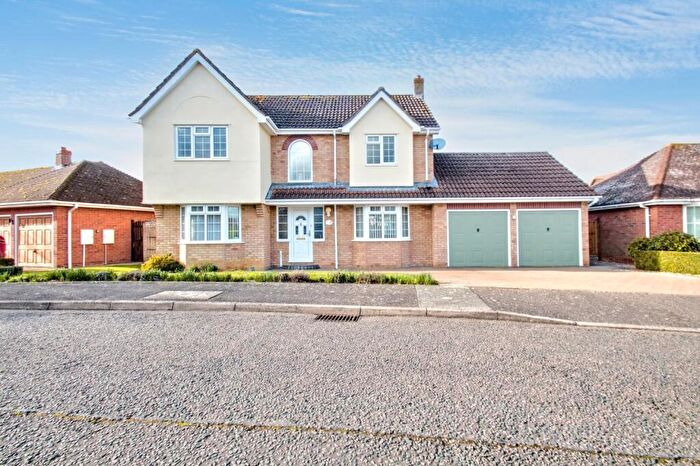
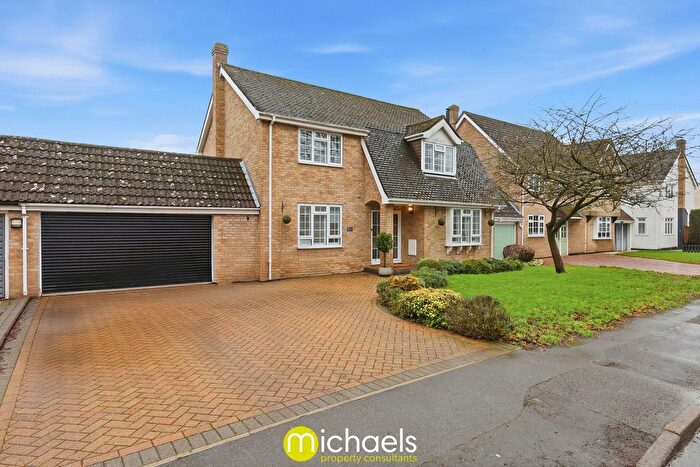
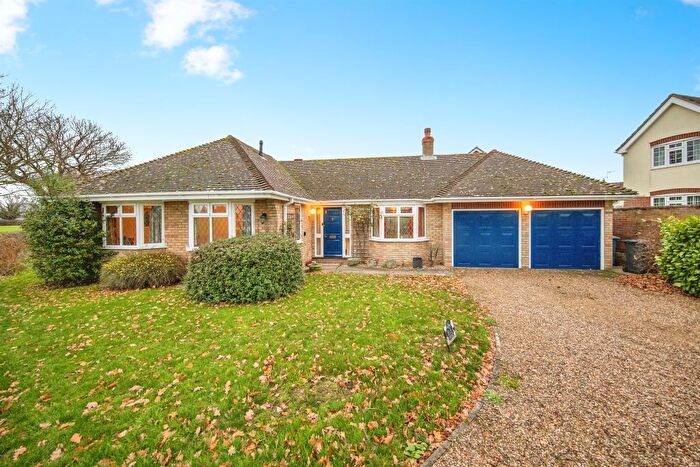
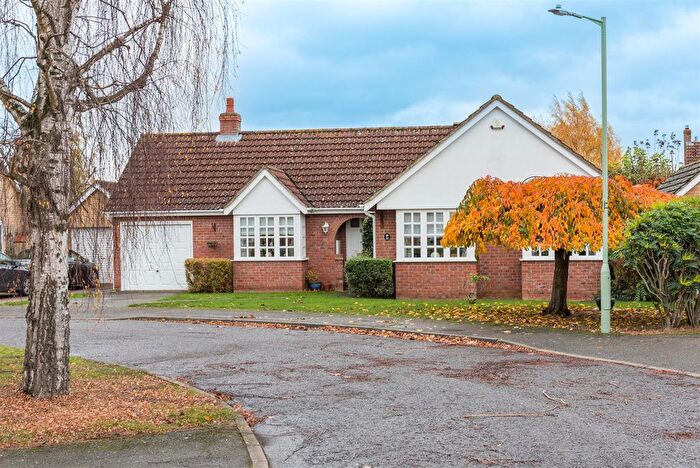
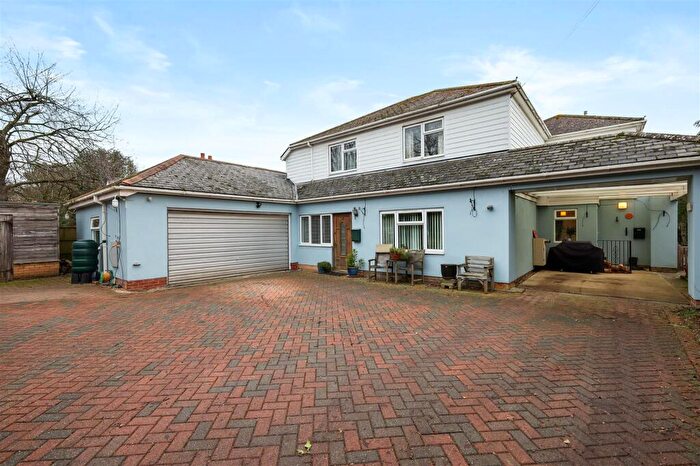
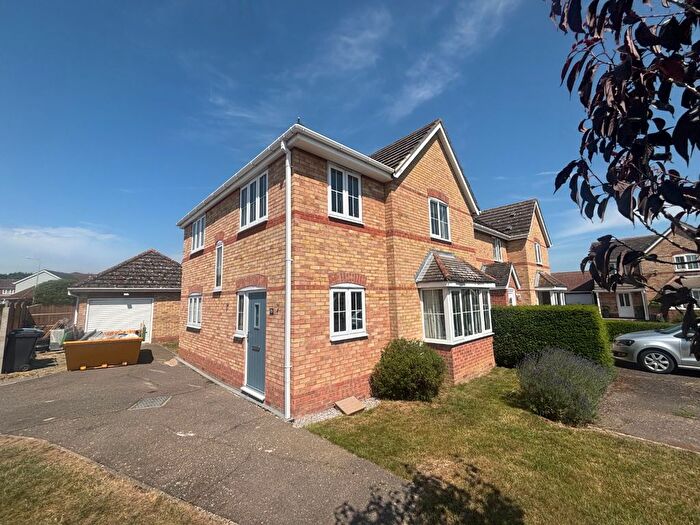
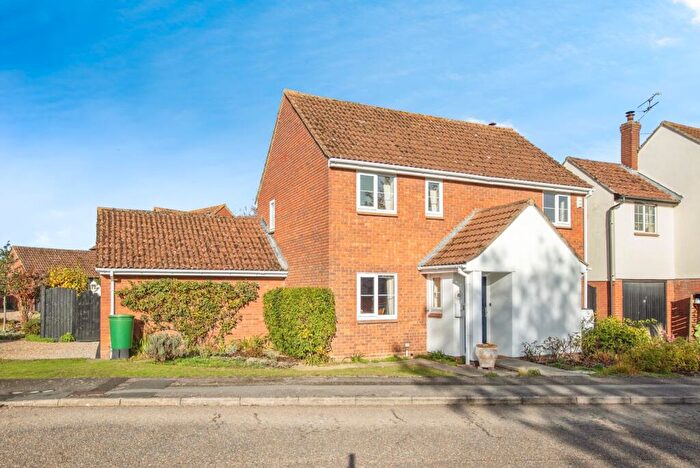
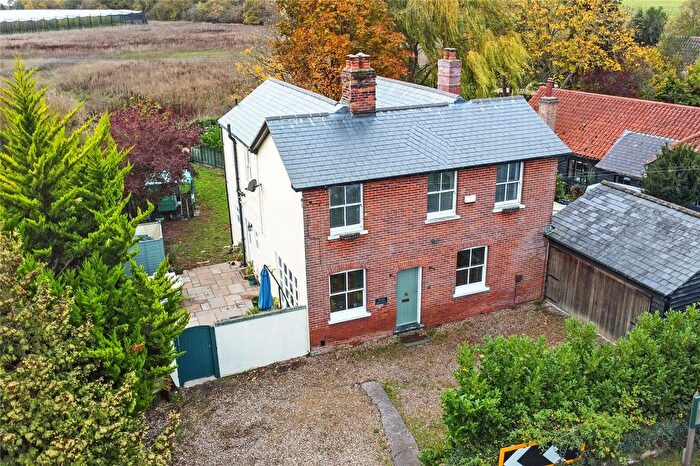
Previously listed properties in Leavenheath
Roads and Postcodes in Leavenheath
Navigate through our locations to find the location of your next house in Leavenheath, Colchester for sale or to rent.
| Streets | Postcodes |
|---|---|
| Blackthorn Way | CO6 4UR |
| Bramble Way | CO6 4UN |
| Broad Oaks | CO6 4UJ |
| Campion Way | CO6 4UP |
| Church Hill Cottages | CO6 4PT |
| Cock Street | CO6 4PJ |
| Edies Lane | CO6 4PA |
| Eglantine Way | CO6 4NW |
| Elm Tree Lane | CO6 4UL |
| Harrow Street | CO6 4PN CO6 4PW |
| Hawthorn Way | CO6 4RF |
| Heathlands | CO6 4PY |
| High Road | CO6 4NZ CO6 4PB CO6 4PE CO6 4PG |
| Honey Tye | CO6 4NX CO6 4NY |
| Kingsland Lane | CO6 4PD |
| Locks Lane | CO6 4PF |
| Maple Way | CO6 4PQ |
| Mayfield | CO6 4US |
| Nayland Road | CO6 4PH CO6 4PU |
| Oaklands | CO6 4UH |
| Orchard View | CO6 4FG |
| Plough Lane | CO6 4PL |
| Red Barn Drive | CO6 4UW |
| Rowans Way | CO6 4UU |
| Stoke Road | CO6 4PP CO6 4PR CO6 4PS |
| Sweet Briar Close | CO6 4NP |
| The Green | CO6 4NN |
| The Old Road | CO6 4QB |
| The Ridings | CO6 4QA |
| Wrights Way | CO6 4NR CO6 4NS |
Transport near Leavenheath
-
Bures Station
-
Sudbury Station
-
Chappel and Wakes Colne Station
-
Colchester Station
-
Colchester Town Station
-
Marks Tey Station
-
Hythe Station
-
Manningtree Station
- FAQ
- Price Paid By Year
- Property Type Price
Frequently asked questions about Leavenheath
What is the average price for a property for sale in Leavenheath?
The average price for a property for sale in Leavenheath is £400,610. This amount is 17% lower than the average price in Colchester. There are 85 property listings for sale in Leavenheath.
What streets have the most expensive properties for sale in Leavenheath?
The streets with the most expensive properties for sale in Leavenheath are Stoke Road at an average of £785,000, Harrow Street at an average of £657,500 and High Road at an average of £641,750.
What streets have the most affordable properties for sale in Leavenheath?
The streets with the most affordable properties for sale in Leavenheath are Church Hill Cottages at an average of £220,000, Hawthorn Way at an average of £240,000 and Rowans Way at an average of £250,125.
Which train stations are available in or near Leavenheath?
Some of the train stations available in or near Leavenheath are Bures, Sudbury and Chappel and Wakes Colne.
Property Price Paid in Leavenheath by Year
The average sold property price by year was:
| Year | Average Sold Price | Price Change |
Sold Properties
|
|---|---|---|---|
| 2025 | £375,938 | -12% |
17 Properties |
| 2024 | £422,380 | 7% |
25 Properties |
| 2023 | £394,666 | -11% |
21 Properties |
| 2022 | £437,818 | 6% |
23 Properties |
| 2021 | £412,689 | -2% |
38 Properties |
| 2020 | £422,014 | 21% |
27 Properties |
| 2019 | £331,713 | 4% |
22 Properties |
| 2018 | £318,269 | -18% |
26 Properties |
| 2017 | £376,603 | 9% |
24 Properties |
| 2016 | £340,870 | 15% |
31 Properties |
| 2015 | £290,559 | 10% |
21 Properties |
| 2014 | £262,519 | 3% |
26 Properties |
| 2013 | £253,360 | -15% |
18 Properties |
| 2012 | £290,184 | 14% |
19 Properties |
| 2011 | £248,487 | 9% |
21 Properties |
| 2010 | £227,021 | -4% |
23 Properties |
| 2009 | £235,330 | 1% |
24 Properties |
| 2008 | £234,041 | -2% |
18 Properties |
| 2007 | £238,007 | -3% |
33 Properties |
| 2006 | £244,646 | 6% |
41 Properties |
| 2005 | £229,431 | 11% |
22 Properties |
| 2004 | £205,023 | -0,2% |
31 Properties |
| 2003 | £205,519 | 23% |
53 Properties |
| 2002 | £159,126 | 14% |
39 Properties |
| 2001 | £136,568 | 14% |
45 Properties |
| 2000 | £117,827 | 8% |
32 Properties |
| 1999 | £108,616 | 14% |
40 Properties |
| 1998 | £93,514 | 6% |
39 Properties |
| 1997 | £87,672 | 4% |
65 Properties |
| 1996 | £84,266 | 20% |
54 Properties |
| 1995 | £67,004 | - |
53 Properties |
Property Price per Property Type in Leavenheath
Here you can find historic sold price data in order to help with your property search.
The average Property Paid Price for specific property types in the last three years are:
| Property Type | Average Sold Price | Sold Properties |
|---|---|---|
| Detached House | £483,128.00 | 39 Detached Houses |
| Terraced House | £250,527.00 | 18 Terraced Houses |
| Semi Detached House | £314,491.00 | 6 Semi Detached Houses |

