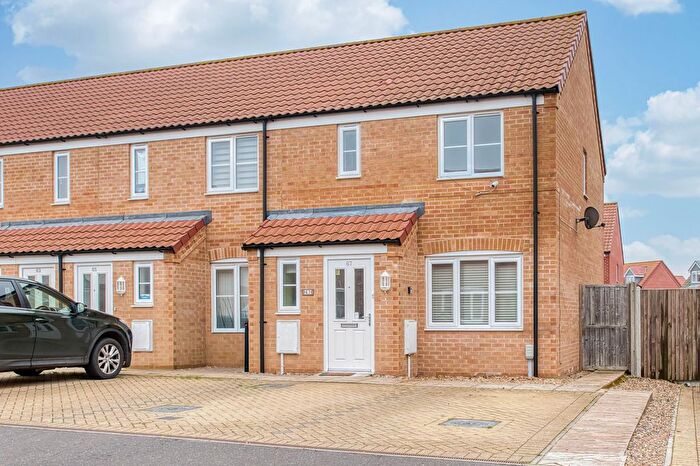
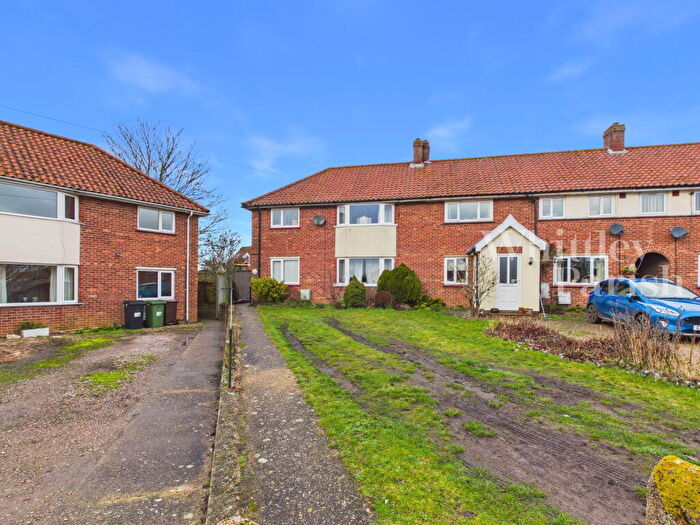
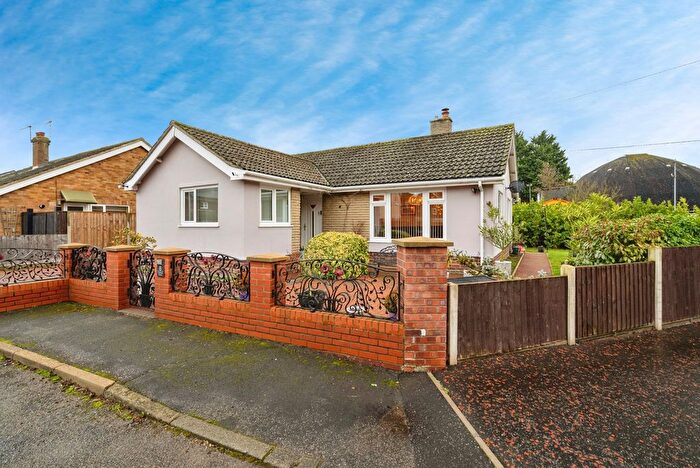
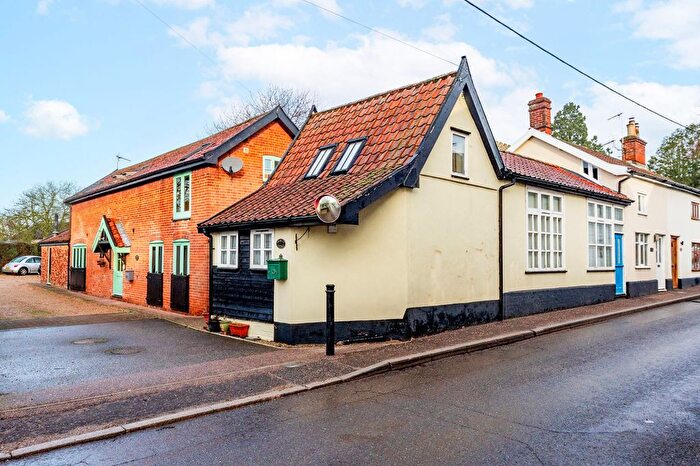
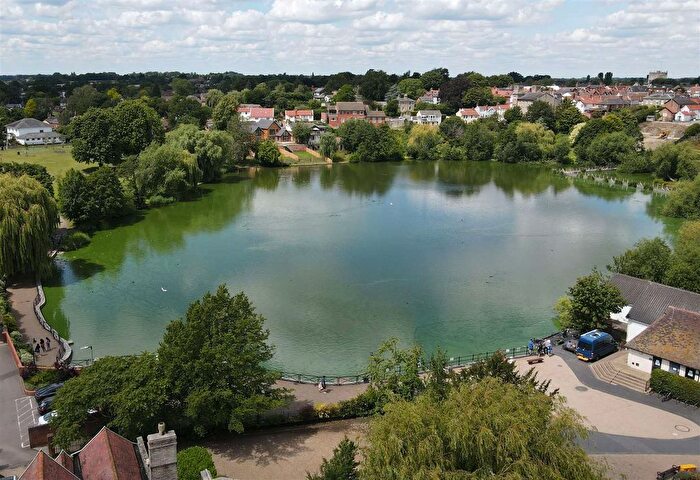
Houses for sale & to rent in Palgrave, Diss
House Prices in Palgrave
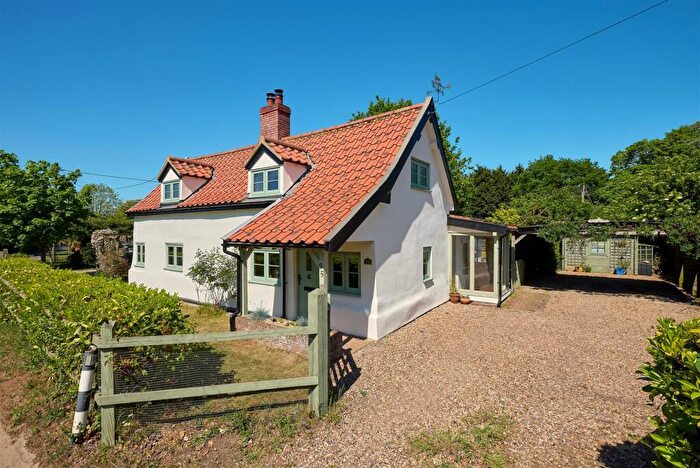
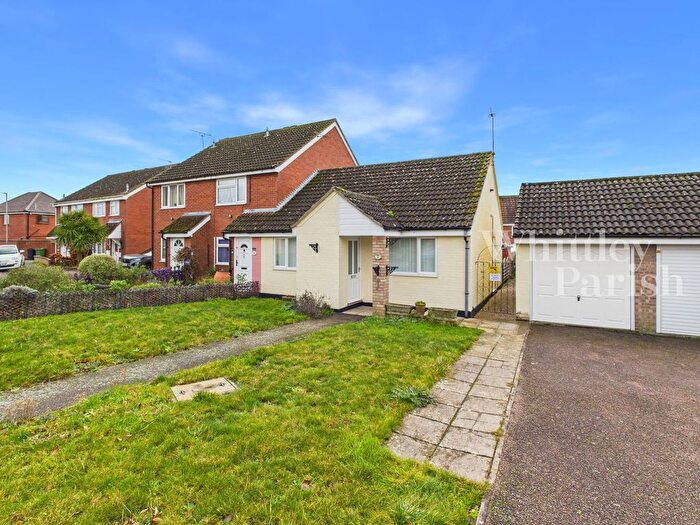
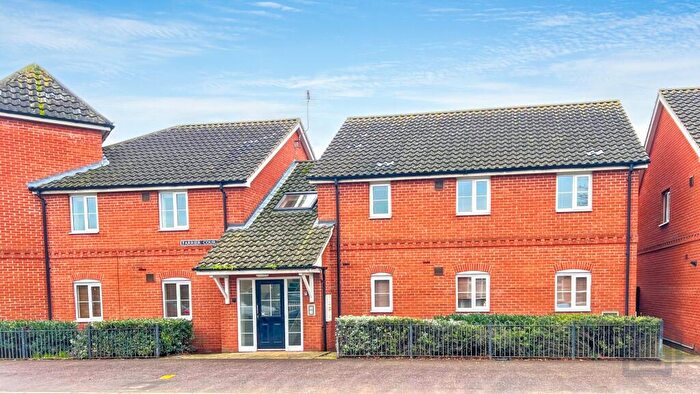
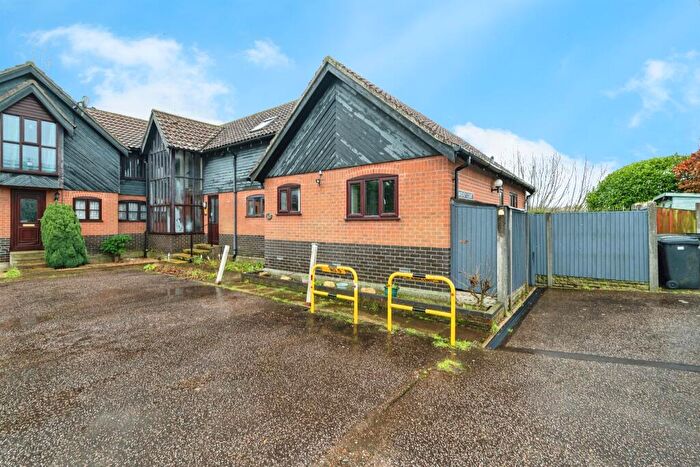
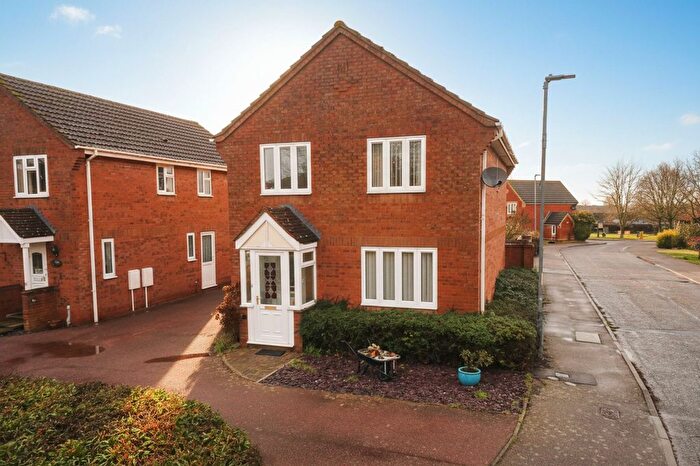
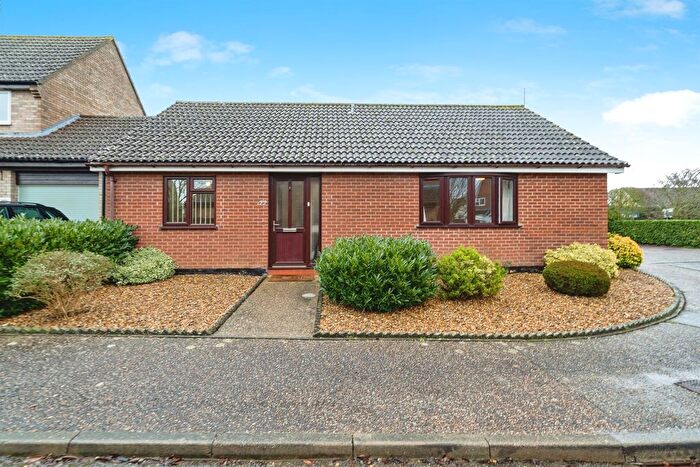
Properties in Palgrave have an average house price of £426,750.00 and had 52 Property Transactions within the last 3 years¹.
Palgrave is an area in Diss, Suffolk with 611 households², where the most expensive property was sold for £1,130,000.00.
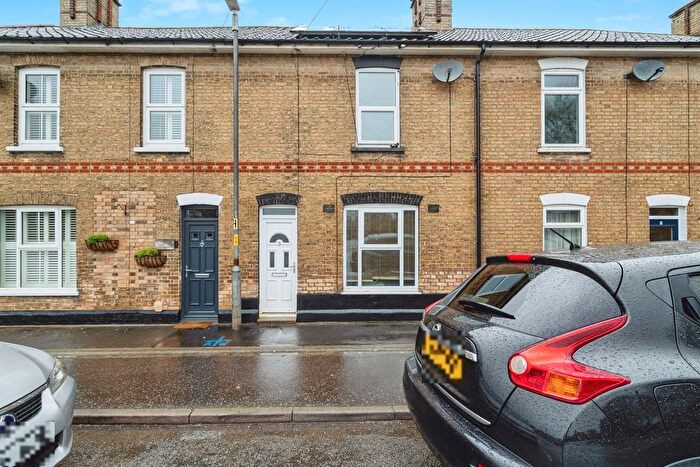
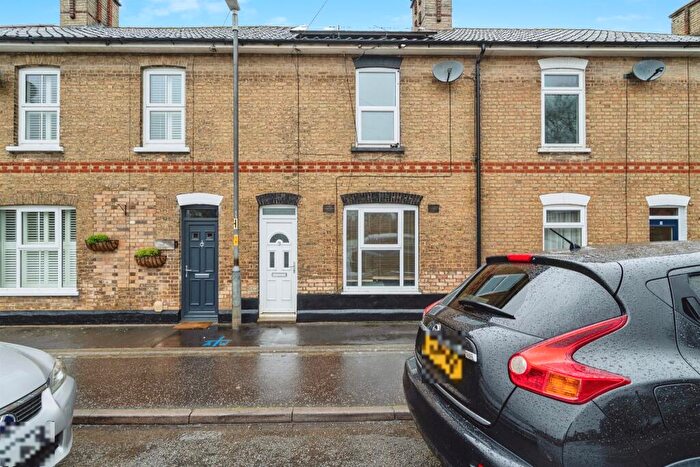
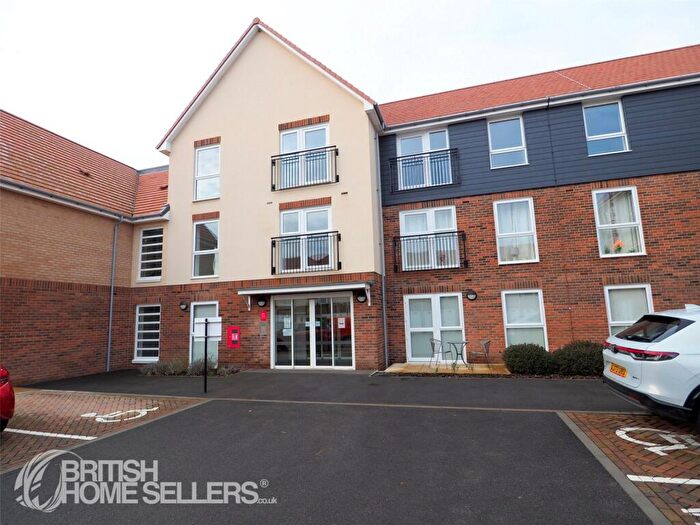
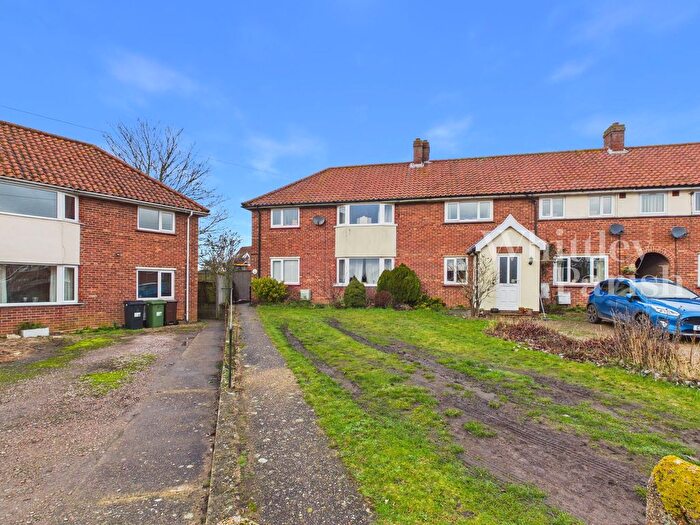
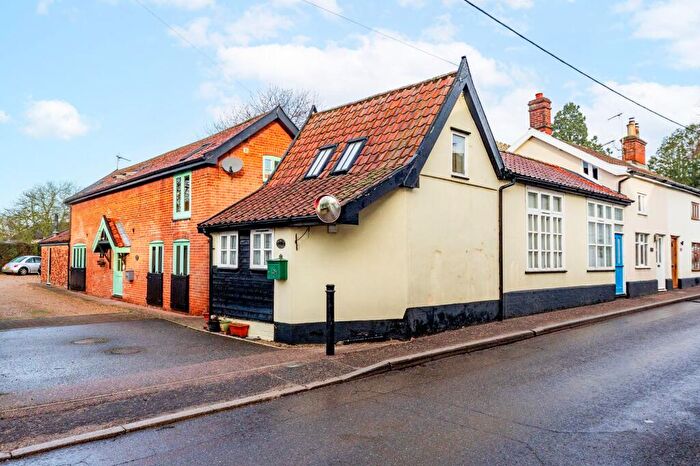
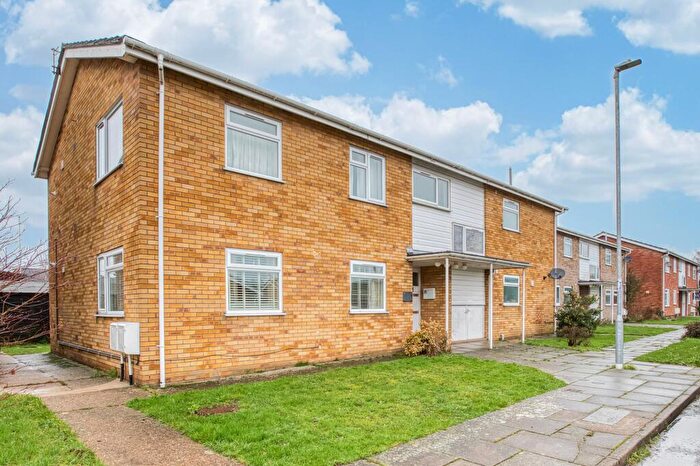
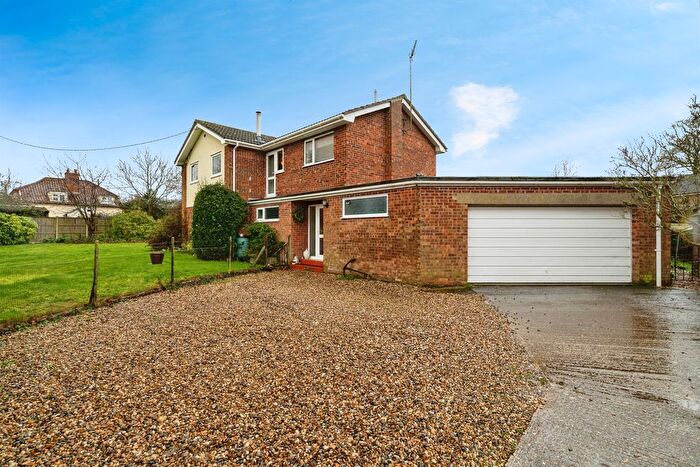
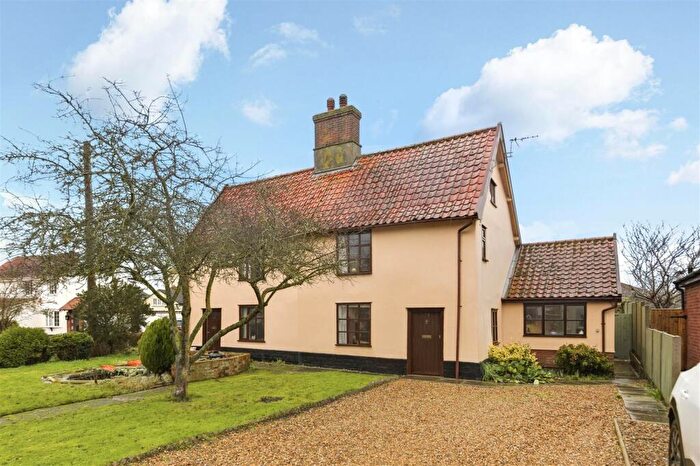
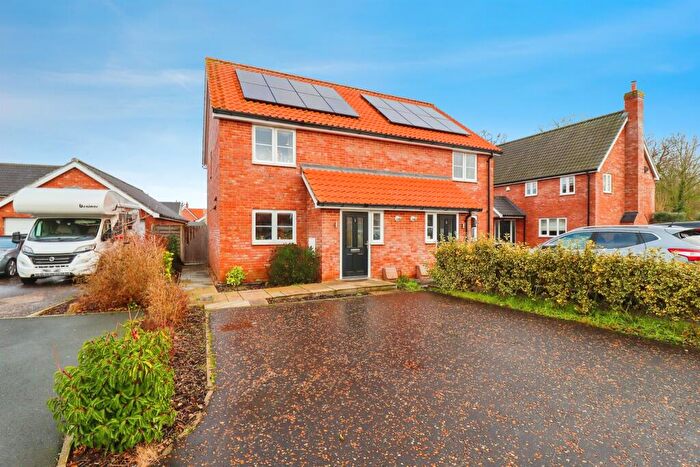
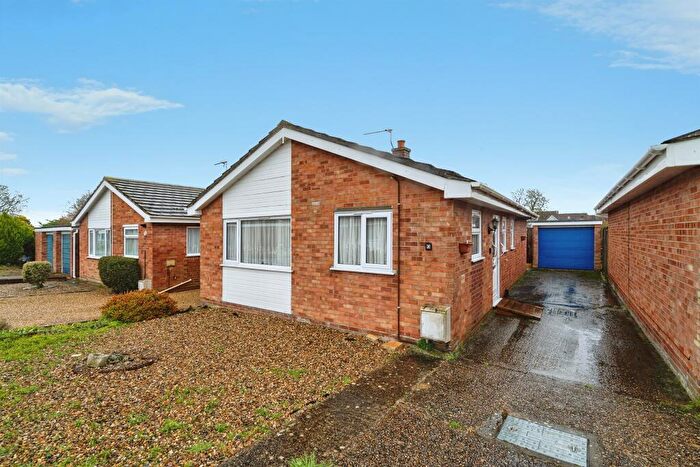
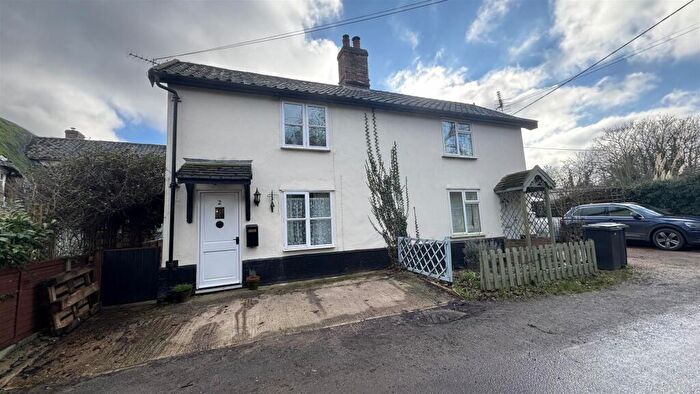
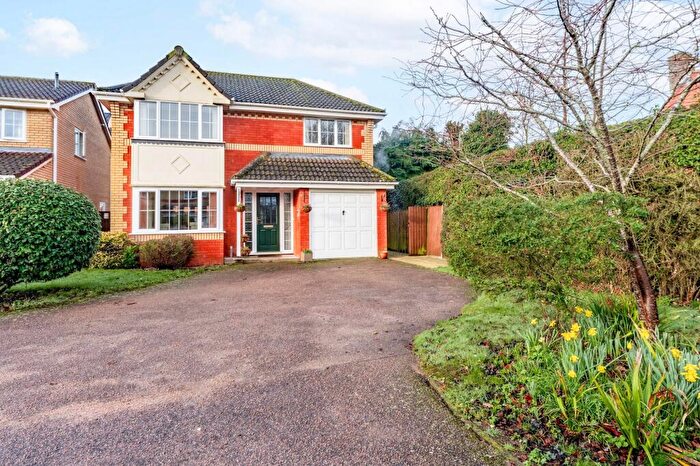
Properties for sale in Palgrave
Roads and Postcodes in Palgrave
Navigate through our locations to find the location of your next house in Palgrave, Diss for sale or to rent.
| Streets | Postcodes |
|---|---|
| Abbey Close | IP21 4BJ |
| Barbauld Close | IP22 1BJ |
| Blands Farm Close | IP22 1TD |
| Brome Road | IP21 4AE IP21 4BH |
| Burlington Close | IP22 1AU |
| Bury Road | IP21 4AJ |
| Church Farm Close | IP22 1AX |
| Church Lane | IP21 4AG |
| Church Terrace | IP22 1AH |
| Church View | IP21 4BY |
| Clarke Close | IP22 1BE |
| Coleman Close | IP22 1TH |
| Common Hill | IP22 1BG IP22 1WH |
| Crossing Road | IP22 1AW |
| Denmark Court | IP22 1BF |
| Denmark Hill | IP22 1AB |
| Draycott Rise | IP22 1FJ |
| Dross Lane | IP21 4AR |
| Forge Close | IP22 1AQ |
| Forge Meadow | IP21 4FB |
| Gassock Drive | IP22 1DQ |
| Goulds Close | IP22 1AR |
| Great Green | IP21 4BL IP21 4BN IP21 4BP IP21 4BQ |
| Great Green Road | IP22 1BD |
| Green Man Close | IP21 4BF |
| Hilling Gardens | IP22 1FD |
| Leys Lane | IP21 4BT |
| Limes Close | IP22 1TQ |
| Ling Road | IP22 1AA IP22 1SX |
| Lion Road | IP22 1AL IP22 1BA |
| Little Green | IP21 4BX |
| Low Street | IP21 4AP IP21 4AQ |
| Low Water Lane | IP22 1SW |
| Lower Rose Lane | IP22 1AT |
| Lows Lane | IP22 1AE |
| Marsh Bungalows | IP21 4BZ |
| Martyn Close | IP22 1FB |
| Mellis Road | IP21 4BD IP21 4BU |
| Millway Lane | IP22 1AD IP22 1SN |
| Norwich Road | IP21 4BB IP21 4BS IP14 5PF |
| Oakley Park | IP21 4AU |
| Old Bury Road | IP21 4AD IP22 1AZ IP22 1BB |
| Priory Close | IP22 1AS |
| Priory Road | IP22 1AJ |
| Rectory Lane | IP21 4FD |
| Rose Lane Close | IP22 1TG |
| Scole Road | IP21 4AL |
| Stuston Lane | IP21 4AF |
| Sycamore Close | IP22 1PF |
| Talbots Meadow | IP21 4AZ |
| The Avenue | IP21 4AY |
| The Common | IP21 4AA IP21 4AB IP21 4AH |
| The Green | IP22 1AG IP22 1AN |
| Upper Rose Lane | IP22 1AP |
| Upper Street | IP21 4AT IP21 4AX |
| Warren Hills | IP21 4AN |
| IP14 5PG IP21 4BW |
Transport near Palgrave
-
Diss Station
-
Eccles Road Station
-
Harling Road Station
-
Attleborough Station
-
Elmswell Station
-
Spooner Row Station
-
Stowmarket Station
-
Needham Market Station
-
Wymondham Station
- FAQ
- Price Paid By Year
- Property Type Price
Frequently asked questions about Palgrave
What is the average price for a property for sale in Palgrave?
The average price for a property for sale in Palgrave is £426,750. This amount is 4% higher than the average price in Diss. There are 2,675 property listings for sale in Palgrave.
What streets have the most expensive properties for sale in Palgrave?
The streets with the most expensive properties for sale in Palgrave are Clarke Close at an average of £915,000, Talbots Meadow at an average of £650,000 and Great Green at an average of £631,833.
What streets have the most affordable properties for sale in Palgrave?
The streets with the most affordable properties for sale in Palgrave are Mellis Road at an average of £143,000, Lows Lane at an average of £290,000 and Denmark Court at an average of £326,250.
Which train stations are available in or near Palgrave?
Some of the train stations available in or near Palgrave are Diss, Eccles Road and Harling Road.
Property Price Paid in Palgrave by Year
The average sold property price by year was:
| Year | Average Sold Price | Price Change |
Sold Properties
|
|---|---|---|---|
| 2025 | £458,045 | 22% |
11 Properties |
| 2024 | £358,119 | -34% |
21 Properties |
| 2023 | £481,600 | -1% |
20 Properties |
| 2022 | £485,833 | 7% |
12 Properties |
| 2021 | £453,557 | 12% |
35 Properties |
| 2020 | £397,750 | -8% |
22 Properties |
| 2019 | £428,846 | 13% |
26 Properties |
| 2018 | £371,758 | 2% |
24 Properties |
| 2017 | £363,058 | 7% |
24 Properties |
| 2016 | £336,140 | 10% |
32 Properties |
| 2015 | £303,307 | 12% |
34 Properties |
| 2014 | £266,585 | -4% |
20 Properties |
| 2013 | £277,360 | 3% |
30 Properties |
| 2012 | £269,545 | 4% |
22 Properties |
| 2011 | £258,497 | -24% |
23 Properties |
| 2010 | £320,119 | 28% |
21 Properties |
| 2009 | £230,102 | -18% |
24 Properties |
| 2008 | £270,543 | -20% |
26 Properties |
| 2007 | £325,055 | 21% |
36 Properties |
| 2006 | £257,613 | 6% |
32 Properties |
| 2005 | £243,207 | -7% |
19 Properties |
| 2004 | £259,219 | 15% |
26 Properties |
| 2003 | £221,284 | -5% |
20 Properties |
| 2002 | £232,357 | 32% |
21 Properties |
| 2001 | £156,880 | 9% |
28 Properties |
| 2000 | £142,566 | 3% |
15 Properties |
| 1999 | £138,478 | 35% |
35 Properties |
| 1998 | £90,344 | 3% |
18 Properties |
| 1997 | £87,729 | -12% |
28 Properties |
| 1996 | £98,352 | 9% |
27 Properties |
| 1995 | £89,589 | - |
46 Properties |
Property Price per Property Type in Palgrave
Here you can find historic sold price data in order to help with your property search.
The average Property Paid Price for specific property types in the last three years are:
| Property Type | Average Sold Price | Sold Properties |
|---|---|---|
| Semi Detached House | £287,812.00 | 16 Semi Detached Houses |
| Detached House | £530,967.00 | 31 Detached Houses |
| Terraced House | £225,200.00 | 5 Terraced Houses |

