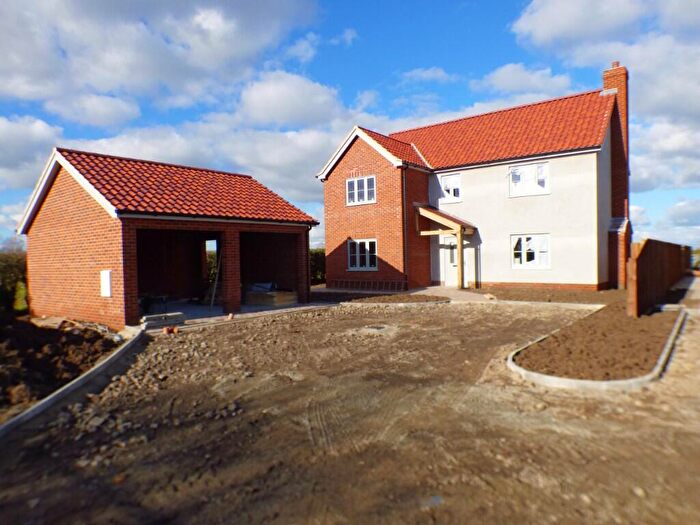
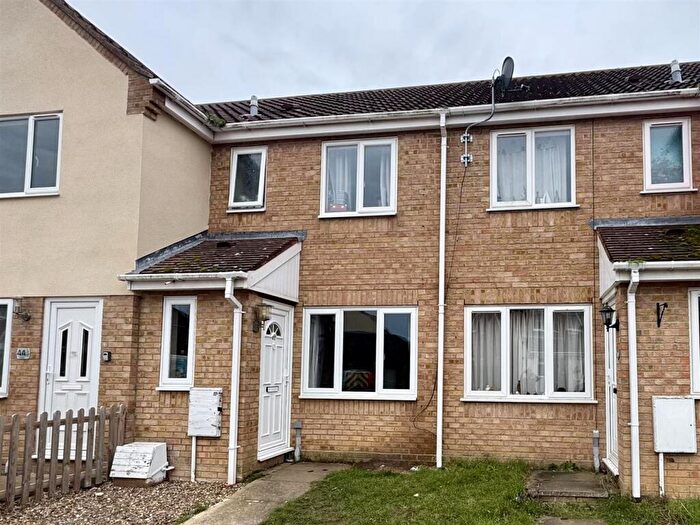
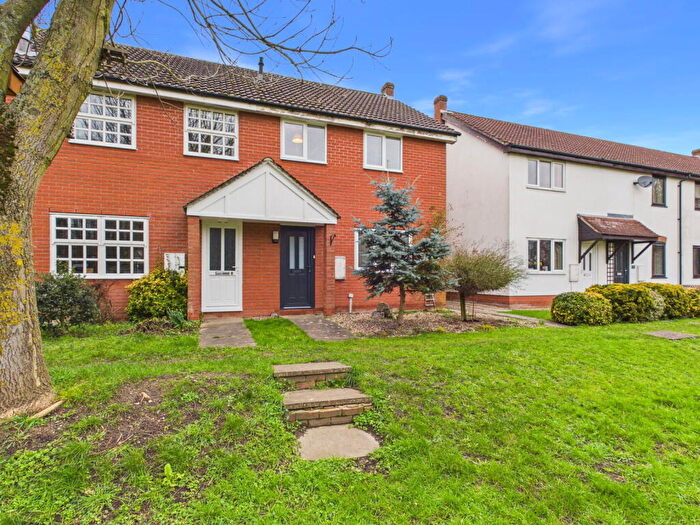
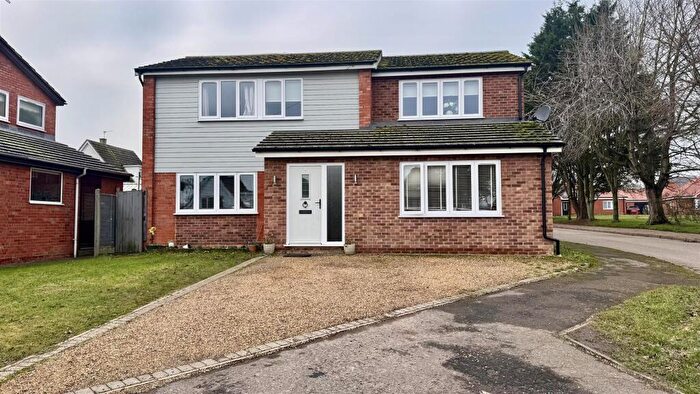
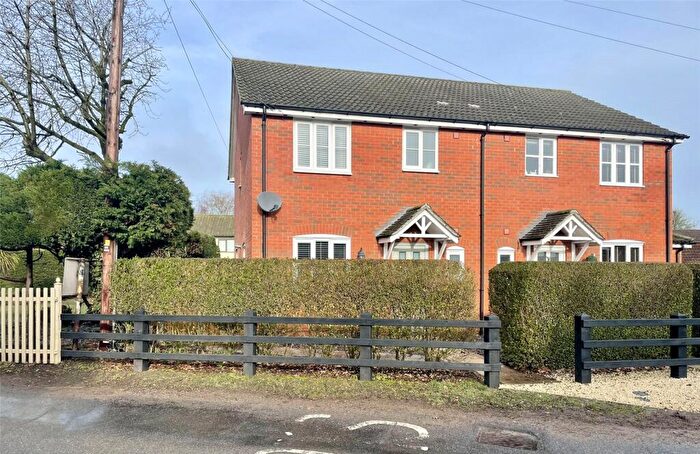
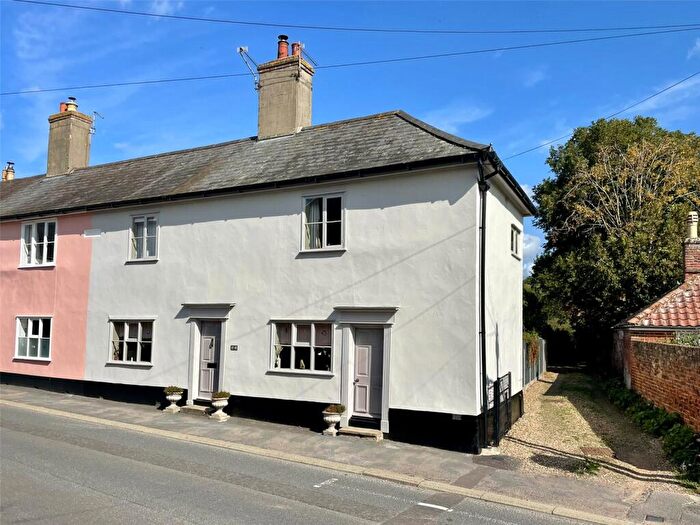
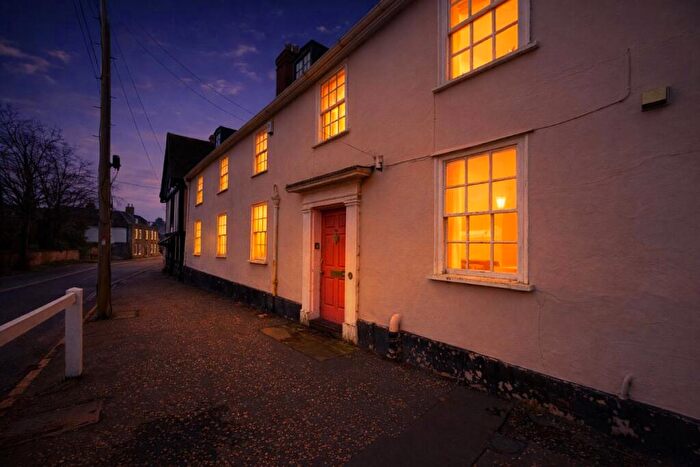
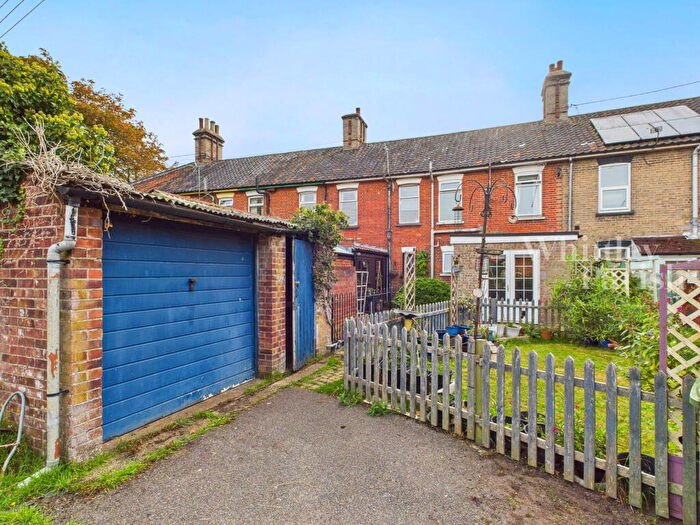
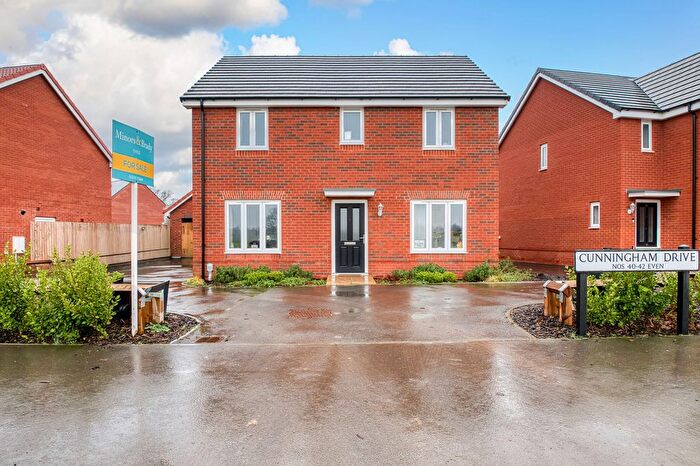
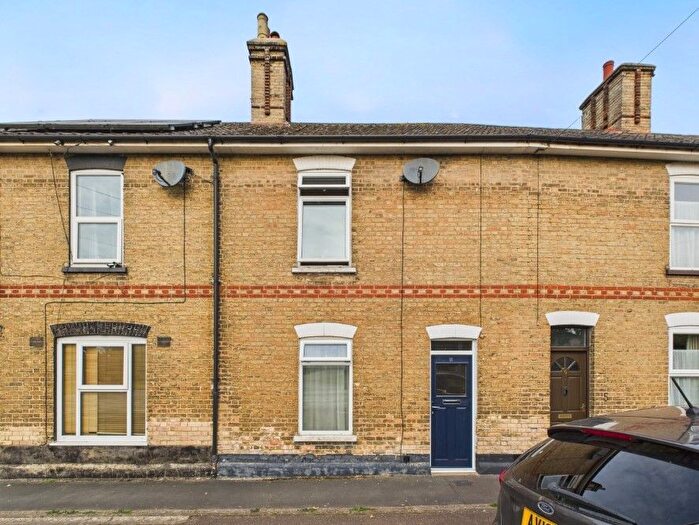
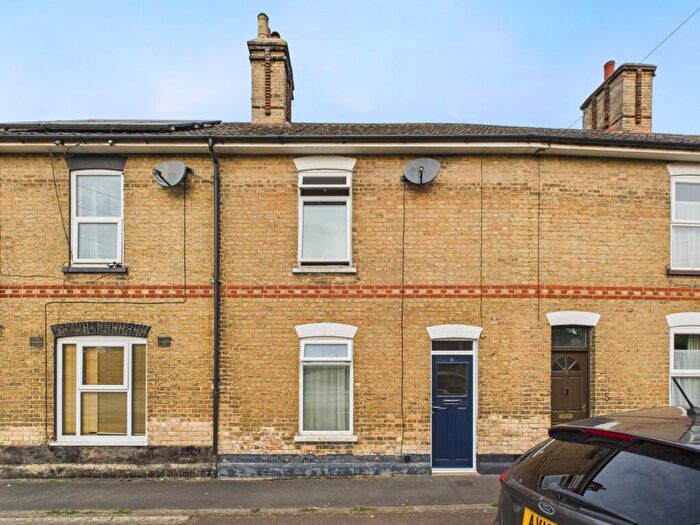
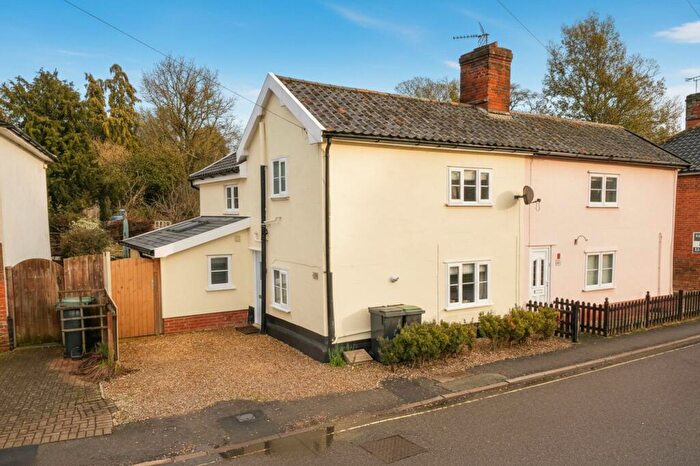
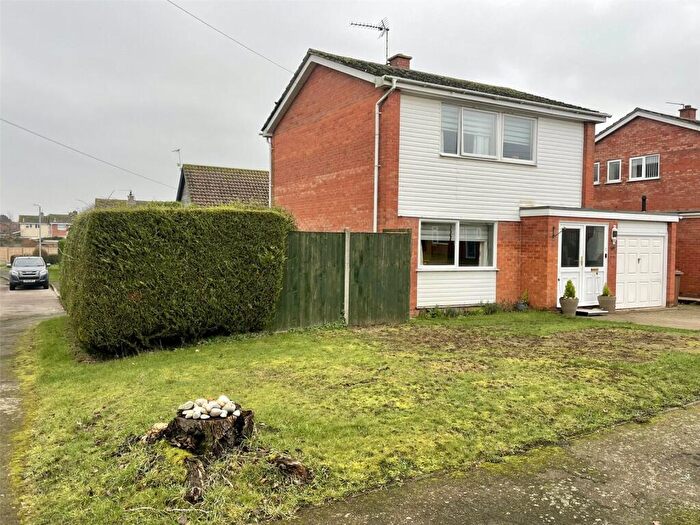
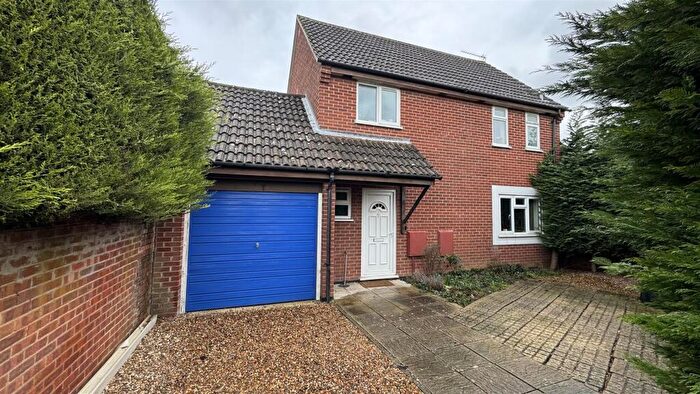
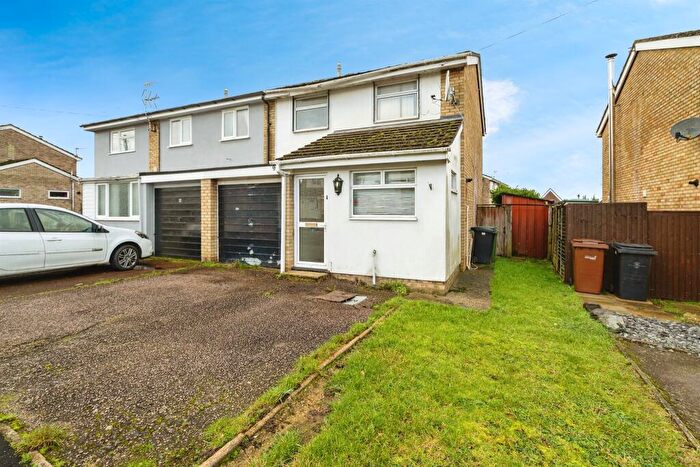
Houses for sale & to rent in Palgrave, Eye
House Prices in Palgrave
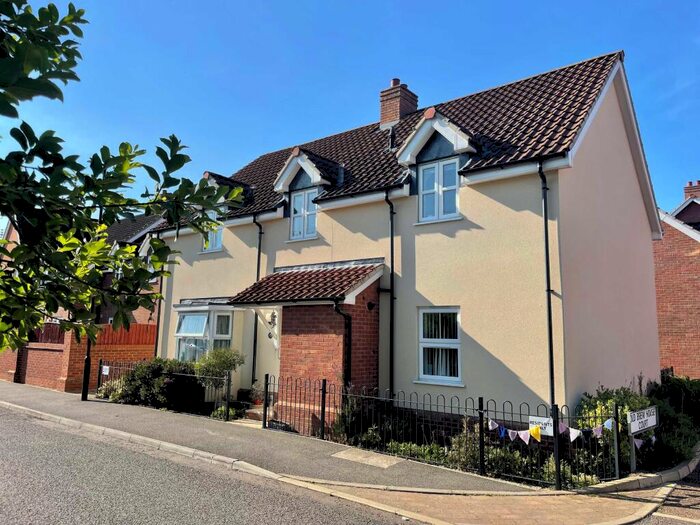
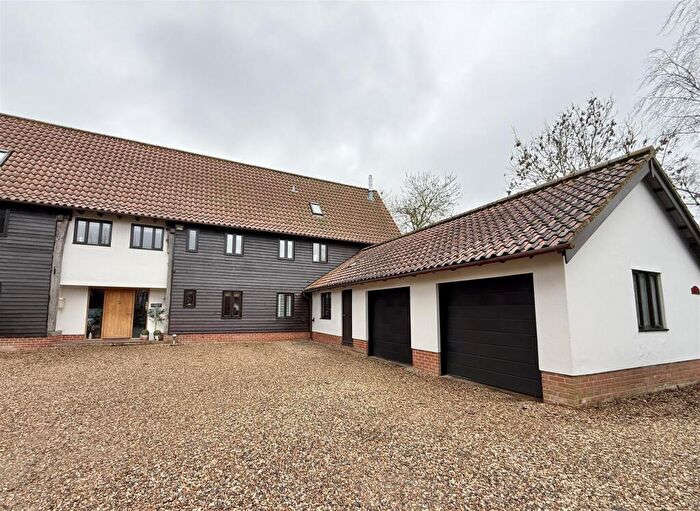
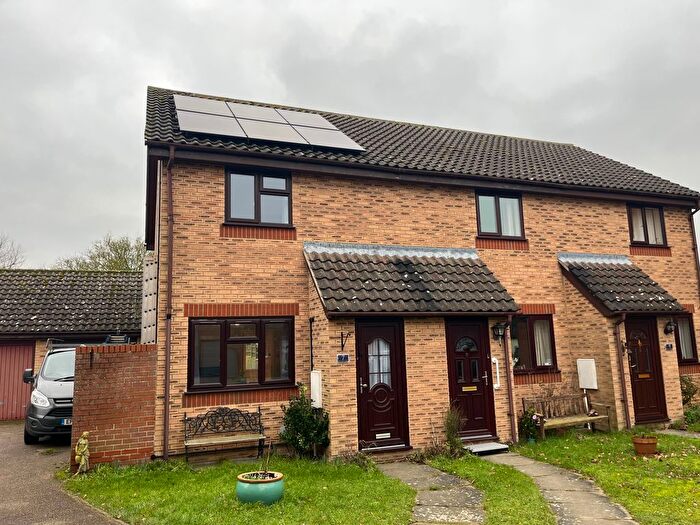
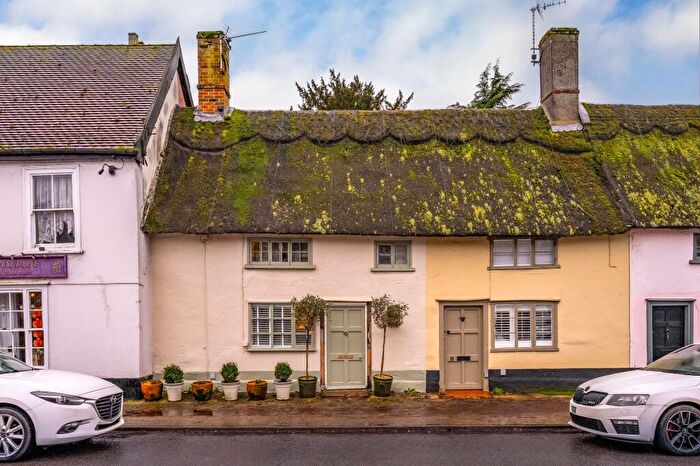
Properties in Palgrave have an average house price of £410,523.00 and had 21 Property Transactions within the last 3 years¹.
Palgrave is an area in Eye, Suffolk with 321 households², where the most expensive property was sold for £805,000.00.
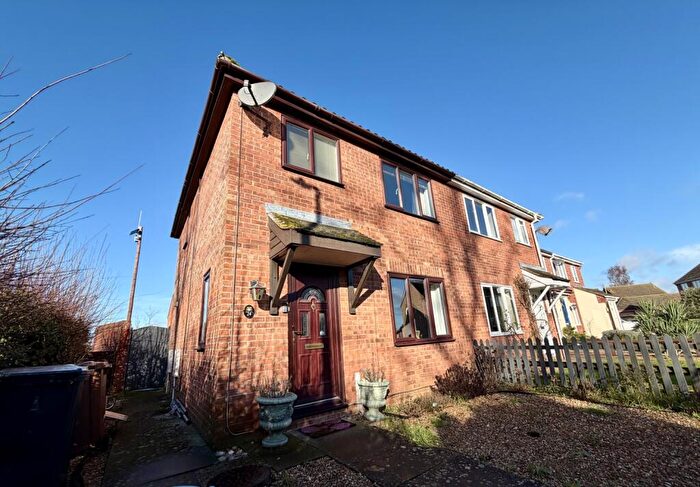
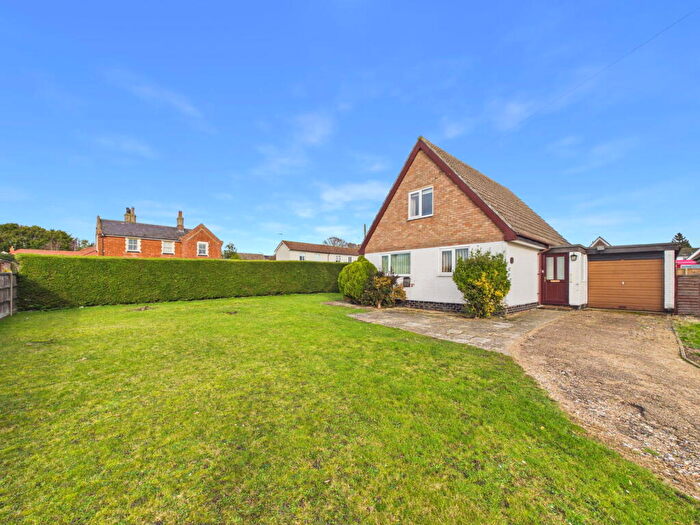
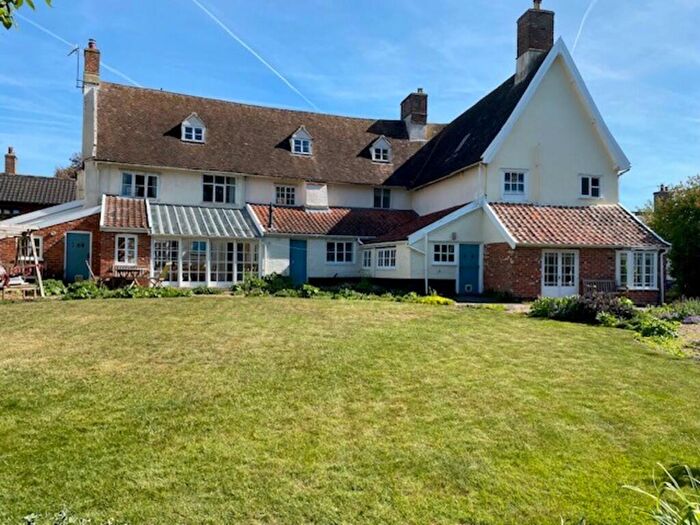
Properties for sale in Palgrave
Roads and Postcodes in Palgrave
Navigate through our locations to find the location of your next house in Palgrave, Eye for sale or to rent.
| Streets | Postcodes |
|---|---|
| Airfield Industrial Estate | IP23 7HN |
| Bromelands | IP23 8AG |
| Burns Close | IP23 8DD |
| Cherry Tree Close | IP23 8DH |
| Church Lane | IP23 8BU |
| Cuckoo Close | IP23 8GL |
| Eye Road | IP23 8AL IP23 8AS IP23 8BL |
| Hall Lane | IP23 8BY |
| Huggins Lane | IP23 7EG |
| Ipswich Road | IP23 8BT IP23 8BZ |
| Judas Lane | IP23 8DF |
| Leys Lane | IP23 8DX |
| Lyon Close | IP23 8BE |
| Maple Close | IP23 8DQ |
| Mellis Road | IP23 8DA IP23 8DB IP23 8DG |
| Mill Lane | IP23 7EZ |
| Millside | IP23 8EJ |
| Nicks Lane | IP23 8AN |
| Norwich Road | IP23 8AP IP23 8AR |
| Old Ipswich Road | IP23 8BP IP23 8BX IP23 8BS |
| Old Norwich Road | IP23 8BH |
| Rectory Road | IP23 8AH IP23 8AJ |
| St Brelades Close | IP23 8BA |
| The Crossroads | IP23 8AZ IP23 8FD |
| The Street | IP23 8AE IP23 8AF IP23 8BJ IP23 8AD |
| Thorndon Bridge | IP23 7EA |
| Thornham Road | IP23 8DE |
| Thrandeston Road | IP23 8AT |
| Warren Hill | IP23 8AA |
| Wheelwright Close | IP23 8GA |
| Wickham Road | IP23 7EF |
| Yaxley Road | IP23 7HD |
Transport near Palgrave
-
Diss Station
-
Elmswell Station
-
Stowmarket Station
-
Eccles Road Station
-
Needham Market Station
-
Harling Road Station
-
Attleborough Station
-
Thurston Station
-
Spooner Row Station
- FAQ
- Price Paid By Year
- Property Type Price
Frequently asked questions about Palgrave
What is the average price for a property for sale in Palgrave?
The average price for a property for sale in Palgrave is £410,523. This amount is 2% higher than the average price in Eye. There are 2,239 property listings for sale in Palgrave.
What streets have the most expensive properties for sale in Palgrave?
The streets with the most expensive properties for sale in Palgrave are Old Norwich Road at an average of £637,500, Thrandeston Road at an average of £480,000 and Church Lane at an average of £465,000.
What streets have the most affordable properties for sale in Palgrave?
The streets with the most affordable properties for sale in Palgrave are Burns Close at an average of £292,000, Cherry Tree Close at an average of £315,000 and Mellis Road at an average of £367,500.
Which train stations are available in or near Palgrave?
Some of the train stations available in or near Palgrave are Diss, Elmswell and Stowmarket.
Property Price Paid in Palgrave by Year
The average sold property price by year was:
| Year | Average Sold Price | Price Change |
Sold Properties
|
|---|---|---|---|
| 2025 | £380,500 | -2% |
8 Properties |
| 2024 | £390,000 | -19% |
6 Properties |
| 2023 | £462,428 | -25% |
7 Properties |
| 2022 | £580,312 | 31% |
8 Properties |
| 2021 | £400,100 | 30% |
25 Properties |
| 2020 | £278,710 | -21% |
15 Properties |
| 2019 | £336,142 | -7% |
14 Properties |
| 2018 | £360,162 | 5% |
12 Properties |
| 2017 | £341,285 | -0,4% |
14 Properties |
| 2016 | £342,495 | 30% |
10 Properties |
| 2015 | £238,133 | -12% |
15 Properties |
| 2014 | £266,500 | 10% |
8 Properties |
| 2013 | £239,999 | 16% |
11 Properties |
| 2012 | £201,850 | -40% |
10 Properties |
| 2011 | £282,993 | 5% |
8 Properties |
| 2010 | £269,750 | 35% |
6 Properties |
| 2009 | £175,500 | -74% |
8 Properties |
| 2008 | £305,912 | 7% |
8 Properties |
| 2007 | £284,261 | 19% |
21 Properties |
| 2006 | £229,177 | 14% |
11 Properties |
| 2005 | £196,409 | 3% |
11 Properties |
| 2004 | £190,463 | -8% |
29 Properties |
| 2003 | £204,916 | 22% |
18 Properties |
| 2002 | £158,925 | 26% |
27 Properties |
| 2001 | £118,058 | -45% |
17 Properties |
| 2000 | £170,966 | 43% |
15 Properties |
| 1999 | £97,746 | 7% |
13 Properties |
| 1998 | £91,321 | -2% |
14 Properties |
| 1997 | £92,809 | 26% |
21 Properties |
| 1996 | £68,318 | -10% |
11 Properties |
| 1995 | £75,135 | - |
7 Properties |
Property Price per Property Type in Palgrave
Here you can find historic sold price data in order to help with your property search.
The average Property Paid Price for specific property types in the last three years are:
| Property Type | Average Sold Price | Sold Properties |
|---|---|---|
| Semi Detached House | £305,571.00 | 7 Semi Detached Houses |
| Detached House | £475,538.00 | 13 Detached Houses |
| Terraced House | £300,000.00 | 1 Terraced House |

