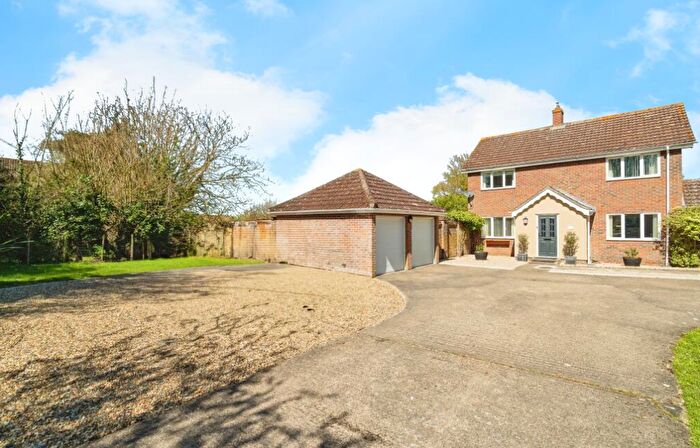
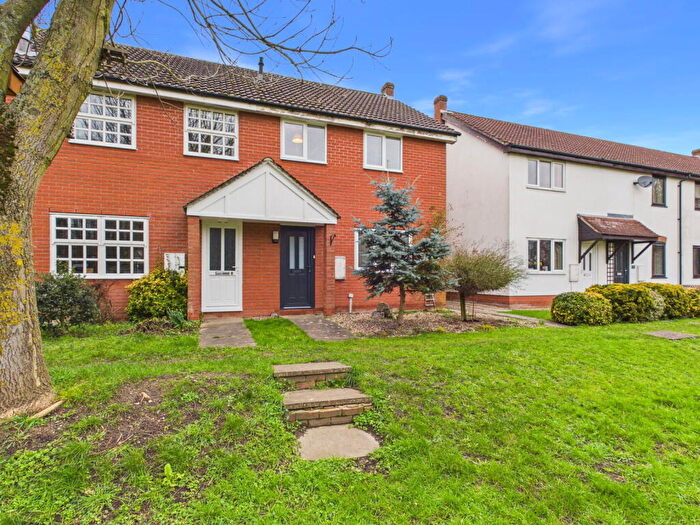
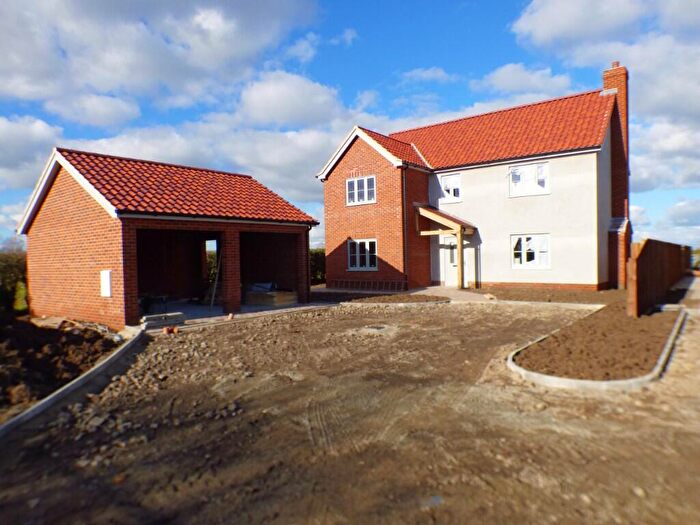
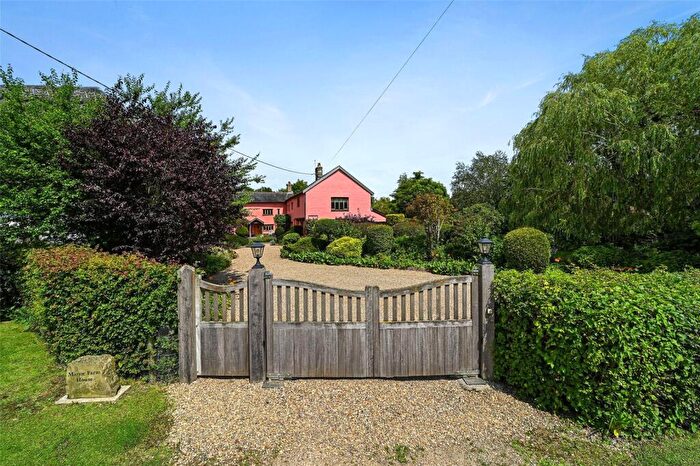
Houses for sale & to rent in Gislingham, Eye
House Prices in Gislingham
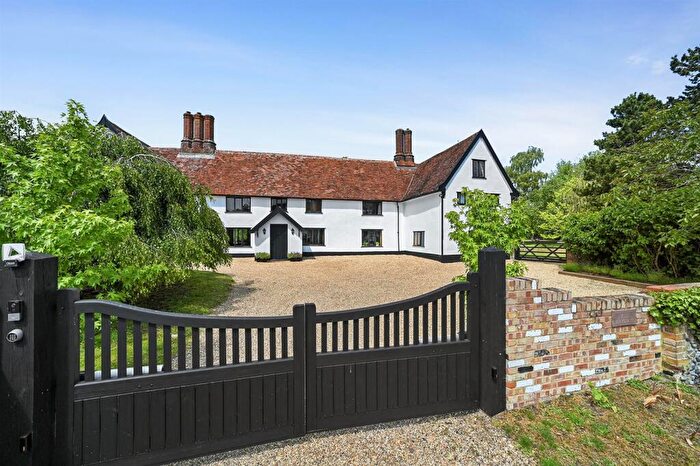
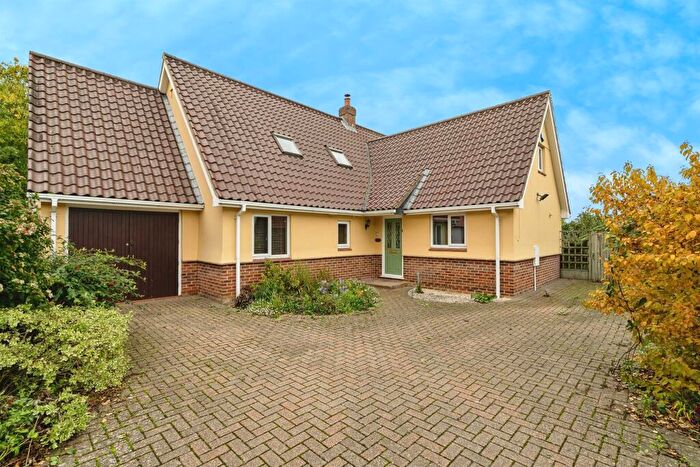
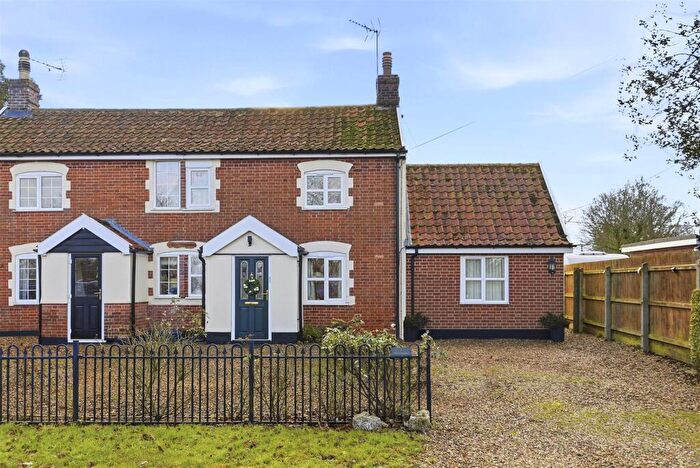
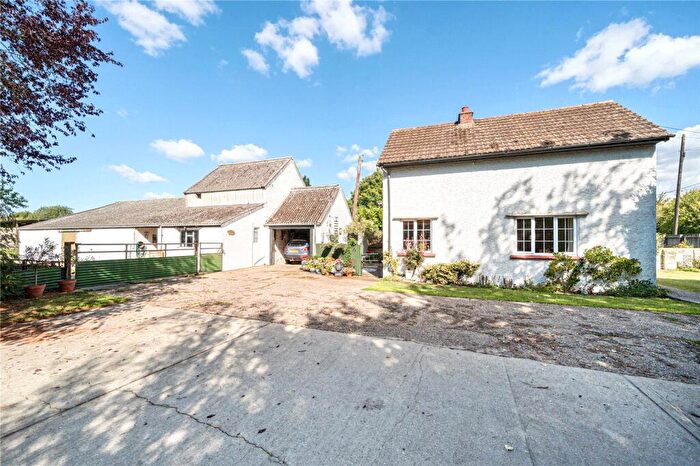
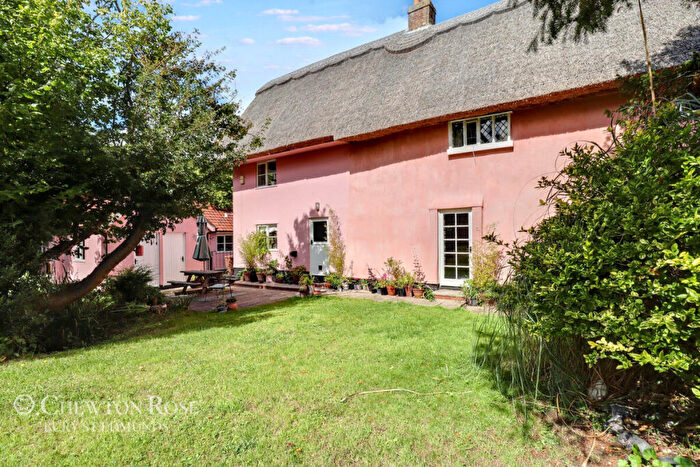
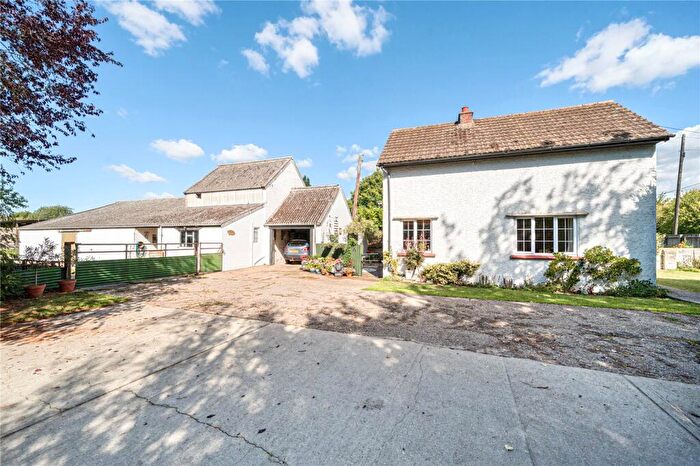
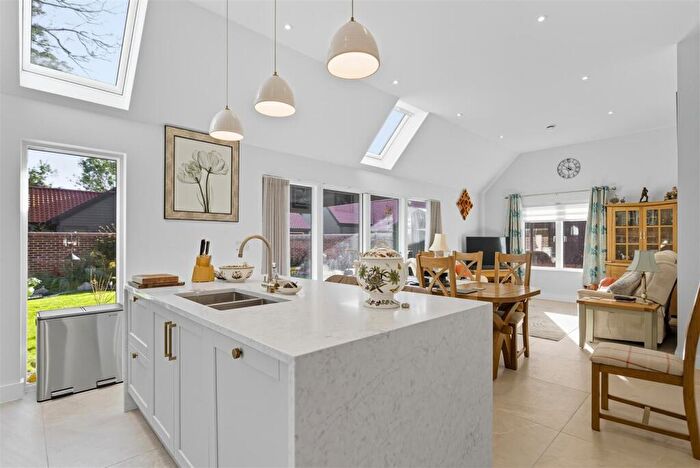
Properties in Gislingham have an average house price of £422,680.00 and had 57 Property Transactions within the last 3 years¹.
Gislingham is an area in Eye, Suffolk with 755 households², where the most expensive property was sold for £870,000.00.
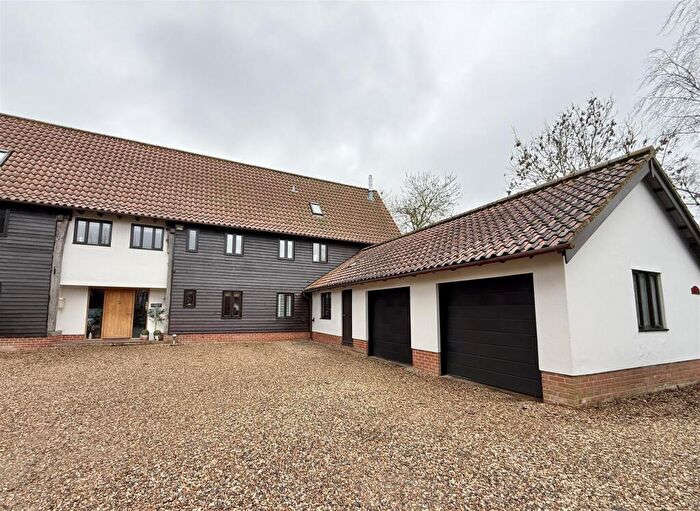
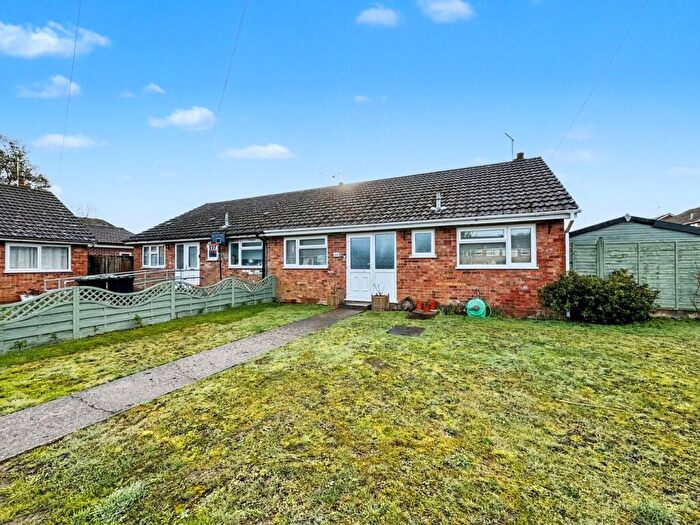
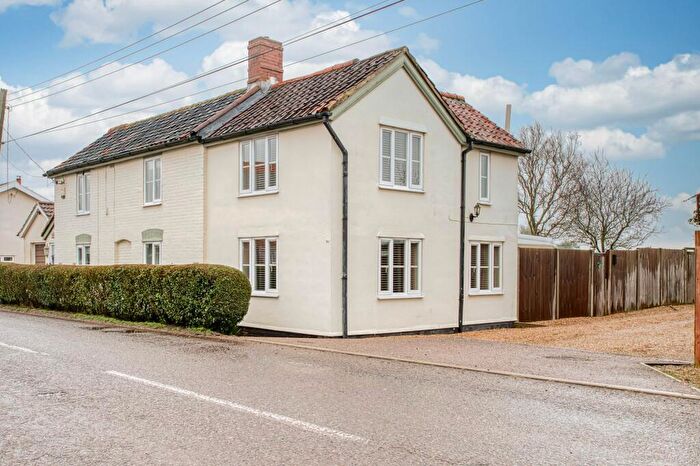
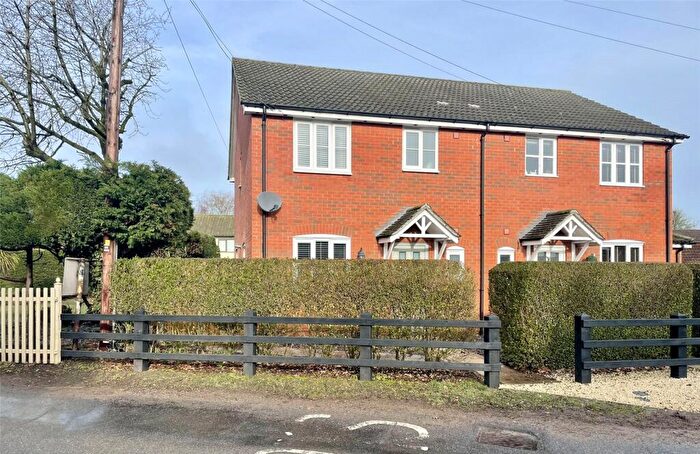
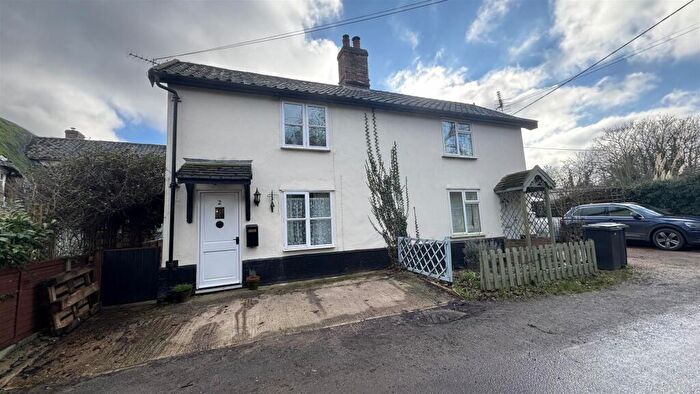
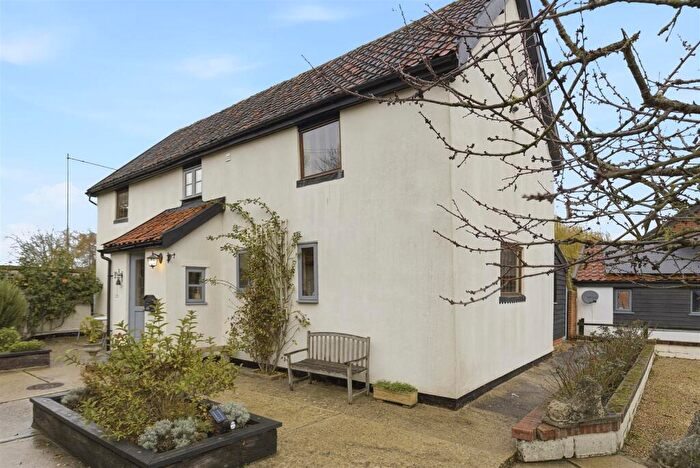
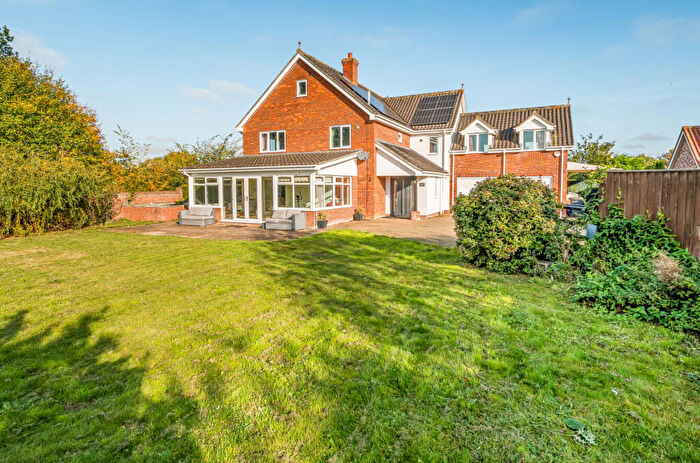
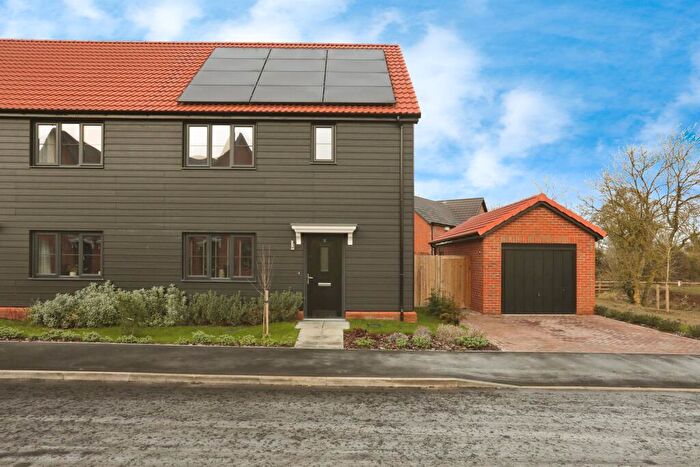
Properties for sale in Gislingham
Roads and Postcodes in Gislingham
Navigate through our locations to find the location of your next house in Gislingham, Eye for sale or to rent.
| Streets | Postcodes |
|---|---|
| Back Street | IP23 8JH |
| Broadfields Close | IP23 8HY |
| Broadfields Road | IP23 8HX |
| Browns Acre | IP23 8EL |
| Bull Road | IP23 8ES |
| Burgate Road | IP23 8JX |
| Chapel Farm Close | IP23 8BF |
| Chapel Lane | IP23 8EU IP23 8EX |
| Church Meadow | IP23 8HQ |
| Clay Street | IP23 8HE |
| Coldham Lane | IP23 8JA |
| Columbine Way | IP23 8HL |
| Cotton Lane | IP23 8LS |
| Crocus Close | IP23 8LD |
| Dove Lane | IP23 8FB |
| Drury Lane | IP23 8ED |
| Earlsford Road | IP23 8DY IP23 8EA |
| Finningham Road | IP23 8JG |
| Gislingham Road | IP23 8ER IP23 8HH |
| Grange Road | IP23 8NF IP23 8NG |
| Grays Close | IP23 8EN |
| Gull Lane | IP23 8HF |
| High Street | IP23 8HS IP23 8JD IP23 8JE |
| Hillcrest | IP23 8HR |
| Howards Close | IP23 8JZ |
| Laundry Lane | IP23 8HG |
| Leeper Close | IP23 8EG |
| Little Green Close | IP23 8JQ |
| Martins Meadow | IP23 8HZ |
| Mellis Common | IP23 8DN IP23 8DW |
| Mellis Road | IP23 8ET IP23 8HU IP23 8JN |
| Mill Lane | IP23 8EP IP23 8JL |
| Mill Street | IP23 8JP IP23 8JR IP23 8JS IP23 8JT |
| Morleys Lane | IP23 8JF |
| Orchard Close | IP23 8JW |
| Pear Close | IP23 8HN |
| Poppy Way | IP23 8LA |
| Pursehouse Close | IP23 8FE |
| Rectory Road | IP23 8DZ |
| Rickinghall Road | IP23 8JJ |
| Robinsons Close | IP23 8DJ |
| Saffron Close | IP23 8LB |
| Spring Close | IP23 8GZ |
| Springfields | IP23 8JB |
| St Andrews Close | IP23 8NQ |
| St Marys Close | IP23 8HW |
| Street Farm Gardens | IP23 8JU |
| Sunnybrook Close | IP23 8BG |
| The Common | IP23 8DS IP23 8DT IP23 8DU IP23 8EB IP23 8EE IP23 8EF |
| The Street | IP23 8GH IP23 8HB |
| Thornham Road | IP23 8HP |
| Thrandeston Road | IP23 8DR |
| Thwaite Road | IP23 8NH |
| Viking Close | IP23 8JY |
| Water Lane | IP23 8LH |
| West View Gardens | IP23 8HT |
| Wickham Road | IP23 8LJ IP23 8LL IP23 8HD |
| Willow Close | IP23 8LE |
| Yaxley Road | IP23 8DP |
| IP23 8EY IP23 8HA |
Transport near Gislingham
- FAQ
- Price Paid By Year
- Property Type Price
Frequently asked questions about Gislingham
What is the average price for a property for sale in Gislingham?
The average price for a property for sale in Gislingham is £422,680. This amount is 5% higher than the average price in Eye. There are 411 property listings for sale in Gislingham.
What streets have the most expensive properties for sale in Gislingham?
The streets with the most expensive properties for sale in Gislingham are Thornham Road at an average of £700,000, The Common at an average of £679,166 and Sunnybrook Close at an average of £675,000.
What streets have the most affordable properties for sale in Gislingham?
The streets with the most affordable properties for sale in Gislingham are Robinsons Close at an average of £197,500, Broadfields Road at an average of £206,750 and Broadfields Close at an average of £226,000.
Which train stations are available in or near Gislingham?
Some of the train stations available in or near Gislingham are Diss, Elmswell and Stowmarket.
Property Price Paid in Gislingham by Year
The average sold property price by year was:
| Year | Average Sold Price | Price Change |
Sold Properties
|
|---|---|---|---|
| 2025 | £444,529 | 13% |
17 Properties |
| 2024 | £387,387 | -17% |
24 Properties |
| 2023 | £452,406 | 9% |
16 Properties |
| 2022 | £412,681 | -6% |
22 Properties |
| 2021 | £435,931 | 19% |
50 Properties |
| 2020 | £355,234 | 5% |
33 Properties |
| 2019 | £337,118 | -3% |
38 Properties |
| 2018 | £345,658 | 5% |
24 Properties |
| 2017 | £328,401 | 3% |
33 Properties |
| 2016 | £317,938 | 3% |
26 Properties |
| 2015 | £309,803 | - |
45 Properties |
| 2014 | £309,806 | 18% |
39 Properties |
| 2013 | £253,836 | 13% |
22 Properties |
| 2012 | £220,584 | 4% |
26 Properties |
| 2011 | £212,410 | -32% |
23 Properties |
| 2010 | £279,814 | 7% |
35 Properties |
| 2009 | £261,096 | -16% |
41 Properties |
| 2008 | £304,153 | 10% |
31 Properties |
| 2007 | £275,028 | 23% |
52 Properties |
| 2006 | £212,037 | 4% |
40 Properties |
| 2005 | £204,021 | -11% |
30 Properties |
| 2004 | £226,245 | 21% |
36 Properties |
| 2003 | £179,283 | 14% |
34 Properties |
| 2002 | £153,747 | 18% |
41 Properties |
| 2001 | £125,587 | 0,2% |
41 Properties |
| 2000 | £125,373 | 21% |
39 Properties |
| 1999 | £98,837 | 18% |
50 Properties |
| 1998 | £80,973 | 3% |
39 Properties |
| 1997 | £78,823 | 22% |
46 Properties |
| 1996 | £61,536 | -15% |
51 Properties |
| 1995 | £70,672 | - |
27 Properties |
Property Price per Property Type in Gislingham
Here you can find historic sold price data in order to help with your property search.
The average Property Paid Price for specific property types in the last three years are:
| Property Type | Average Sold Price | Sold Properties |
|---|---|---|
| Semi Detached House | £293,941.00 | 17 Semi Detached Houses |
| Detached House | £522,636.00 | 33 Detached Houses |
| Terraced House | £245,133.00 | 6 Terraced Houses |
| Flat | £378,000.00 | 1 Flat |

