
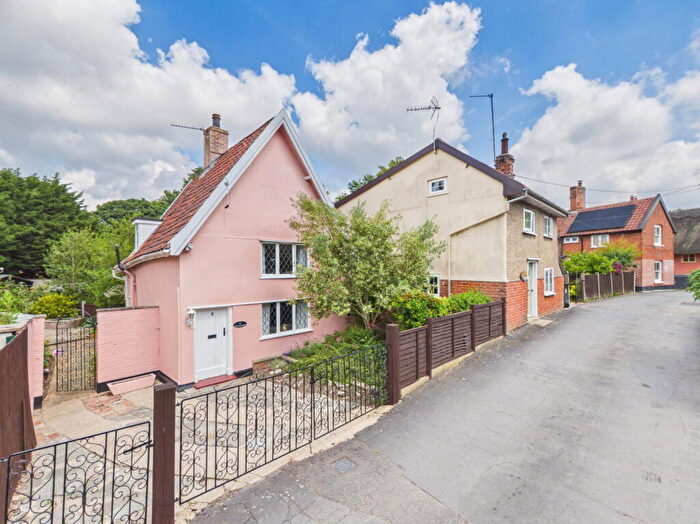
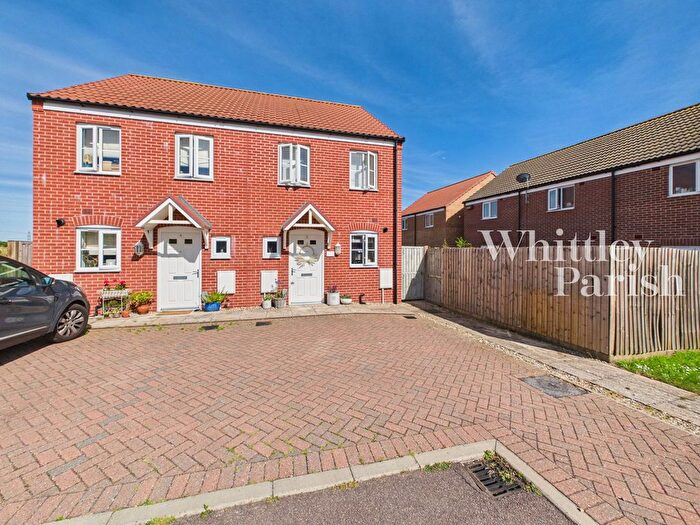
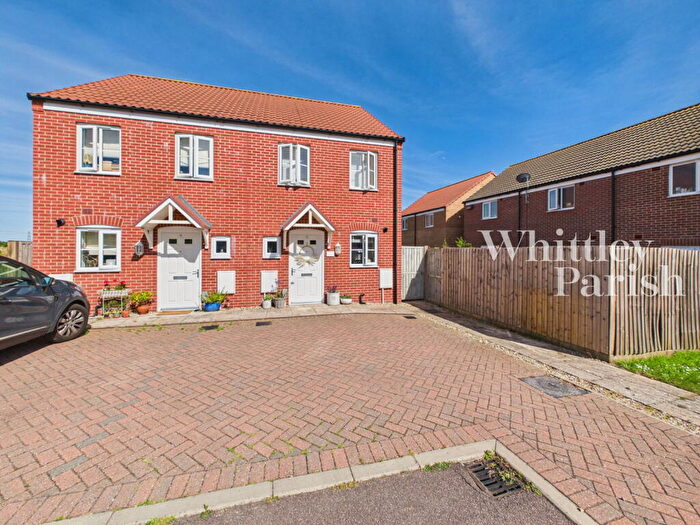
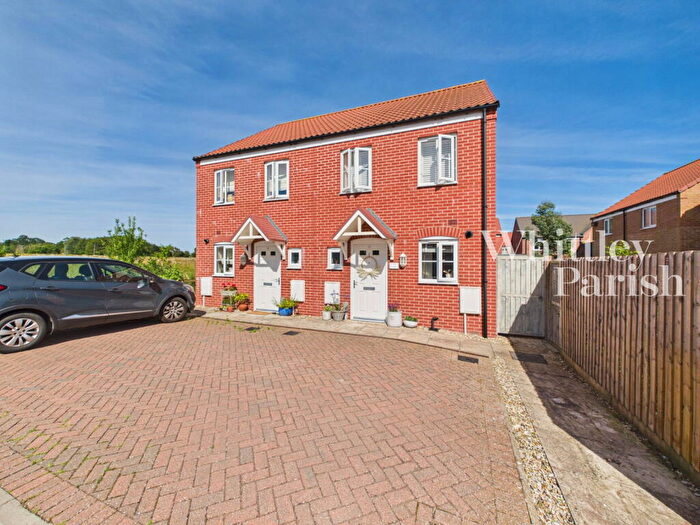
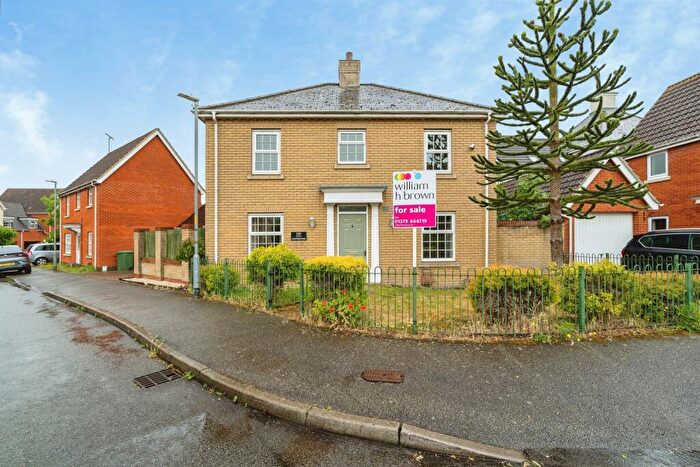
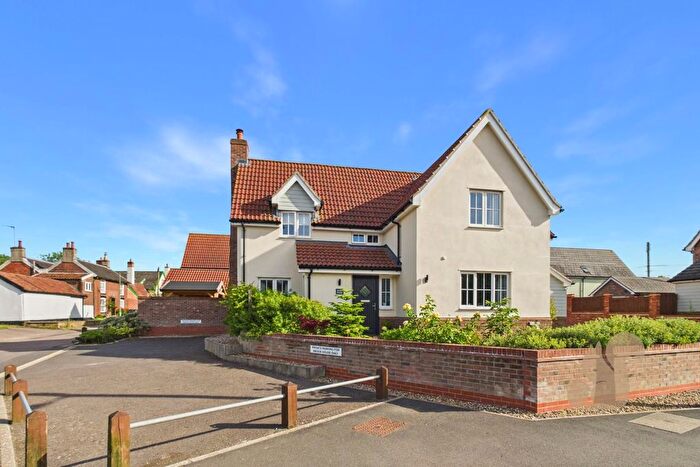
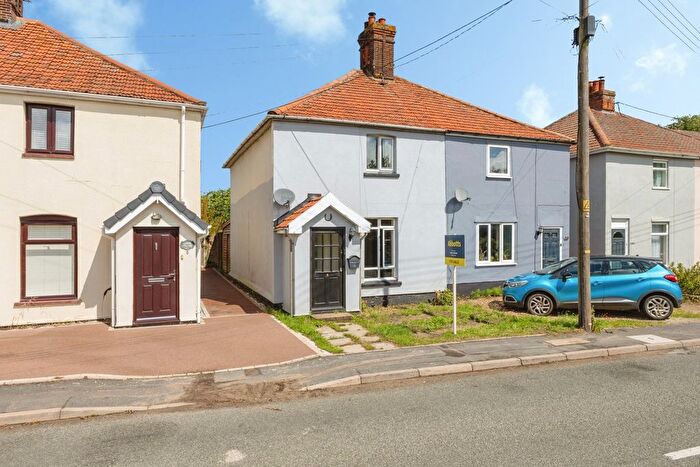
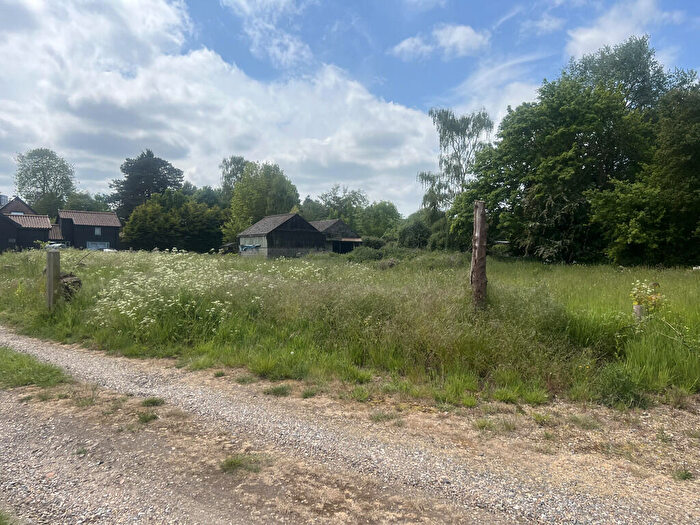
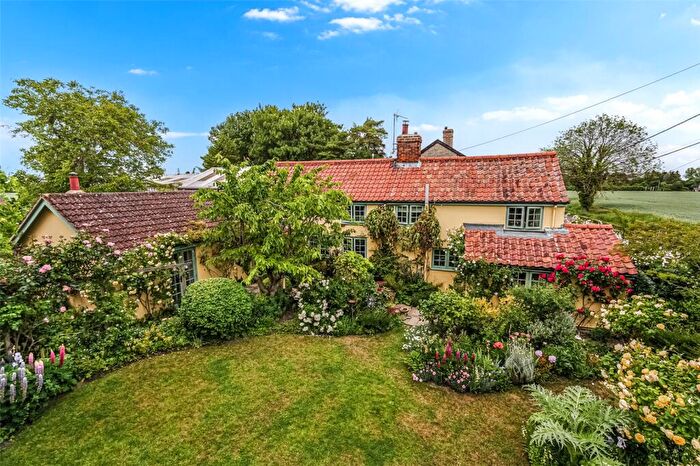
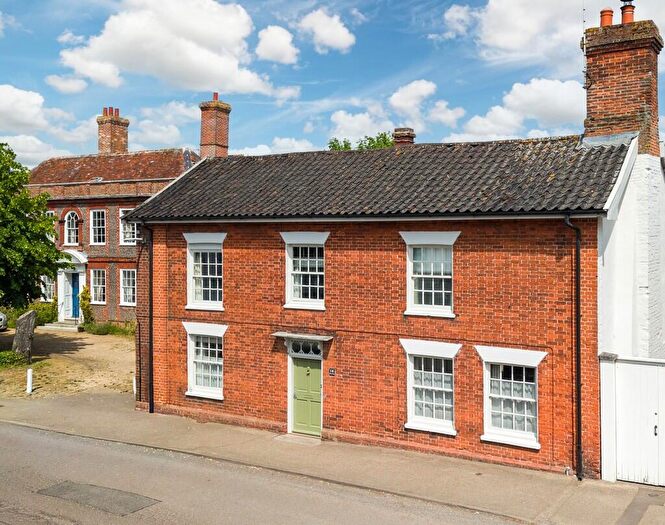
Houses for sale in Eye, Suffolk
House Prices in Eye
Properties in Eye have an average house price of £403k and had 444 Property Transactions within the last 3 years.¹
Eye is an area in Suffolk with 4,996 households², where the most expensive property was sold for £1.55M.
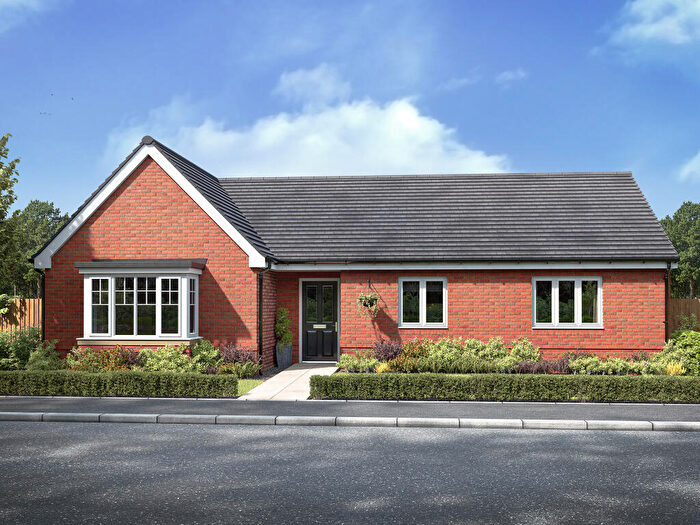
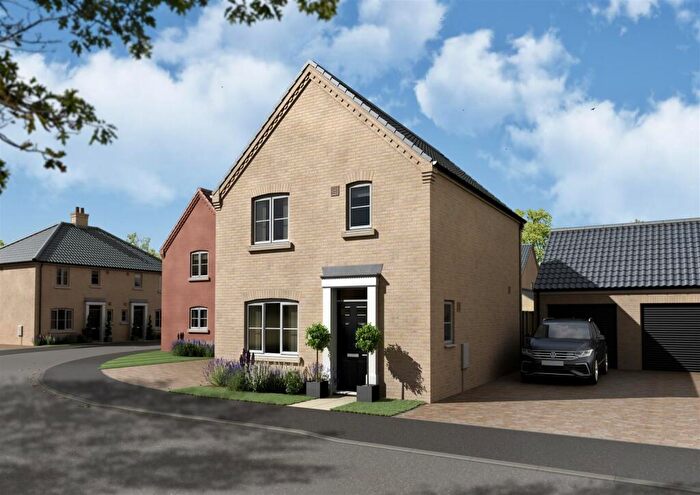
Properties for sale in Eye
![]()
If you are looking to sell your house, let it out, or receive a property valuation, an expert can help you.
Click the button below to get started.
Neighbourhoods in Eye
Navigate through our locations to find the location of your next house in Eye, Suffolk for sale or to rent.
Property price trends in Eye
According to the latest Land Registry data, the average home in Eye sold for £392,556 in 2026. That figure comes from a substantial record of 6,338 sales logged over the past 31 years.
Prices have softened over the last three years. Compared with 2023, when the typical sale came in around £415,769, that's a fall of roughly 5.6%.
Looking back five years, average prices are up about 3% since 2021, a gain of around £11,614 in cash terms.
Zoom out to the past decade for the fuller picture. Back in 2016, homes here averaged £281,679, so the typical sold price has climbed about 39.4% since then, roughly 3.4% a year. Stretch the view to fifteen years and that annual pace holds at about 3.4%.
Frequently asked questions about Eye
What is the average price for a property for sale in Eye?
The average price for a property for sale in Eye is £402,887. This amount is 26% higher than the average price in Suffolk. There are 6,166 property listings for sale in Eye.
What locations have the most expensive properties for sale in Eye?
The locations with the most expensive properties for sale in Eye are Worlingworth at an average of £499,438, Hoxne at an average of £454,507 and Gislingham at an average of £427,584.
What locations have the most affordable properties for sale in Eye?
The locations with the most affordable properties for sale in Eye are Mendlesham at an average of £342,076, Eye at an average of £346,862 and Stradbroke And Laxfield at an average of £384,129.
Which train stations are available in or near Eye?
Some of the train stations available in or near Eye are Diss, Stowmarket and Elmswell.
Property Price Paid in Eye by Year
The average sold property price by year was:
| Year | Average Sold Price | Price Change |
Sold Properties
|
|---|---|---|---|
| 2026 | £392,556 | -5% |
8 Properties |
| 2025 | £413,570 | 8% |
139 Properties |
| 2024 | £382,256 | -9% |
156 Properties |
| 2023 | £415,769 | 1% |
141 Properties |
| 2022 | £410,443 | 7% |
157 Properties |
| 2021 | £380,942 | 8% |
291 Properties |
| 2020 | £350,220 | -1% |
203 Properties |
| 2019 | £354,845 | 7% |
167 Properties |
| 2018 | £331,694 | -2% |
172 Properties |
| 2017 | £337,754 | 17% |
174 Properties |
Property Price per Property Type in Eye
Here you can find historic sold price data in order to help with your property search.
The average Property Paid Price for specific property types in the last three years are:
| Property Type | Average Sold Price | Sold Properties |
|---|---|---|
| Semi Detached House | £281,478.00 | 96 Semi Detached Houses |
| Detached House | £489,661.00 | 269 Detached Houses |
| Terraced House | £261,358.00 | 72 Terraced Houses |
| Flat | £189,071.00 | 7 Flats |
Transport in Eye
Please see below transportation links in this area:
