
Houses for sale in Hoxne, Eye
House Prices in Hoxne
Properties in Hoxne have an average house price of £455k and had 59 Property Transactions within the last 3 years¹.
Hoxne is an area in Eye, Suffolk with 661 households², where the most expensive property was sold for £1.26M.
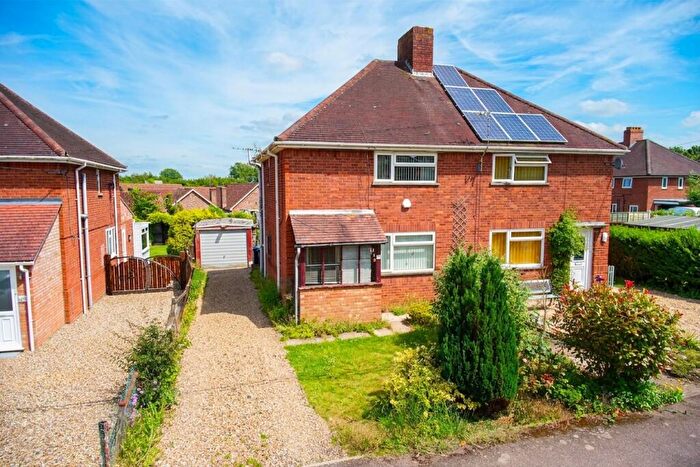
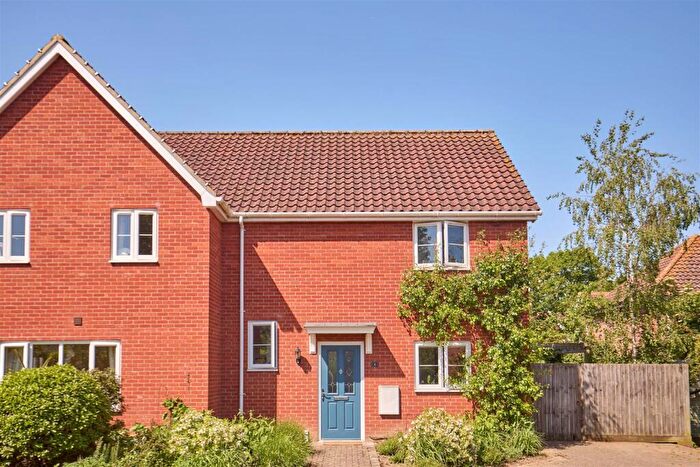
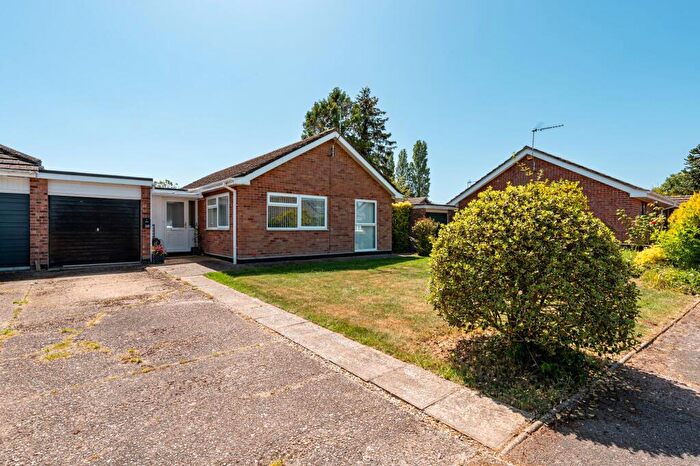
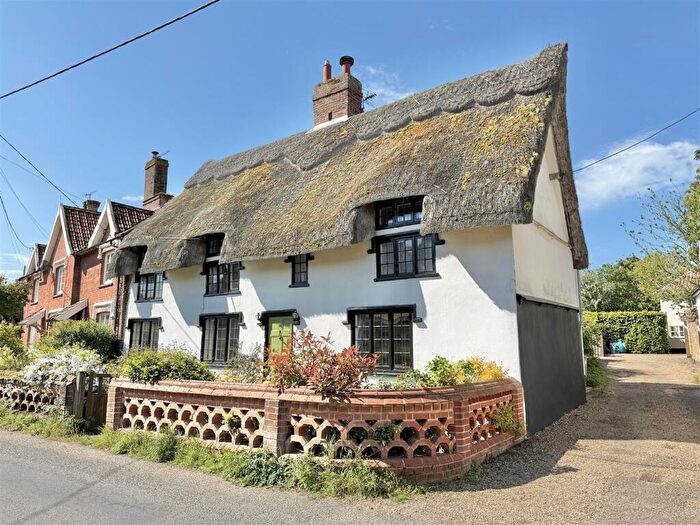
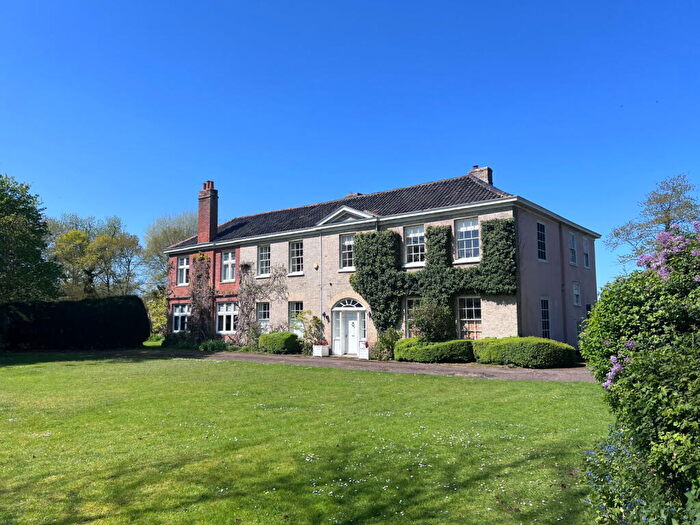
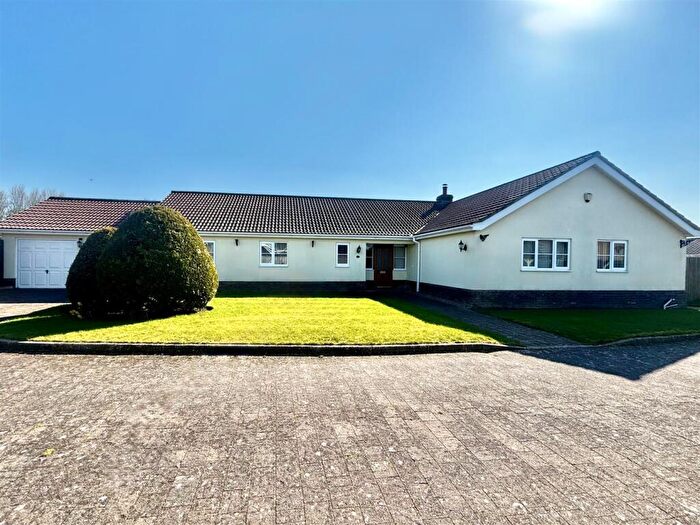
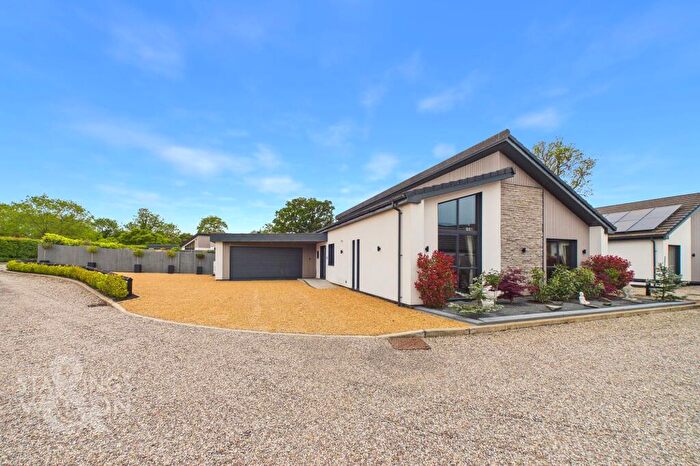
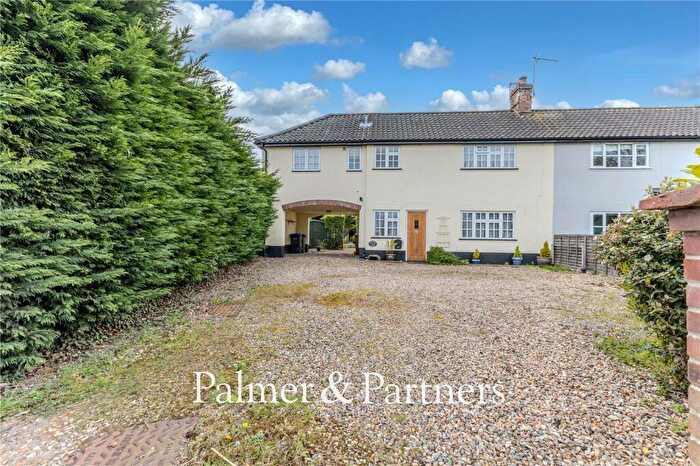
Properties for sale in Hoxne
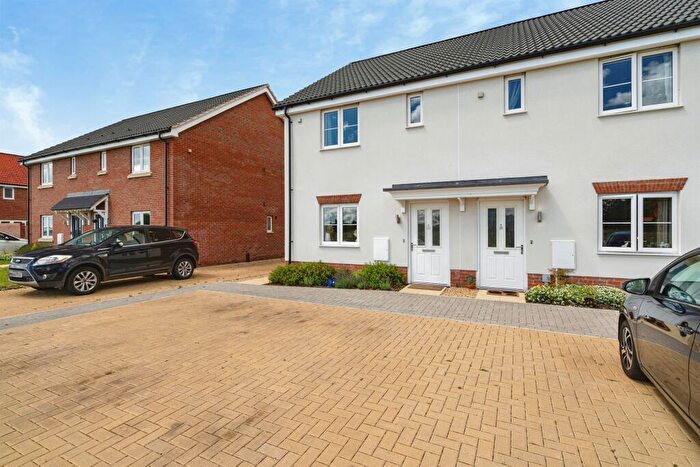
![]()
If you are looking to sell your house, let it out, or receive a property valuation, an expert can help you.
Click the button below to get started.
Roads and Postcodes in Hoxne
Navigate through our locations to find the location of your next house in Hoxne, Eye for sale or to rent.
| Streets | Postcodes |
|---|---|
| Abbey Hill | IP21 5AL |
| Abbotts Meadow | IP23 7EQ |
| Athelington Road | IP21 5EG IP21 5EH |
| Chapel Lane | IP21 5ES |
| Chickering Road | IP21 5BX IP21 5BT |
| Church Close | IP21 5BE |
| Church Farm Close | IP21 5EW |
| Church Hill | IP21 5AT |
| Church Road | IP21 5DE |
| Coldham Hill | IP21 5DG |
| Cross Street | IP21 5AH IP21 5AJ |
| Denham Corner | IP21 5DR |
| Denham Road | IP21 5DB |
| Evelyn Close | IP21 5BJ |
| Eye Road | IP21 5AP IP21 5BA |
| Goldbrook | IP21 5AN |
| Green Lane | IP23 7QT |
| Green Street | IP21 5AX IP21 5AZ |
| Heckfield Green | IP21 5AA IP21 5AB IP21 5AD IP21 5AF |
| Horham Road | IP21 5EJ |
| Hoxne Road | IP21 4LN IP21 4LR IP21 5DF IP21 5DN |
| Low Road | IP21 5ET |
| Low Street | IP21 5AR IP21 5AS |
| Manor Park | IP21 5EE |
| Mill Road | IP23 7QU |
| Nuttery Vale | IP21 5BB IP21 5BD |
| Old Water Mill | IP21 4LQ |
| Reading Green | IP21 5DJ |
| Red Lion Close | IP21 5AW |
| Redlingfield Road | IP21 5ED |
| Shingle Hill | IP21 5EU |
| South Green | IP23 7NW |
| Southolt Road | IP21 5EL |
| Stradbroke Road | IP21 4LZ |
| The Grove | IP21 4LL |
| The Knoll | IP23 7QR |
| The Street | IP21 5DX IP21 5DY IP21 5EX |
| Tudor Close | IP21 5BF |
| Watering Road | IP21 5DH IP21 5DL |
| Weybread Road | IP21 4LW |
| Wingfield Road | IP21 4LU |
| Wittons Lane | IP21 5AE |
| Worlingworth Road | IP21 5EF IP21 5EP |
| IP21 4LP IP21 4LT IP21 5AU IP21 5ER IP23 7QS |
Property price trends in Hoxne
According to the latest Land Registry data, the average home in Hoxne sold for £340,000 in 2026. That figure comes from 825 sales logged over the past 31 years.
Prices have fallen back over the last three years. Compared with 2023, when the typical sale came in around £503,773, that's a fall of roughly 32.5%.
Looking back five years, average prices are down about 30.2% since 2021, a drop of around £147,354 in cash terms.
Zoom out to the past decade for the fuller picture. Back in 2016, homes here averaged £290,045, so the typical sold price has climbed about 17.2% since then, roughly 1.6% a year. Stretch the view to fifteen years and that annual pace edges up closer to 2.2%.
Frequently asked questions about Hoxne
What is the average price for a property for sale in Hoxne?
The average price for a property for sale in Hoxne is £454,507. This amount is 13% higher than the average price in Eye. There are 507 property listings for sale in Hoxne.
What streets have the most expensive properties for sale in Hoxne?
The streets with the most expensive properties for sale in Hoxne are Green Street at an average of £761,666, Athelington Road at an average of £755,000 and Worlingworth Road at an average of £720,000.
What streets have the most affordable properties for sale in Hoxne?
The streets with the most affordable properties for sale in Hoxne are Low Street at an average of £219,166, The Knoll at an average of £231,000 and Watering Road at an average of £250,000.
Which train stations are available in or near Hoxne?
Some of the train stations available in or near Hoxne are Diss, Halesworth and Stowmarket.
Property Price Paid in Hoxne by Year
The average sold property price by year was:
| Year | Average Sold Price | Price Change |
Sold Properties
|
|---|---|---|---|
| 2026 | £340,000 | -22% |
1 Property |
| 2025 | £413,354 | -12% |
24 Properties |
| 2024 | £462,857 | -9% |
14 Properties |
| 2023 | £503,773 | 15% |
20 Properties |
| 2022 | £430,118 | -13% |
22 Properties |
| 2021 | £487,354 | 23% |
31 Properties |
| 2020 | £377,456 | -11% |
29 Properties |
| 2019 | £417,500 | 7% |
16 Properties |
| 2018 | £389,489 | 32% |
27 Properties |
| 2017 | £265,883 | -9% |
15 Properties |
Property Price per Property Type in Hoxne
Here you can find historic sold price data in order to help with your property search.
The average Property Paid Price for specific property types in the last three years are:
| Property Type | Average Sold Price | Sold Properties |
|---|---|---|
| Semi Detached House | £291,625.00 | 12 Semi Detached Houses |
| Detached House | £544,191.00 | 39 Detached Houses |
| Terraced House | £261,625.00 | 8 Terraced Houses |
