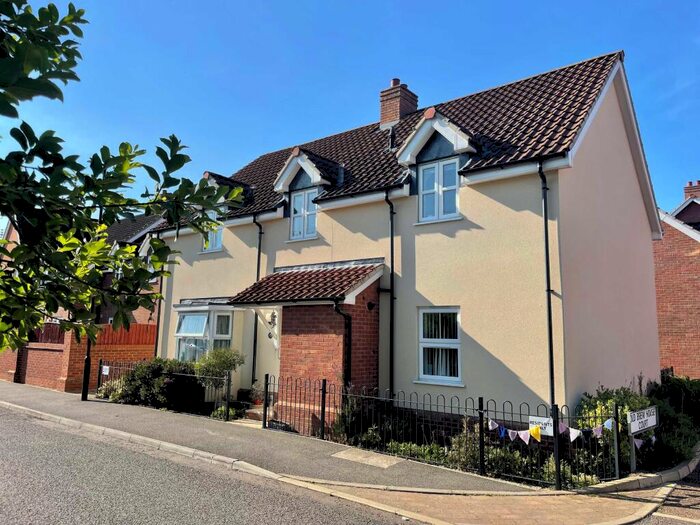
Houses for sale & to rent in Eye, Eye
House Prices in Eye
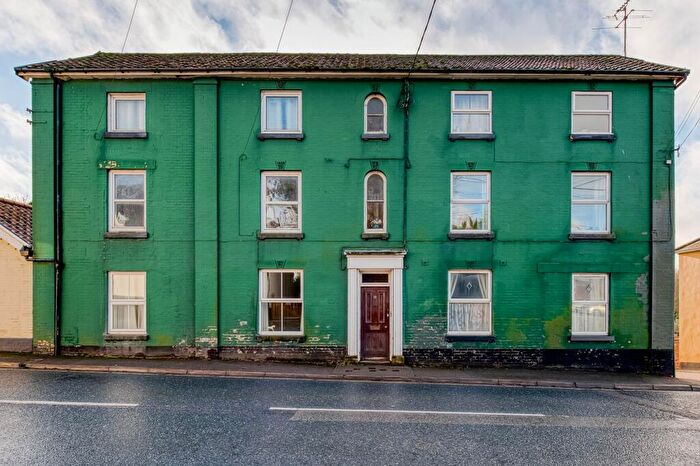
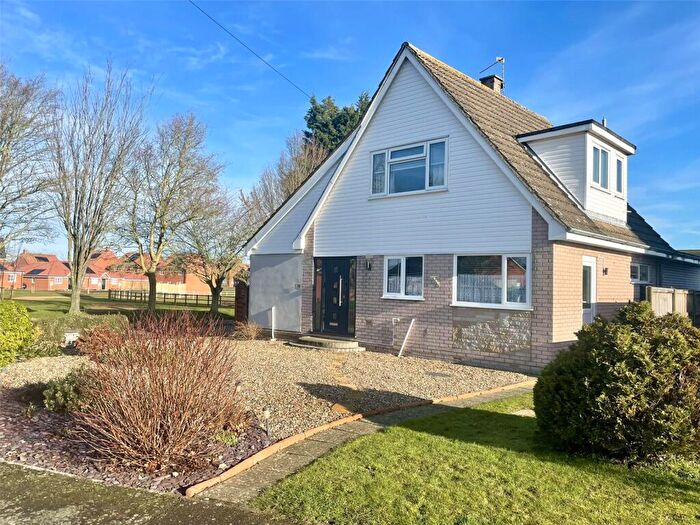
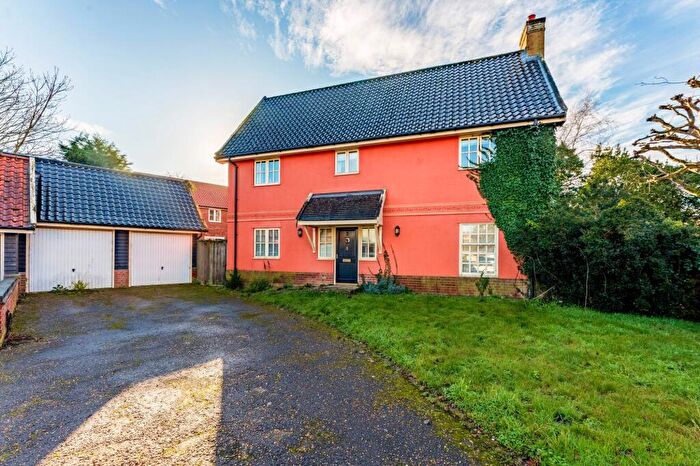
Properties in Eye have an average house price of £352,589.00 and had 101 Property Transactions within the last 3 years¹.
Eye is an area in Eye, Suffolk with 986 households², where the most expensive property was sold for £907,500.00.
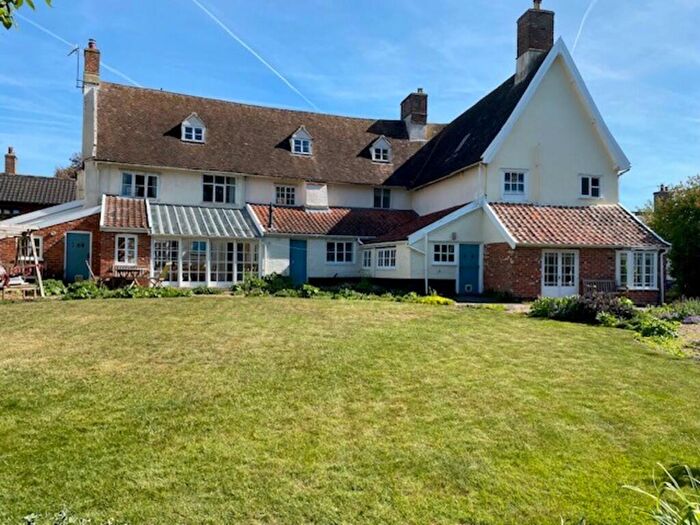
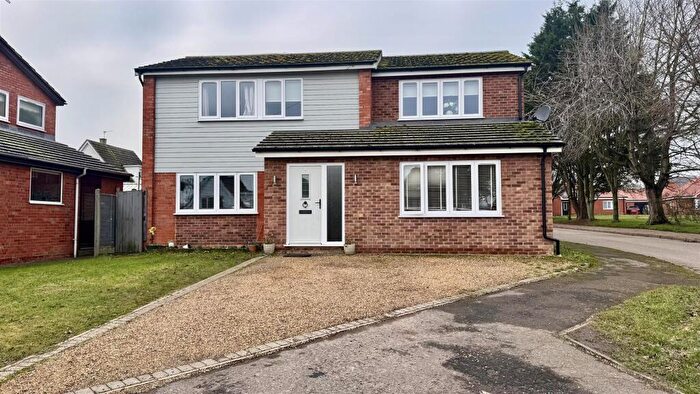
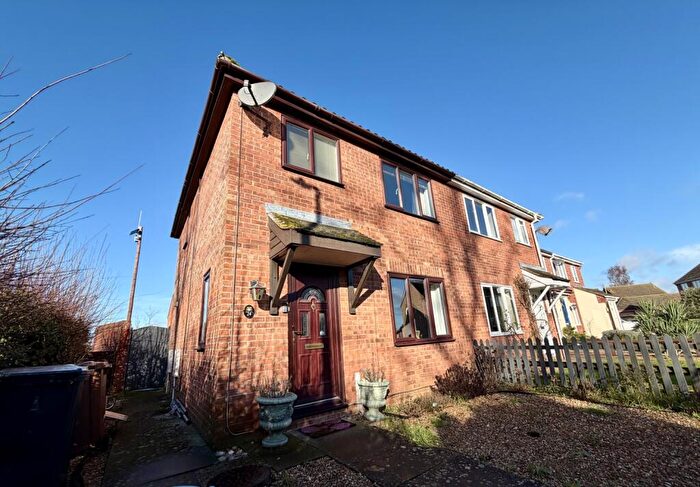
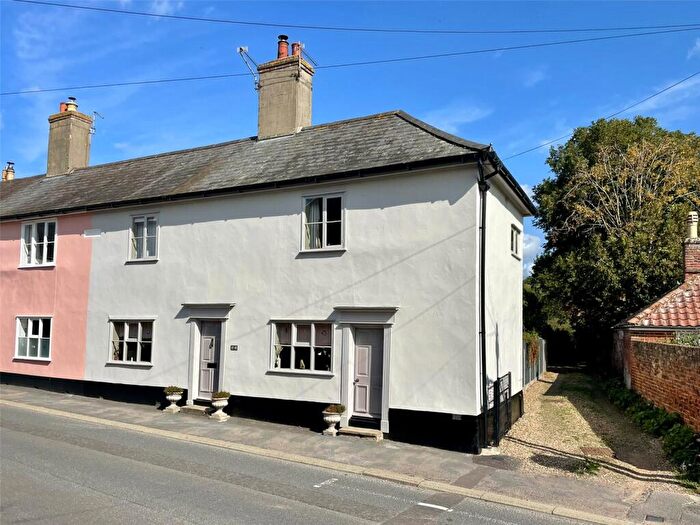
Properties for sale in Eye
Roads and Postcodes in Eye
Navigate through our locations to find the location of your next house in Eye, Eye for sale or to rent.
| Streets | Postcodes |
|---|---|
| Airfield Industrial Park Airfield Industrial Estate | IP23 7HS |
| Ash Drive | IP23 7DA IP23 7DB |
| Ashton Road | IP23 7LF |
| Baldwin Way | IP23 7DG |
| Bellands Way | IP23 7BT |
| Benningham Green | IP23 7PF |
| Bothy Close | IP23 7FA |
| Braiseworth Road | IP23 7DR |
| Broad Street | IP23 7AF |
| Brome Avenue | IP23 7HW |
| Buckshorn Lane | IP23 7AZ |
| Castle Hill | IP23 7AP |
| Castle Street | IP23 7AN IP23 7AW |
| Castleton Way | IP23 7BJ IP23 7BL IP23 7DD IP23 7BH |
| Century Road | IP23 7LE |
| Church Street | IP23 7BB IP23 7BD |
| Clint Road | IP23 7JD |
| Cock Road | IP23 7NS IP23 7NR |
| Cocks Road | IP23 7NT |
| Copper Close | IP23 7HQ |
| Cranley Green | IP23 7NX |
| Cranley Road | IP23 7HY IP23 7HZ IP23 7PA IP23 7JE IP23 7NZ |
| Cross Street | IP23 7AB |
| Daniel Gardens | IP23 7BQ |
| Dove Lane | IP23 7BA |
| Elizabeth Court | IP23 7HP |
| Elizabeth Way | IP23 7HR |
| Gaye Crescent | IP23 7BW |
| Haygate | IP23 7BN |
| Hayward Close | IP23 7AE |
| Highfield | IP23 7BP |
| Hoxne Road | IP23 7NJ IP23 7NL IP23 7NP |
| Hutton Court | IP23 7HF |
| Ipswich Road | IP23 8AW IP23 8AX |
| Jervis Close | IP23 7FD |
| Lambseth Street | IP23 7AG IP23 7AQ |
| Langton Green | IP23 7HL |
| Langton Grove | IP23 7BF |
| Langton Park | IP23 7LZ |
| Linden Court | IP23 7DU |
| Lowgate Street | IP23 7AS IP23 7AT IP23 7HX |
| Ludgate Causeway | IP23 7NH |
| Magdalen Court | IP23 7DJ |
| Magdalen Street | IP23 7AJ |
| Maple Way | IP23 7BS |
| Millfield | IP23 7DE |
| Nelson Gardens | IP23 7FH |
| Oak Crescent | IP23 7BY |
| Oaksmere Business Park | IP23 8BW |
| Old Brew House Court | IP23 7BU |
| Orchard Close | IP23 7DW |
| Park Lane | IP23 7JA |
| Pine Close | IP23 7BZ |
| Posting House Court | IP23 7AY |
| Potash Lane | IP23 7HE |
| Progress Way | IP23 7HU |
| Rookery Lane | IP23 7QP |
| Stanway Cottages | IP23 7PE |
| Tacon Close | IP23 7AU |
| The Appletrees | IP23 7DY |
| The Rookery | IP23 7AR |
| Town Farm Cottages | IP23 7NU |
| Tuffs Road | IP23 7LY |
| Victoria Hill | IP23 7BX IP23 7HH IP23 7HJ |
| Wellington Road | IP23 7BE IP23 7BG |
| Woodlane Road | IP23 7QY |
| Yaxley Road | IP23 7DP IP23 7DN IP23 7HG |
Transport near Eye
-
Diss Station
-
Stowmarket Station
-
Elmswell Station
-
Needham Market Station
-
Eccles Road Station
-
Harling Road Station
-
Attleborough Station
- FAQ
- Price Paid By Year
- Property Type Price
Frequently asked questions about Eye
What is the average price for a property for sale in Eye?
The average price for a property for sale in Eye is £352,589. This amount is 13% lower than the average price in Eye. There are 1,004 property listings for sale in Eye.
What streets have the most expensive properties for sale in Eye?
The streets with the most expensive properties for sale in Eye are Ludgate Causeway at an average of £907,500, Langton Park at an average of £825,000 and Hoxne Road at an average of £800,000.
What streets have the most affordable properties for sale in Eye?
The streets with the most affordable properties for sale in Eye are Elizabeth Way at an average of £195,000, Oak Crescent at an average of £200,833 and Buckshorn Lane at an average of £210,000.
Which train stations are available in or near Eye?
Some of the train stations available in or near Eye are Diss, Stowmarket and Elmswell.
Property Price Paid in Eye by Year
The average sold property price by year was:
| Year | Average Sold Price | Price Change |
Sold Properties
|
|---|---|---|---|
| 2025 | £390,538 | 13% |
25 Properties |
| 2024 | £341,228 | 1% |
42 Properties |
| 2023 | £338,720 | -6% |
34 Properties |
| 2022 | £357,753 | 18% |
27 Properties |
| 2021 | £292,529 | -3% |
59 Properties |
| 2020 | £300,690 | -1% |
42 Properties |
| 2019 | £304,862 | 19% |
29 Properties |
| 2018 | £246,101 | -15% |
40 Properties |
| 2017 | £281,950 | 18% |
40 Properties |
| 2016 | £230,953 | 1% |
53 Properties |
| 2015 | £228,603 | 5% |
60 Properties |
| 2014 | £216,083 | -6% |
47 Properties |
| 2013 | £229,699 | 11% |
35 Properties |
| 2012 | £205,072 | -10% |
36 Properties |
| 2011 | £224,907 | -21% |
42 Properties |
| 2010 | £271,213 | 11% |
38 Properties |
| 2009 | £240,973 | 2% |
30 Properties |
| 2008 | £236,947 | 10% |
23 Properties |
| 2007 | £212,461 | 1% |
75 Properties |
| 2006 | £210,806 | 7% |
64 Properties |
| 2005 | £195,324 | 12% |
37 Properties |
| 2004 | £172,861 | -1% |
58 Properties |
| 2003 | £175,186 | 22% |
43 Properties |
| 2002 | £136,304 | 16% |
76 Properties |
| 2001 | £114,020 | 8% |
76 Properties |
| 2000 | £104,601 | 37% |
61 Properties |
| 1999 | £65,758 | -9% |
53 Properties |
| 1998 | £71,926 | 7% |
50 Properties |
| 1997 | £66,532 | 21% |
50 Properties |
| 1996 | £52,229 | -5% |
39 Properties |
| 1995 | £54,841 | - |
28 Properties |
Property Price per Property Type in Eye
Here you can find historic sold price data in order to help with your property search.
The average Property Paid Price for specific property types in the last three years are:
| Property Type | Average Sold Price | Sold Properties |
|---|---|---|
| Semi Detached House | £273,823.00 | 17 Semi Detached Houses |
| Detached House | £430,121.00 | 54 Detached Houses |
| Terraced House | £270,703.00 | 27 Terraced Houses |
| Flat | £140,333.00 | 3 Flats |

