
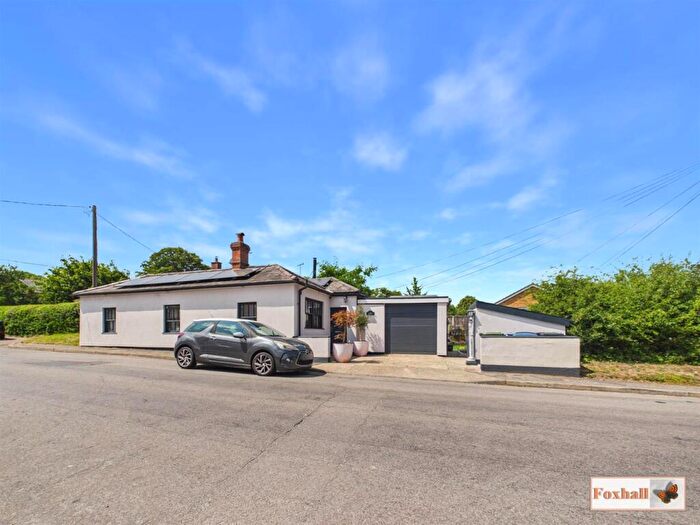
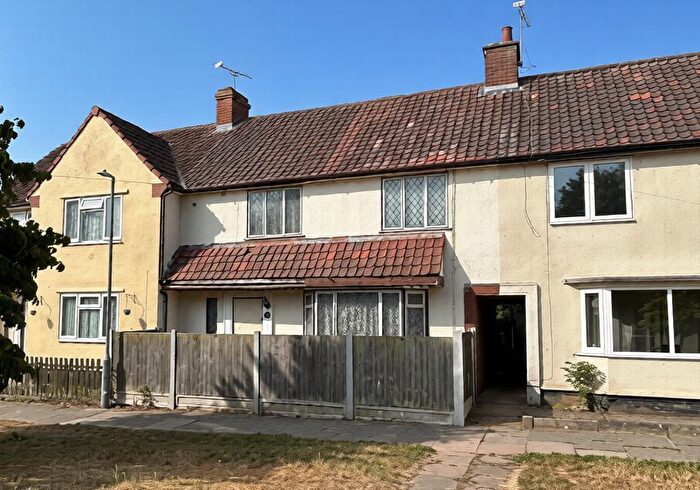
Houses for sale in Brook, Ipswich
House Prices in Brook
Properties in Brook have an average house price of £436k and had 102 Property Transactions within the last 3 years¹.
Brook is an area in Ipswich, Suffolk with 1,603 households², where the most expensive property was sold for £1.98M.
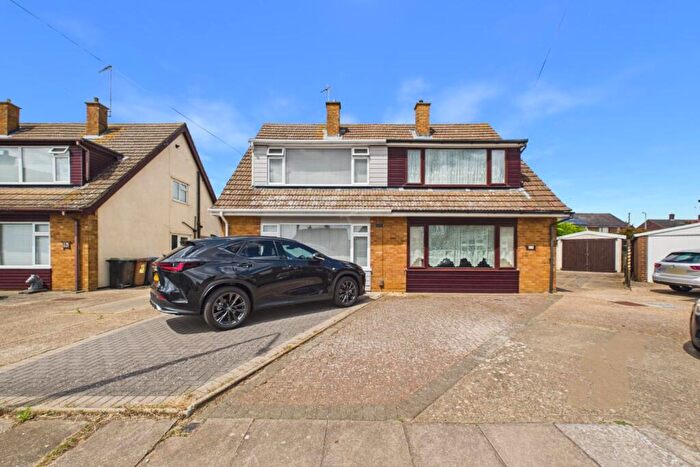
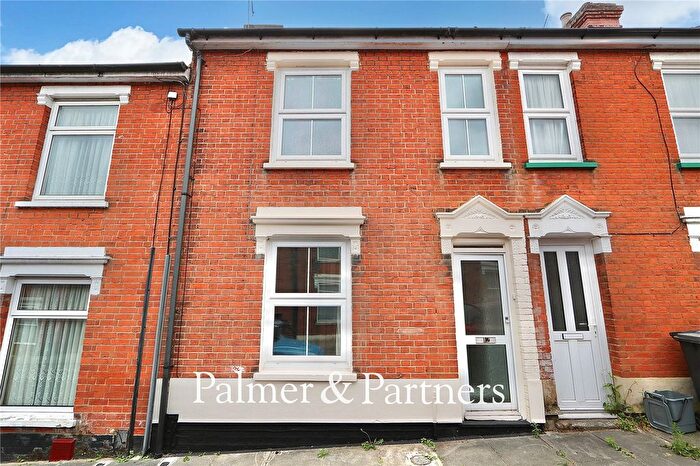
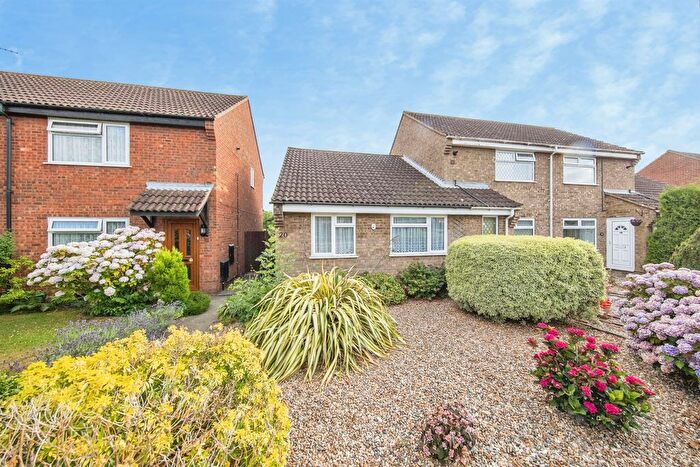
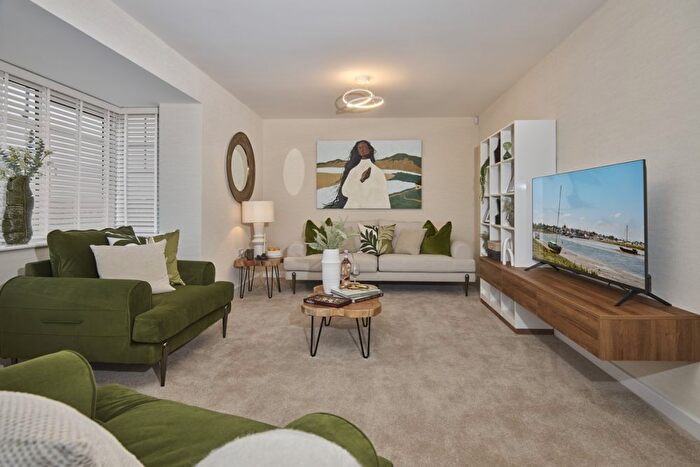
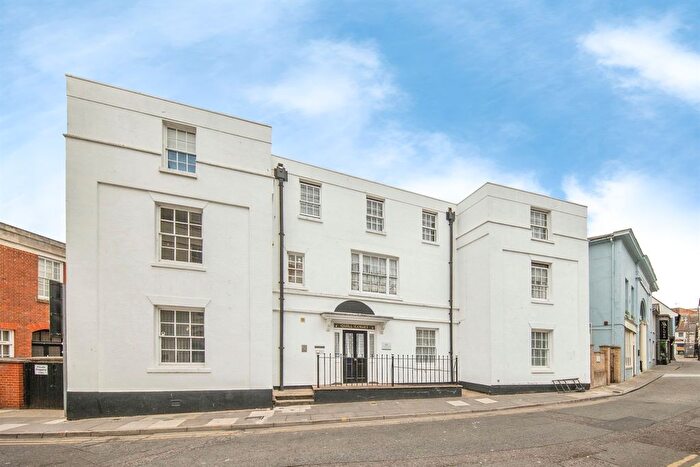
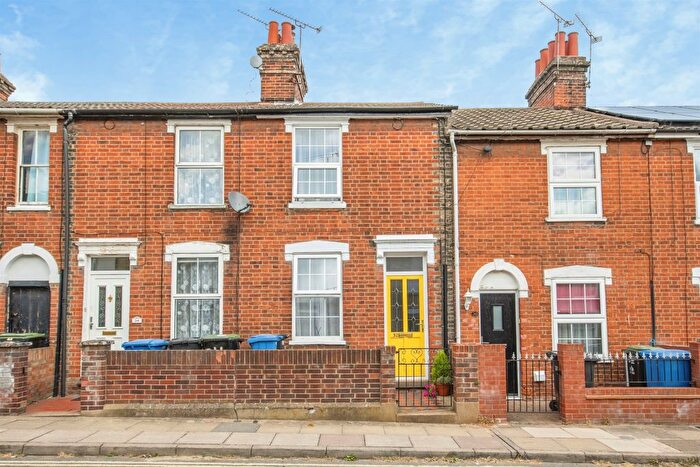
Properties for sale in Brook
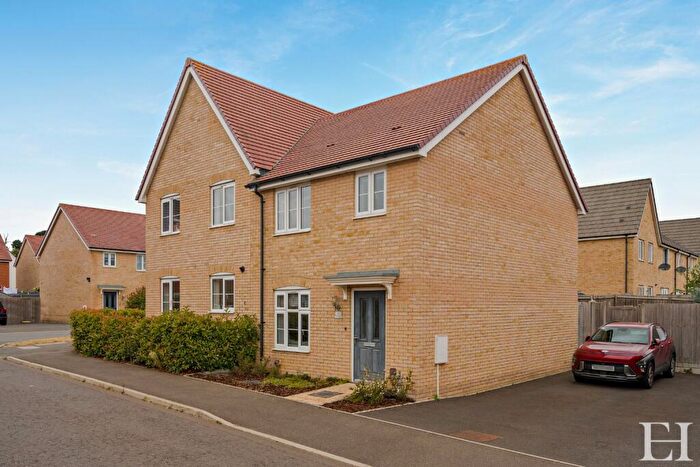
![]()
If you are looking to sell your house, let it out, or receive a property valuation, an expert can help you.
Click the button below to get started.
Roads and Postcodes in Brook
Navigate through our locations to find the location of your next house in Brook, Ipswich for sale or to rent.
| Streets | Postcodes |
|---|---|
| Back Lane | IP8 3JA IP8 3JB |
| Back Road | IP8 3PA |
| Barker Close | IP2 0DU |
| Beech Close | IP8 3BL |
| Bentley Lane | IP8 3LX |
| Bourne Hill | IP2 8ND IP2 8NQ |
| Bourne Terrace | IP2 8NG |
| Broomfield Common | IP8 3BG |
| Burstall Hall Cottages | IP8 3DW |
| Burstall Hill | IP8 3ED |
| Burstall Lane | IP8 3DB IP8 3DH IP8 3DJ |
| Burstall Road | IP8 3EE IP8 3EF |
| California Lane | IP8 3QJ |
| Chantry Mews | IP2 0AZ |
| Chapel Lane | IP8 3LH IP8 3LR |
| Charlottes | IP8 3HZ |
| Chattisham Lane | IP8 3PU |
| Chattisham Road | IP8 3HB IP8 3HD |
| Cherry Ground Cottage | IP8 3NN |
| Cherry Wood | IP8 3SN |
| Church Cottage | IP8 3DS |
| Church Cottages | IP8 3PZ |
| Church Crescent | IP8 3BJ |
| Church Hill | IP8 3DU |
| Church Lane | IP8 3AX IP8 3AY IP8 3AZ IP8 3BA IP8 3HF IP8 3JZ |
| Cobblers Corner | IP8 3QW |
| College Farm Cottage | IP8 3NT |
| Collinsons | IP2 0DS |
| Covey Cottages | IP8 3NY |
| Cranfield Park | IP8 3DT |
| Dales View | IP8 3EX |
| Daundy Close | IP2 0DT |
| Duke Street | IP8 3PL IP8 3PN IP8 3PP IP8 3PR IP8 3PW IP8 3QP |
| Elm Lane | IP8 3ET |
| Elton Park Hadleigh Road | IP2 0DG |
| Farthing Road | IP1 5AP |
| Fen View | IP8 3EU |
| Folly Lane | IP8 3JQ |
| George Street | IP8 3NH IP8 3NS |
| Gipping Way | IP8 3BE |
| Glebe Close | IP8 3BQ |
| Grange Drive | IP8 3ES |
| Grove Hill | IP8 3LN IP8 3LP IP8 3LS IP8 3LU |
| Hadleigh Road | IP2 0BT IP2 0DE IP8 3AS |
| High Street | IP8 3AF IP8 3AH IP8 3AL IP8 3AQ |
| Hillside Cottage | IP8 3DY |
| Hollow Lane | IP8 3HE |
| Holly Lane | IP8 3LZ |
| Kenney Close | IP8 3ER |
| Larchwood Close | IP2 0DA |
| London Road | IP2 0SS IP8 3JH IP8 3JJ IP8 3LE |
| Lower Barn Road | IP8 3QA |
| Lower Street | IP8 3AA |
| Mill Lane | IP8 3HU |
| Nine Acres | IP2 0DL |
| Oak Grove | IP8 3EW |
| Oakfield Road | IP8 3JS |
| Old House Cottage | IP8 3PB |
| Old London Road | IP8 3JD IP8 3JF IP8 3JN IP8 3JP IP8 3JW |
| Orchard Gate | IP2 0BU |
| Orchard Lands | IP8 3DZ |
| Pannington Hall Lane | IP9 2AP |
| Pearsons Way | IP8 3LG |
| Pheasant Rise | IP8 3LF |
| Pigeons Lane | IP8 3HQ |
| Poplar Lane | IP8 3HL |
| Priory Road | IP8 3NX |
| Ransome Close | IP8 3DG |
| Raydon Road | IP8 3QH |
| Red House Cottages | IP8 3AU |
| Redgate Lane | IP9 2AD |
| School Hill | IP8 3HY |
| Silver Hill | IP8 3NJ |
| Sproughton Corner | IP8 3DL |
| Sproughton Court | IP8 3AJ |
| Stella Maris | IP2 0DF |
| The Avenue | IP8 3JR |
| The Strand | IP2 8NJ IP2 8NL |
| The Street | IP8 3DN IP8 3HR IP8 3HS IP8 3HT IP8 3HX IP8 3LY IP8 3QE IP8 3QF IP8 3QG IP9 2AH |
| Thorpes Hill | IP8 3NL |
| Timperleys | IP8 3PS |
| Valley Farm Drive | IP8 3EL |
| Valley Lane | IP9 2AZ |
| Ventris Close | IP2 0DB |
| Vicarage Lane | IP9 2AE |
| Wenham Road | IP8 3EY IP8 3EZ IP8 3HA |
| West View Abbey Oaks | IP8 3DF |
| Whights Corner | IP8 3LB |
| Wilderness Hill | IP8 3PG |
| Woodward Close | IP2 0EA |
| IP8 3AB IP8 3AD IP8 3AE IP8 3DP IP8 3EQ IP8 3JY IP8 3NW IP8 3PT IP8 3PX IP8 3PY IP8 3QD IP8 3QN IP8 3QQ IP9 2AF IP9 2AR |
Property price trends in Brook
According to the latest Land Registry data, the average home in Brook sold for £249,000 in 2026. That figure comes from 1,781 sales logged over the past 31 years.
Prices have fallen back over the last three years. Compared with 2023, when the typical sale came in around £454,706, that's a fall of roughly 45.2%.
Looking back five years, average prices are down about 40.1% since 2021, a drop of around £166,664 in cash terms.
Zoom out to the past decade for the fuller picture. Back in 2016, homes here averaged £328,550, so the typical sold price has fallen about 24.2% since then, around 2.7% a year lower. Stretch the view to fifteen years and that annual pace edges up closer to -1.1%.
Frequently asked questions about Brook
What is the average price for a property for sale in Brook?
The average price for a property for sale in Brook is £436,332. This amount is 51% higher than the average price in Ipswich. There are 8,054 property listings for sale in Brook.
What streets have the most expensive properties for sale in Brook?
The streets with the most expensive properties for sale in Brook are Cranfield Park at an average of £1,350,000, Church Lane at an average of £1,008,000 and Priory Road at an average of £832,500.
What streets have the most affordable properties for sale in Brook?
The streets with the most affordable properties for sale in Brook are Sproughton Court at an average of £144,200, High Street at an average of £194,300 and Gipping Way at an average of £207,000.
Which train stations are available in or near Brook?
Some of the train stations available in or near Brook are Ipswich, Derby Road and Westerfield.
Property Price Paid in Brook by Year
The average sold property price by year was:
| Year | Average Sold Price | Price Change |
Sold Properties
|
|---|---|---|---|
| 2026 | £249,000 | -74% |
5 Properties |
| 2025 | £432,800 | -5% |
40 Properties |
| 2024 | £455,801 | 0,2% |
28 Properties |
| 2023 | £454,706 | 3% |
29 Properties |
| 2022 | £442,193 | 6% |
58 Properties |
| 2021 | £415,664 | 0,2% |
70 Properties |
| 2020 | £414,995 | 12% |
53 Properties |
| 2019 | £364,006 | -18% |
77 Properties |
| 2018 | £430,181 | 19% |
30 Properties |
| 2017 | £347,567 | 5% |
58 Properties |
Property Price per Property Type in Brook
Here you can find historic sold price data in order to help with your property search.
The average Property Paid Price for specific property types in the last three years are:
| Property Type | Average Sold Price | Sold Properties |
|---|---|---|
| Semi Detached House | £299,351.00 | 34 Semi Detached Houses |
| Detached House | £590,198.00 | 53 Detached Houses |
| Terraced House | £239,111.00 | 9 Terraced Houses |
| Flat | £149,250.00 | 6 Flats |
