Houses for sale & to rent in Pinewood, Ipswich
House Prices in Pinewood
Properties in Pinewood have an average house price of £259,214.00 and had 177 Property Transactions within the last 3 years¹.
Pinewood is an area in Ipswich, Suffolk with 1,659 households², where the most expensive property was sold for £540,000.00.
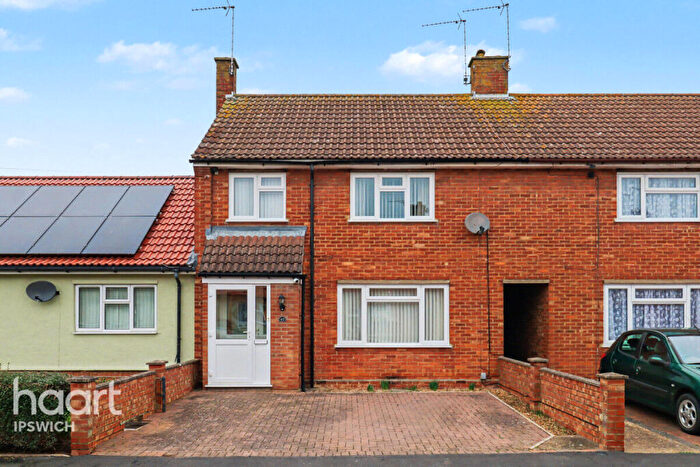
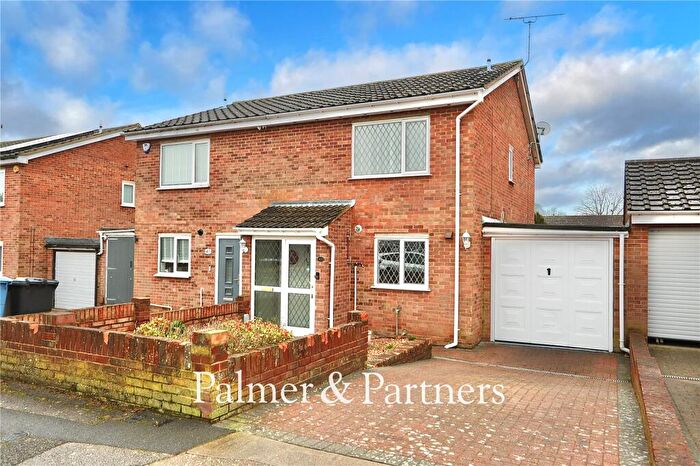
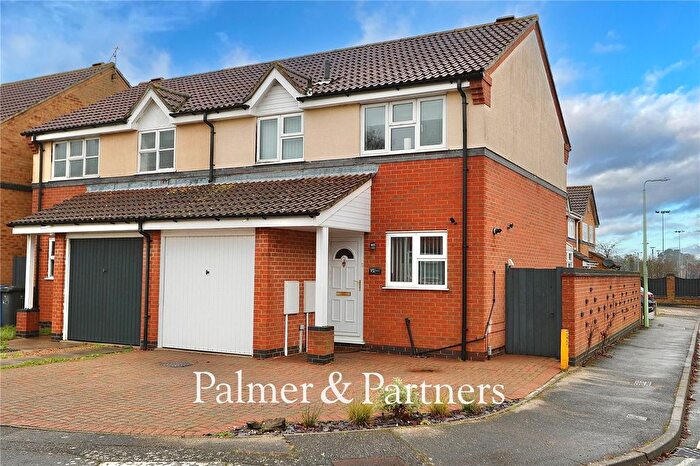
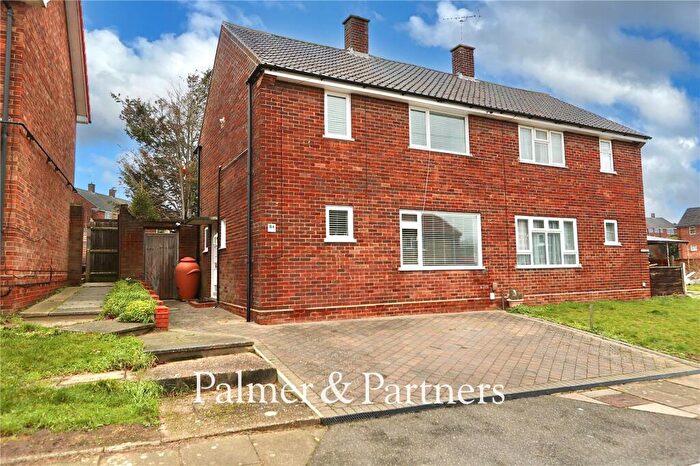
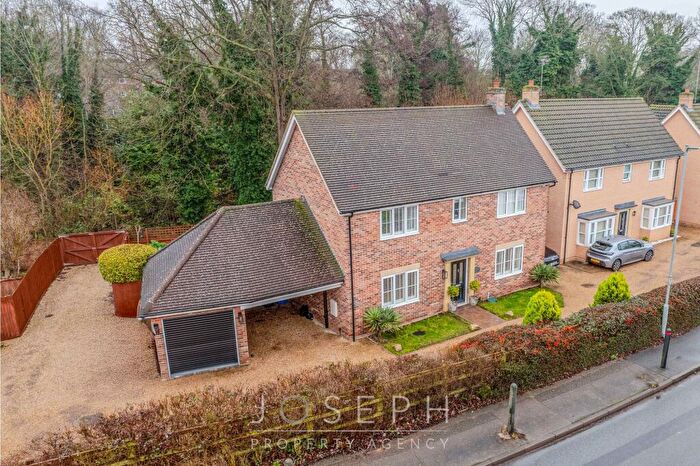
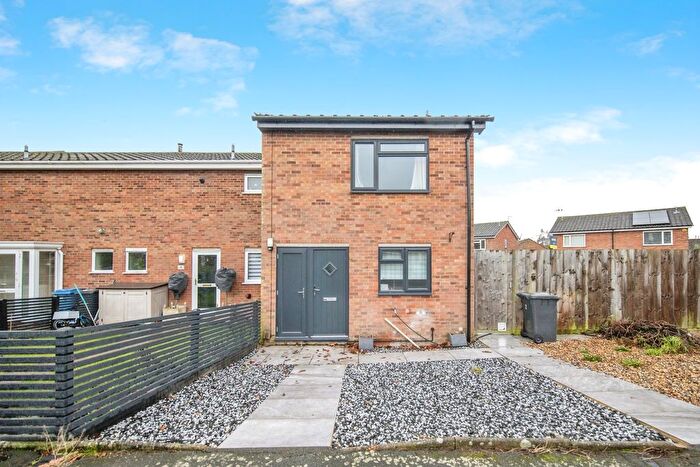
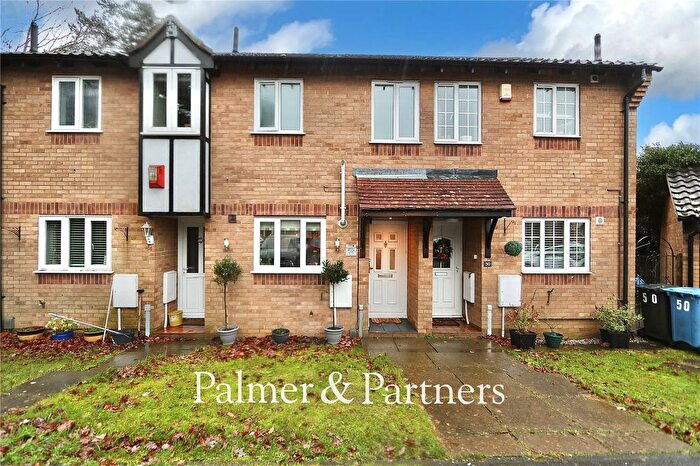
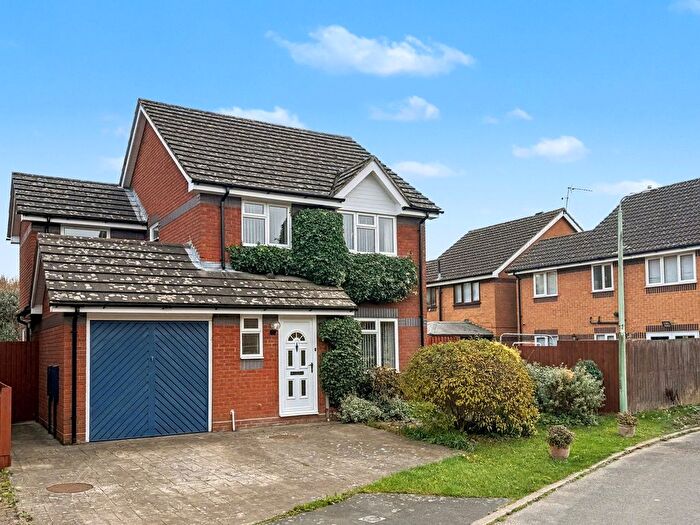
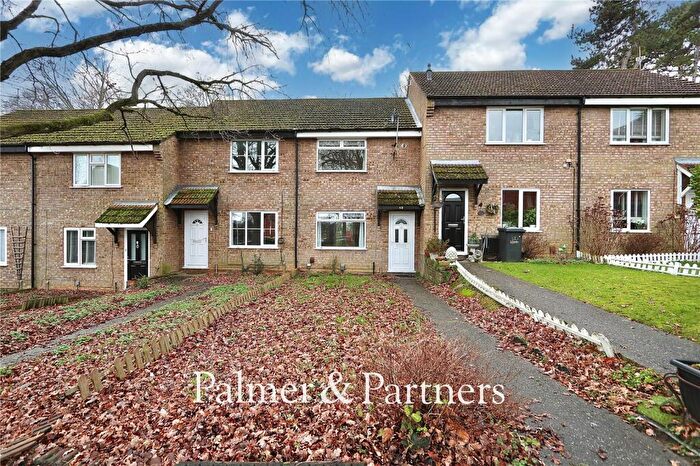
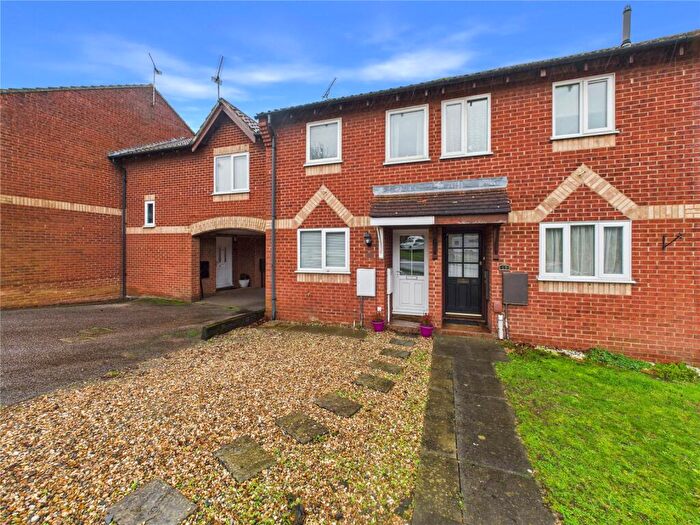
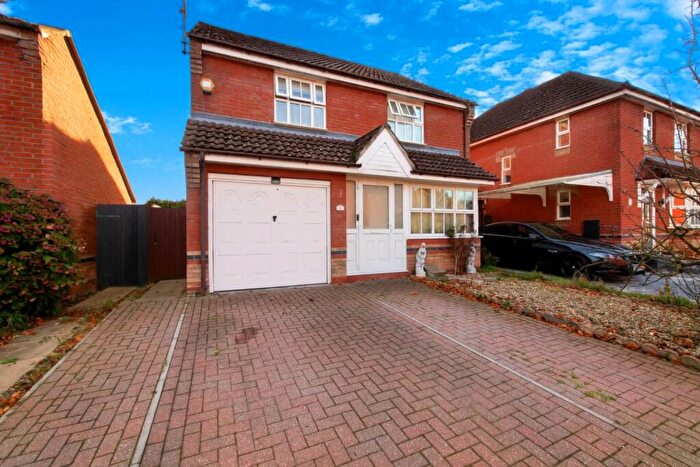
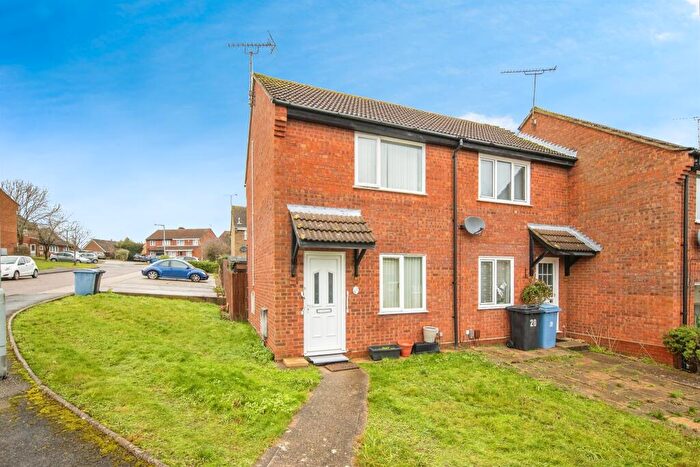
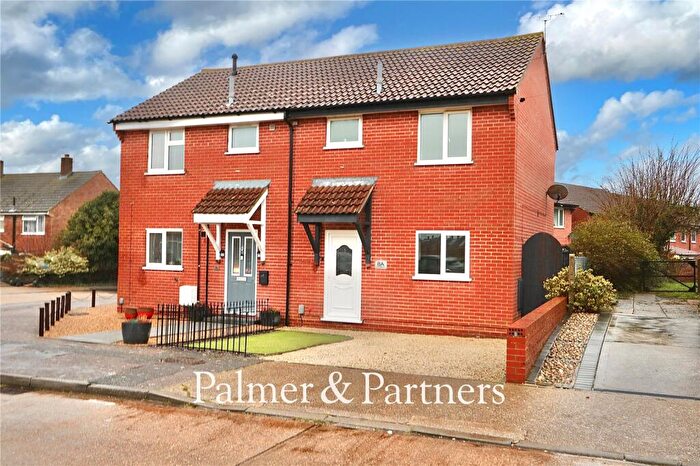
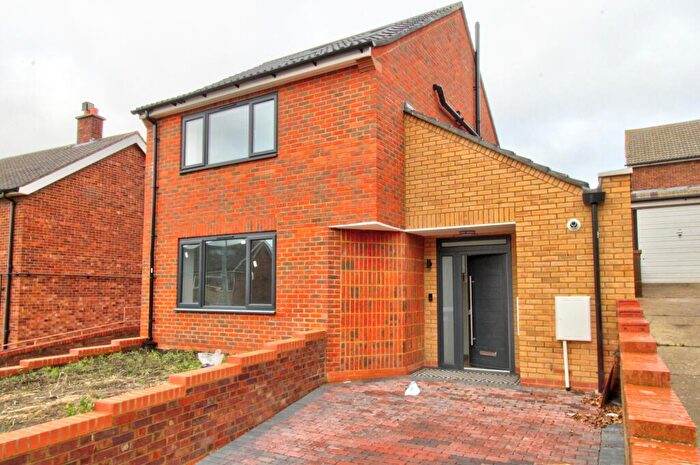
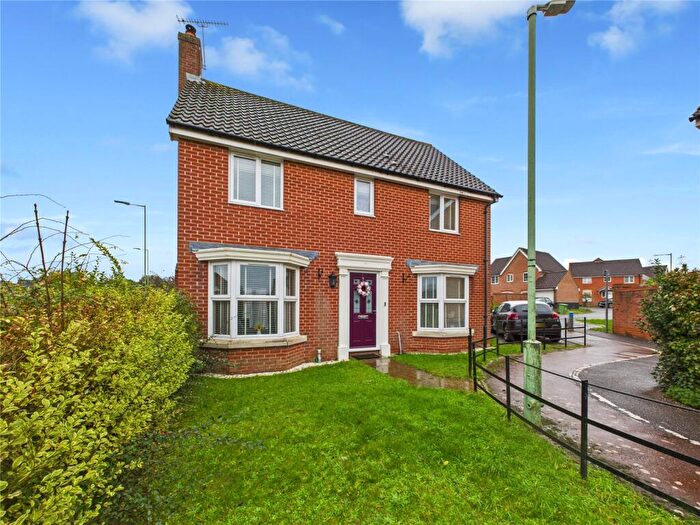
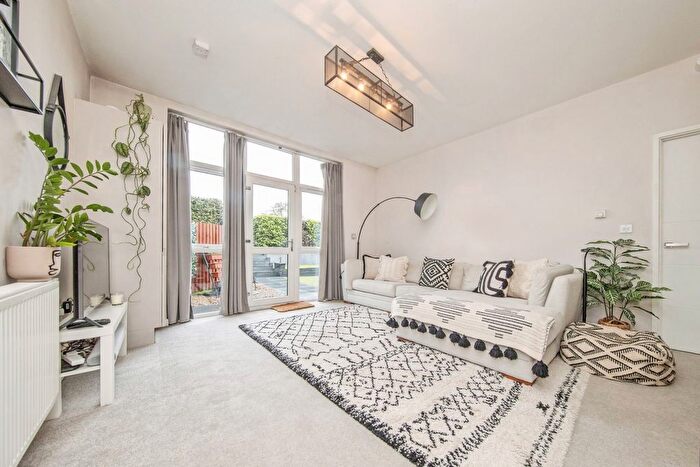
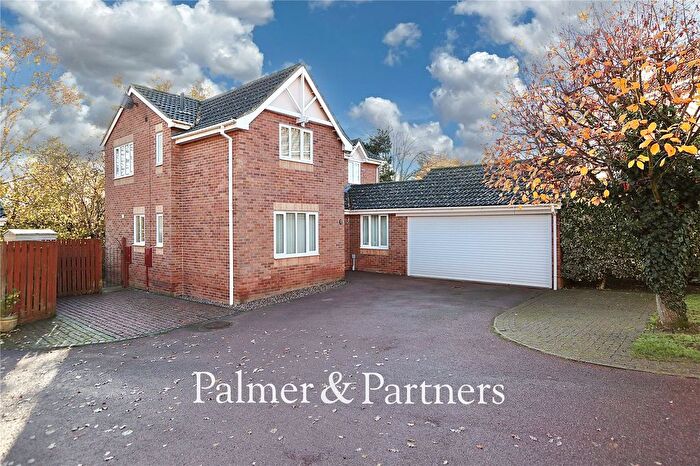
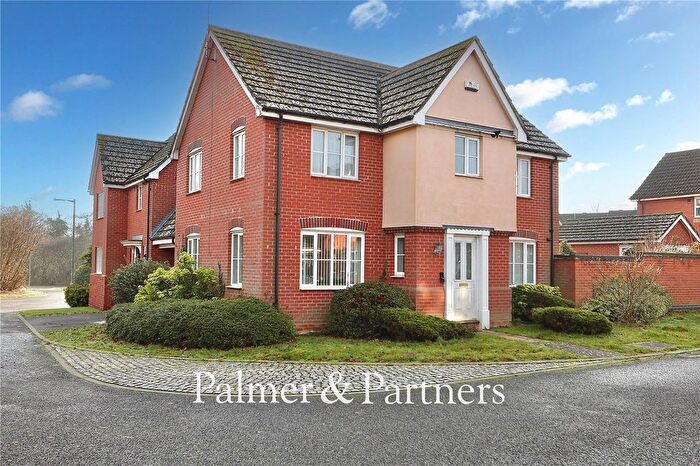
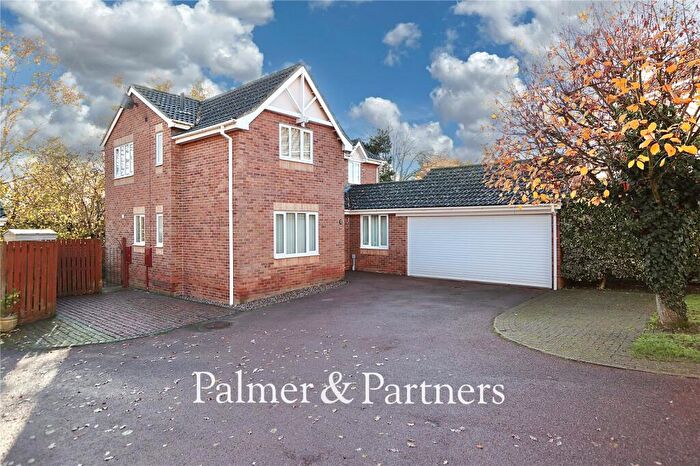
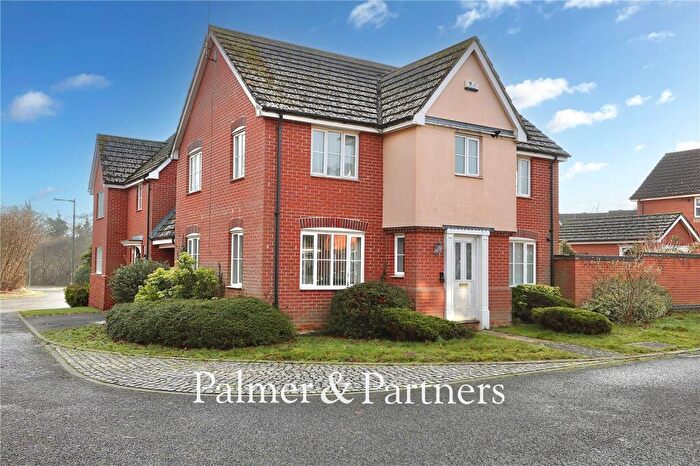
Properties for sale in Pinewood
Roads and Postcodes in Pinewood
Navigate through our locations to find the location of your next house in Pinewood, Ipswich for sale or to rent.
| Streets | Postcodes |
|---|---|
| Acer Grove | IP8 3RR |
| Acorn Close | IP2 9XG |
| Admiral Road | IP8 3PH IP8 3PJ |
| Appleby Close | IP2 9XS |
| Ashton Close | IP2 9XY |
| Baldry Close | IP8 3RF |
| Belmont Road | IP2 9XT IP8 3RP |
| Bishop Mews | IP8 3SY |
| Black Arches | IP8 3UF |
| Bowland Drive | IP8 3RW |
| Bramblewood | IP8 3RS |
| Brimstone Road | IP8 3QY |
| Broad Meadow | IP8 3SP |
| Brookview | IP8 3LJ |
| Burnet Close | IP8 3TN |
| Buttercup Close | IP8 3RG |
| Cherry Blossom Close | IP8 3ST |
| Cinnabar Close | IP8 3UB |
| Clearwing Close | IP8 3UJ |
| Copper Grove | IP8 3UN |
| Cottingham Road | IP8 3SA |
| Curtis Close | IP8 3RE |
| Dashwood Close | IP8 3SR |
| Devlin Road | IP8 3SF |
| Fir Tree Rise | IP8 3RD |
| Forester Close | IP8 3TF |
| Fritillary Close | IP8 3QT |
| Gatekeeper Close | IP8 3NQ |
| Grayling Road | IP8 3NG |
| Green Oak Glade | IP8 3TH |
| Greenspire Grove | IP8 3SZ |
| Grove Hill | IP8 3LL |
| Grove Walk | IP8 3HN |
| Halford Court | IP8 3RT |
| Holly Blue Close | IP8 3TD |
| Innes End | IP8 3RZ |
| Knutsford Close | IP8 3RN |
| Lacewing Close | IP8 3UD |
| Marbled White Drive | IP8 3TL |
| Matlock Close | IP2 9XU |
| Mayfly Close | IP8 3UE |
| Merrion Close | IP2 0SW |
| Milnrow | IP2 0SN |
| Monarch Way | IP8 3TA |
| Mottram Close | IP2 9XQ |
| Oak Eggar Chase | IP8 3TE IP8 3TJ |
| Oldfield Road | IP8 3SE IP8 3SQ |
| Peacock Close | IP8 3RY |
| Quilter Drive | IP8 3RB |
| Rudlands | IP8 3RQ |
| Shortlands | IP8 3RA |
| Skipper Road | IP8 3QU |
| Southgate Road | IP8 3SJ |
| Speckled Wood Close | IP8 3TG |
| Springtail Road | IP8 3UA |
| Sprites Lane | IP8 3NB IP8 3SW |
| Swallowtail Close | IP8 3QX |
| Sycamore Close | IP8 3RL |
| Tortoiseshell Close | IP8 3QZ |
| Ward Road | IP8 3SB |
| Wentworth Drive | IP8 3RX |
| Wilding Road | IP8 3SG |
| Wilmslow Drive | IP2 9XZ |
| Wilson Road | IP8 3SD |
| Yew Tree Rise | IP8 3RH IP8 3RJ |
Transport near Pinewood
- FAQ
- Price Paid By Year
- Property Type Price
Frequently asked questions about Pinewood
What is the average price for a property for sale in Pinewood?
The average price for a property for sale in Pinewood is £259,214. This amount is 10% lower than the average price in Ipswich. There are 939 property listings for sale in Pinewood.
What streets have the most expensive properties for sale in Pinewood?
The streets with the most expensive properties for sale in Pinewood are Tortoiseshell Close at an average of £411,000, Grove Walk at an average of £400,000 and Belmont Road at an average of £385,750.
What streets have the most affordable properties for sale in Pinewood?
The streets with the most affordable properties for sale in Pinewood are Wilson Road at an average of £160,000, Acer Grove at an average of £175,583 and Yew Tree Rise at an average of £182,083.
Which train stations are available in or near Pinewood?
Some of the train stations available in or near Pinewood are Ipswich, Derby Road and Westerfield.
Property Price Paid in Pinewood by Year
The average sold property price by year was:
| Year | Average Sold Price | Price Change |
Sold Properties
|
|---|---|---|---|
| 2025 | £267,467 | 4% |
61 Properties |
| 2024 | £255,611 | 1% |
63 Properties |
| 2023 | £253,999 | -3% |
53 Properties |
| 2022 | £260,559 | 8% |
59 Properties |
| 2021 | £239,278 | 2% |
76 Properties |
| 2020 | £233,703 | 7% |
64 Properties |
| 2019 | £217,633 | -12% |
73 Properties |
| 2018 | £242,756 | 15% |
66 Properties |
| 2017 | £206,726 | 4% |
97 Properties |
| 2016 | £198,266 | 7% |
102 Properties |
| 2015 | £183,728 | 11% |
96 Properties |
| 2014 | £164,222 | 5% |
92 Properties |
| 2013 | £155,897 | 10% |
91 Properties |
| 2012 | £140,197 | -9% |
71 Properties |
| 2011 | £153,056 | -2% |
54 Properties |
| 2010 | £156,759 | 12% |
77 Properties |
| 2009 | £137,626 | -13% |
65 Properties |
| 2008 | £155,547 | -4% |
70 Properties |
| 2007 | £161,892 | 10% |
121 Properties |
| 2006 | £146,372 | 6% |
143 Properties |
| 2005 | £137,614 | -5% |
137 Properties |
| 2004 | £144,023 | 11% |
162 Properties |
| 2003 | £128,112 | 13% |
160 Properties |
| 2002 | £110,924 | 15% |
215 Properties |
| 2001 | £93,855 | 9% |
250 Properties |
| 2000 | £85,501 | 13% |
262 Properties |
| 1999 | £74,745 | 17% |
240 Properties |
| 1998 | £62,037 | 1% |
162 Properties |
| 1997 | £61,552 | 18% |
148 Properties |
| 1996 | £50,543 | 8% |
93 Properties |
| 1995 | £46,344 | - |
69 Properties |
Property Price per Property Type in Pinewood
Here you can find historic sold price data in order to help with your property search.
The average Property Paid Price for specific property types in the last three years are:
| Property Type | Average Sold Price | Sold Properties |
|---|---|---|
| Semi Detached House | £262,025.00 | 40 Semi Detached Houses |
| Detached House | £334,706.00 | 58 Detached Houses |
| Terraced House | £204,657.00 | 76 Terraced Houses |
| Flat | £144,333.00 | 3 Flats |

