
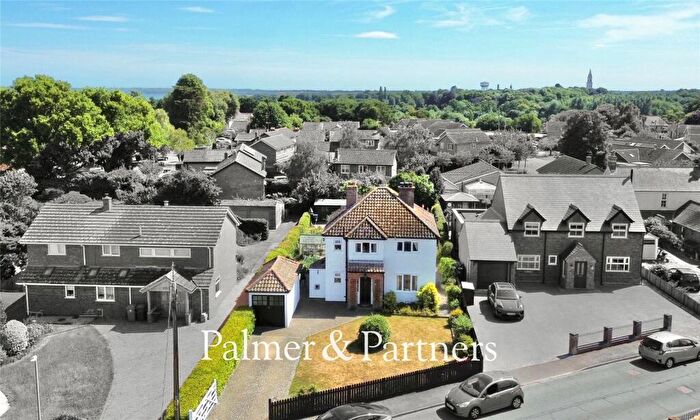
Houses for sale in Holbrook, Ipswich
House Prices in Holbrook
Properties in Holbrook have an average house price of £389k and had 44 Property Transactions within the last 3 years¹.
Holbrook is an area in Ipswich, Suffolk with 651 households², where the most expensive property was sold for £855k.
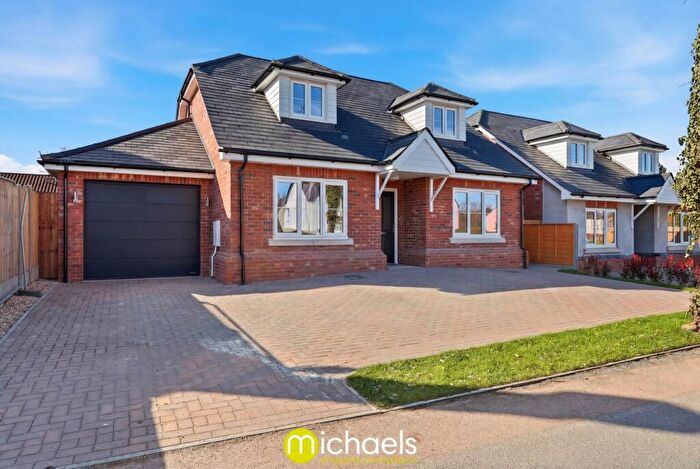
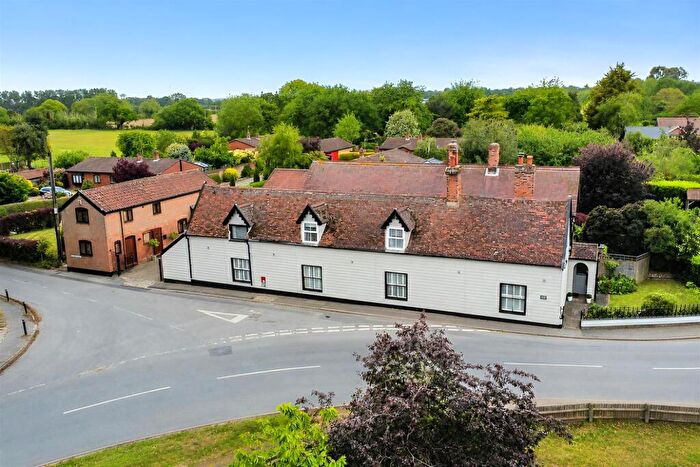
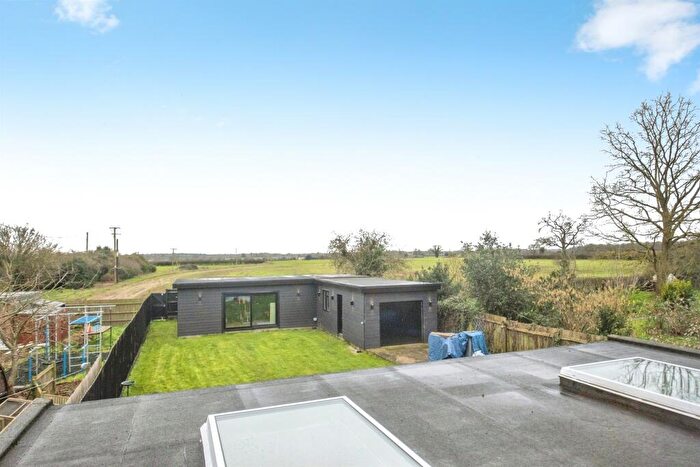
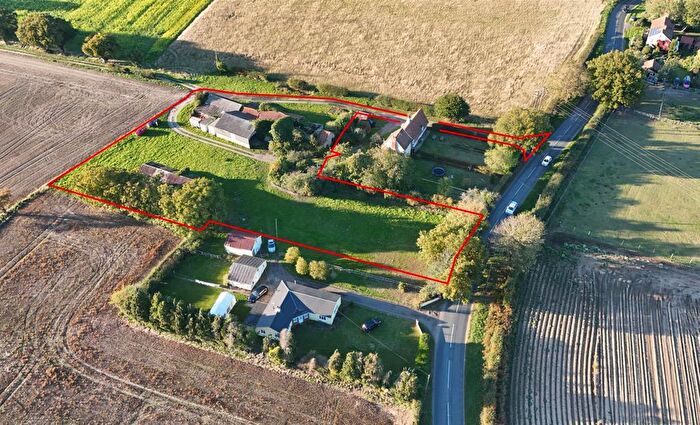
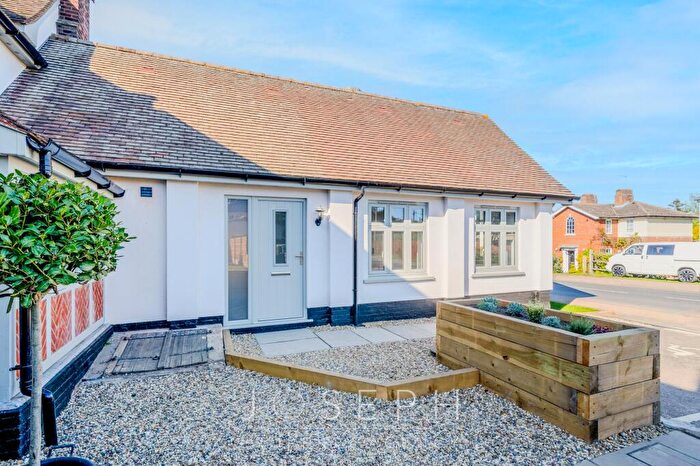
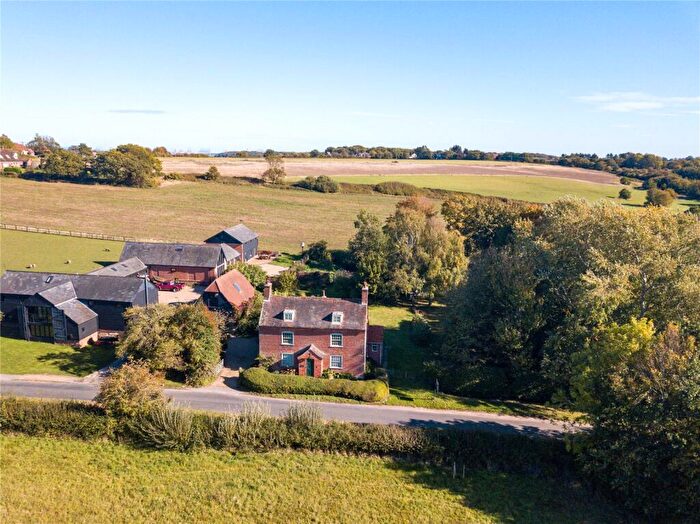
Properties for sale in Holbrook
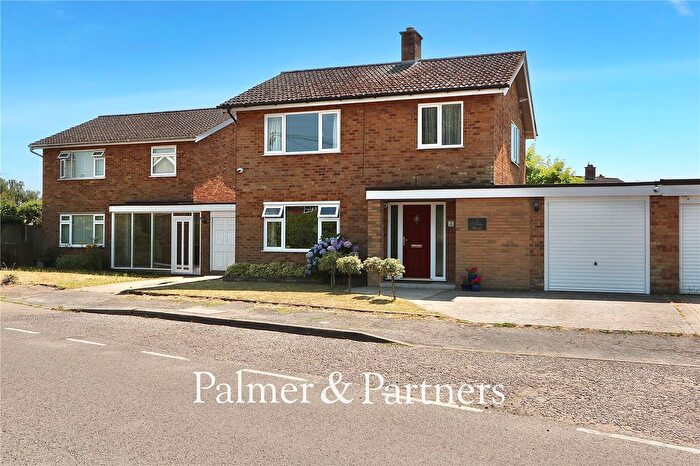

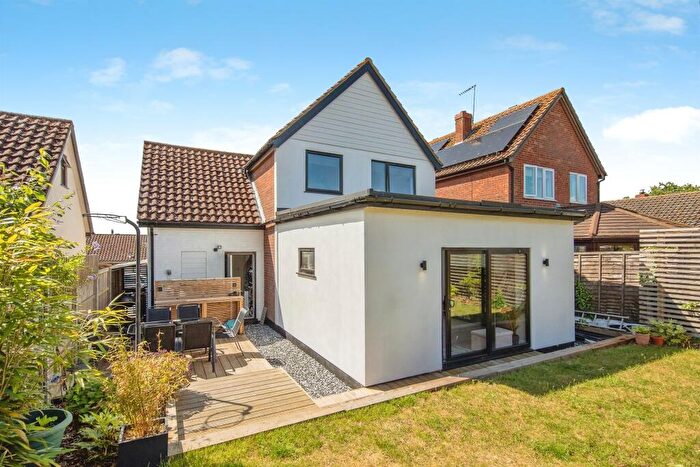
![]()
If you are looking to sell your house, let it out, or receive a property valuation, an expert can help you.
Click the button below to get started.

Previously listed properties in Holbrook
Roads and Postcodes in Holbrook
Navigate through our locations to find the location of your next house in Holbrook, Ipswich for sale or to rent.
| Streets | Postcodes |
|---|---|
| Alton Green | IP9 2RN |
| Broomhill | IP9 2PG |
| Caxton Close | IP9 2GZ |
| Church Hill | IP9 2PQ IP9 2QN IP9 2QP IP9 2QW |
| Church Lane | IP9 1DG |
| Clench Road | IP9 2PP |
| Clifton Wood | IP9 2PY |
| Coachmans Paddock | IP9 2RW |
| Council Houses | IP9 2QX |
| Denmark Gardens | IP9 2BG |
| East Row | IP9 2PZ |
| Firebronds Road | IP9 2TP |
| Fishponds Lane | IP9 2QZ |
| Five Acres | IP9 2QE |
| Gifford Close | IP9 2TR |
| Hapenny Drive | IP9 2TT |
| Hapenny Field | IP9 2TS |
| Harkstead Road | IP9 2RA IP9 2RQ |
| Heathfield Road | IP9 2QB IP9 2QJ |
| Holbrook Gardens | IP9 2QU |
| Holbrook Road | IP9 1BP |
| Holm Oak | IP9 2BH |
| Hyams Lane | IP9 2QF |
| Ipswich Road | IP9 1BJ IP9 2QR IP9 2QT IP9 2QY |
| Jervis Close | IP9 2RR |
| Little Orchard | IP9 2NR |
| Lower Road | IP9 1DA |
| Mill Rise | IP9 2QH |
| Needles Corner | IP9 1BY |
| New Lane | IP9 2RD |
| Pettwood Gardens | IP9 2WE |
| Primrose Hill | IP9 2RP |
| Reade Road | IP9 2QL |
| Rence Park Cottages | IP9 1HA |
| River View Road | IP9 1BL |
| Shepherds Lane | IP9 2QA |
| Shore Lane | IP9 1BW |
| The Heath | IP9 2QD |
| The Street | IP9 1BN IP9 1BT IP9 2PX |
| Walnut Tree Lane | IP9 1BS |
| Woodlands Corner | IP9 2PU |
| Woodlands Lane | IP9 2PW |
| IP9 1DE IP9 1HB IP9 1HD IP9 2PJ IP9 2PT IP9 2RJ |
Property price trends in Holbrook
According to the latest Land Registry data, the average home in Holbrook sold for £427,500 in 2026. That figure comes from 669 sales logged over the past 31 years.
Prices have moved up over the last three years. Compared with 2023, when the typical sale came in around £416,653, that's a rise of roughly 2.6%.
Looking back five years, average prices are down about 6.5% since 2021, a drop of around £29,596 in cash terms.
Zoom out to the past decade for the fuller picture. Back in 2016, homes here averaged £441,260, so the typical sold price has fallen about 3.1% since then, around 0.3% a year lower. Stretch the view to fifteen years and that annual pace holds at about -0.4%.
Frequently asked questions about Holbrook
What is the average price for a property for sale in Holbrook?
The average price for a property for sale in Holbrook is £388,647. This amount is 34% higher than the average price in Ipswich. There are 341 property listings for sale in Holbrook.
What streets have the most expensive properties for sale in Holbrook?
The streets with the most expensive properties for sale in Holbrook are Church Hill at an average of £800,000, Church Lane at an average of £510,000 and Ipswich Road at an average of £447,500.
What streets have the most affordable properties for sale in Holbrook?
The streets with the most affordable properties for sale in Holbrook are East Row at an average of £236,750, Five Acres at an average of £291,666 and Reade Road at an average of £297,071.
Which train stations are available in or near Holbrook?
Some of the train stations available in or near Holbrook are Wrabness, Mistley and Harwich International.
Property Price Paid in Holbrook by Year
The average sold property price by year was:
| Year | Average Sold Price | Price Change |
Sold Properties
|
|---|---|---|---|
| 2026 | £427,500 | 5% |
2 Properties |
| 2025 | £407,214 | 16% |
14 Properties |
| 2024 | £341,866 | -22% |
15 Properties |
| 2023 | £416,653 | -5% |
13 Properties |
| 2022 | £436,739 | -5% |
20 Properties |
| 2021 | £457,096 | 19% |
19 Properties |
| 2020 | £368,685 | -17% |
27 Properties |
| 2019 | £431,458 | 18% |
24 Properties |
| 2018 | £352,978 | 2% |
23 Properties |
| 2017 | £346,833 | -27% |
15 Properties |
Property Price per Property Type in Holbrook
Here you can find historic sold price data in order to help with your property search.
The average Property Paid Price for specific property types in the last three years are:
| Property Type | Average Sold Price | Sold Properties |
|---|---|---|
| Semi Detached House | £350,500.00 | 13 Semi Detached Houses |
| Detached House | £438,666.00 | 21 Detached Houses |
| Terraced House | £333,200.00 | 10 Terraced Houses |
