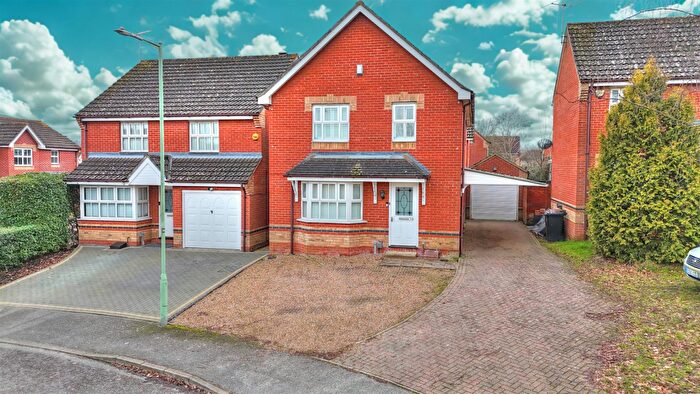
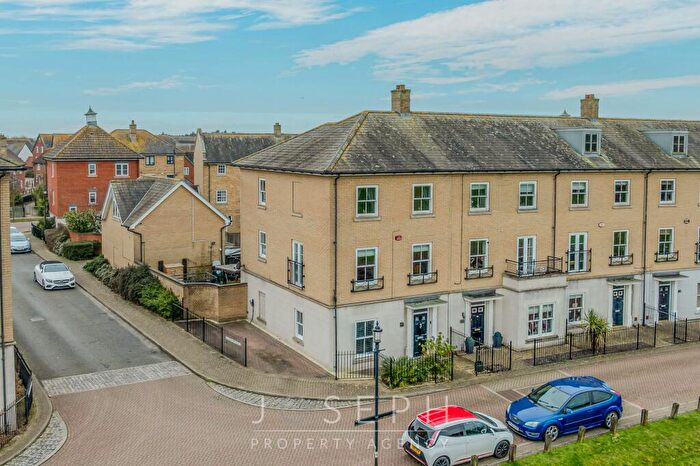
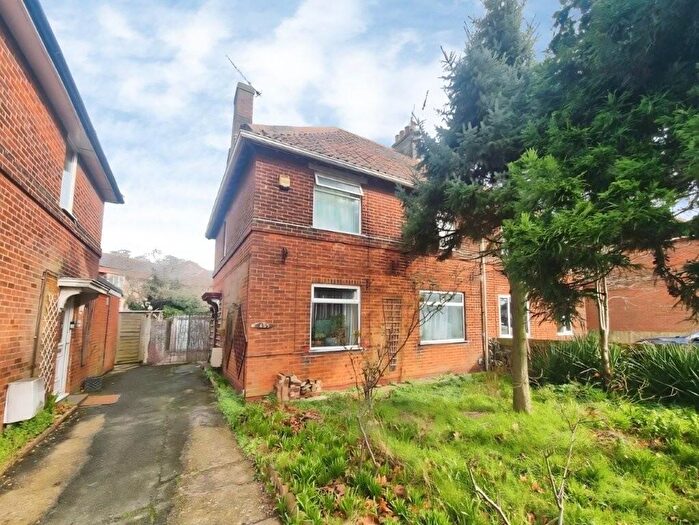
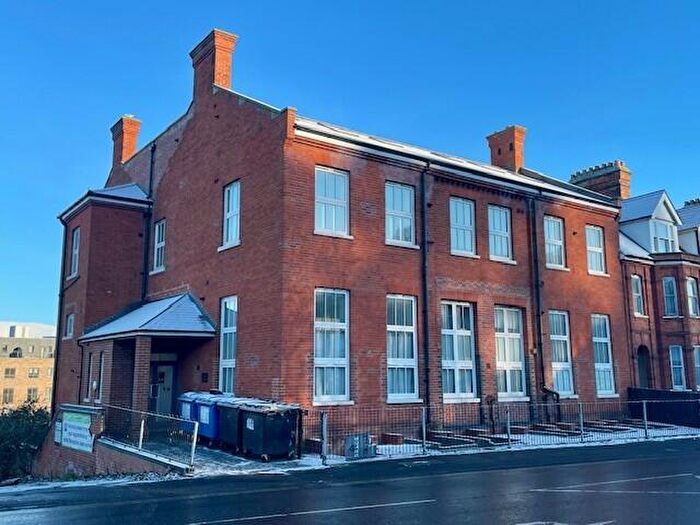
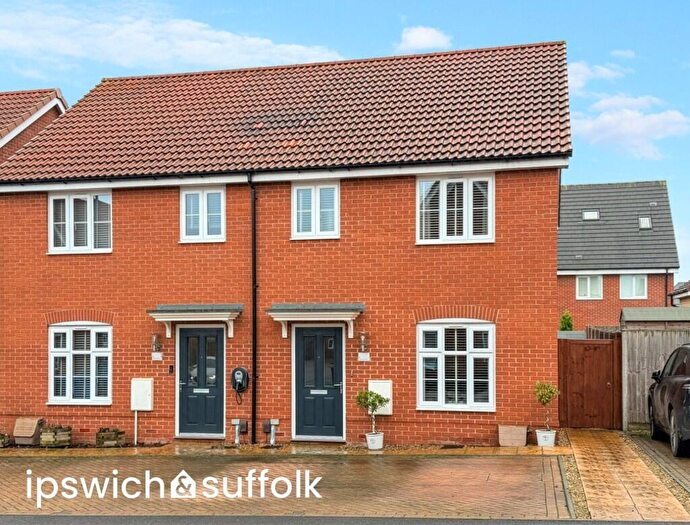
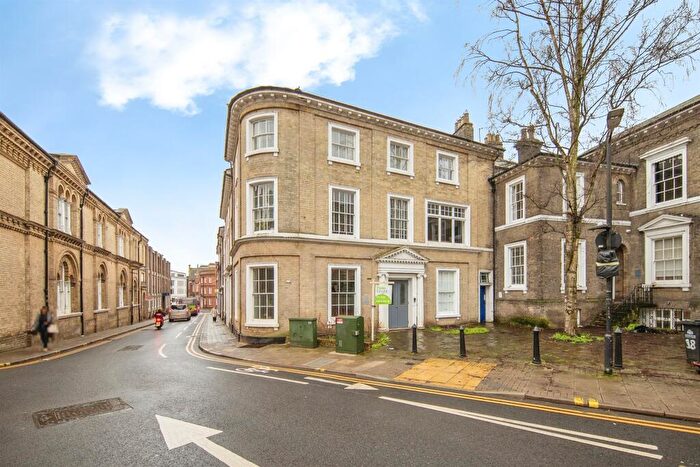
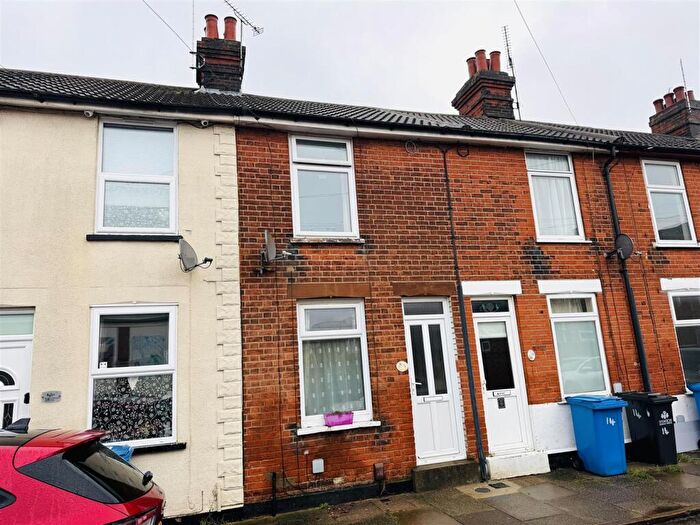
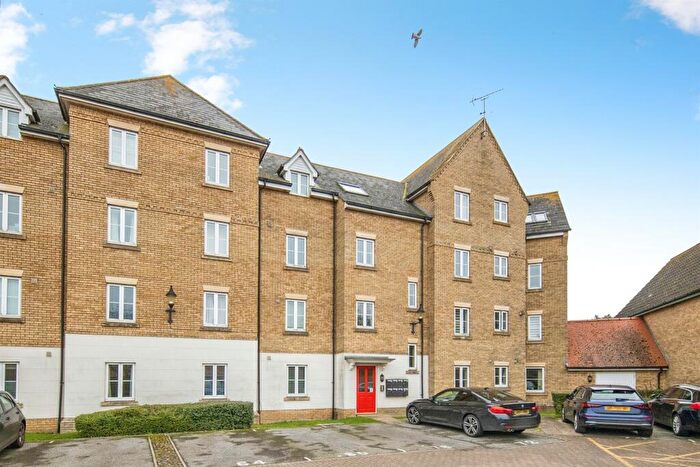
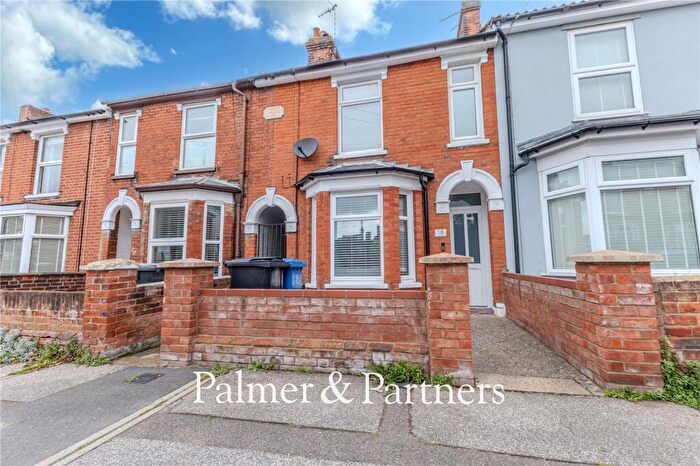
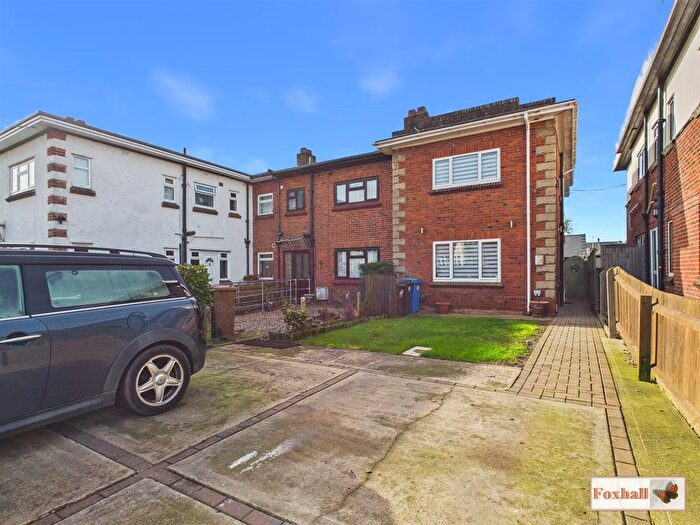
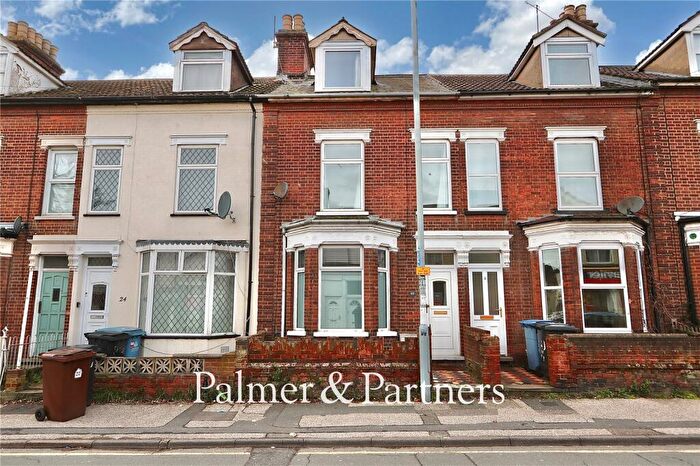
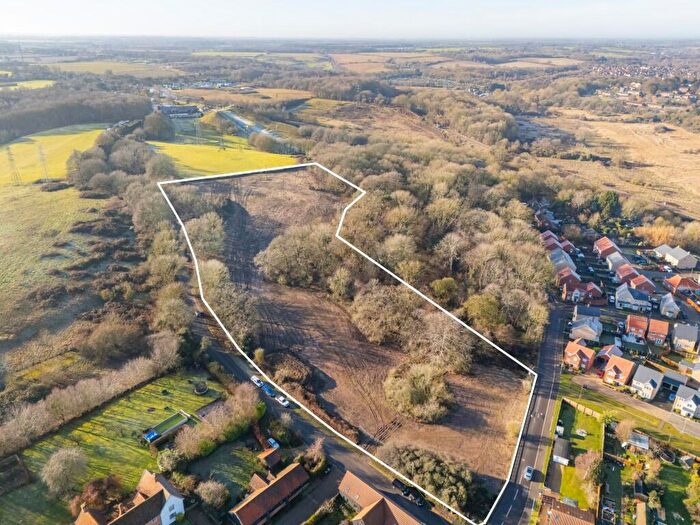
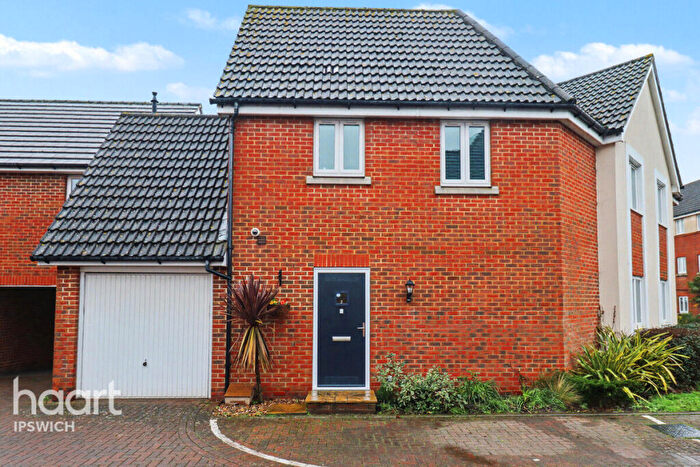
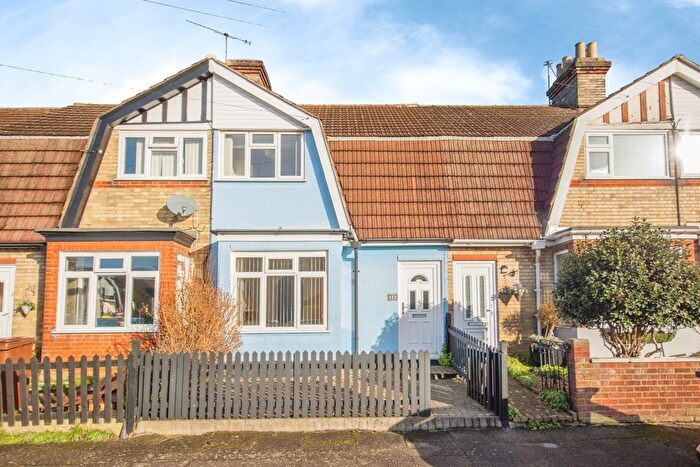
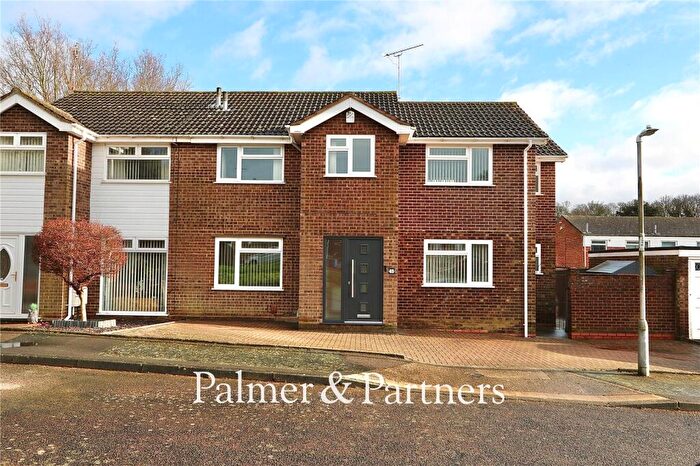
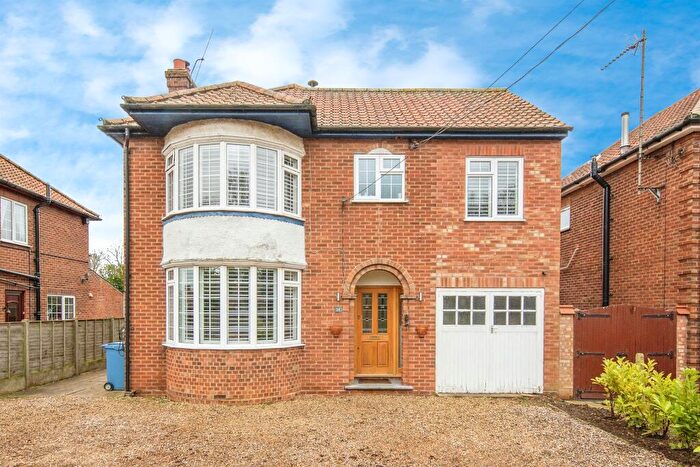
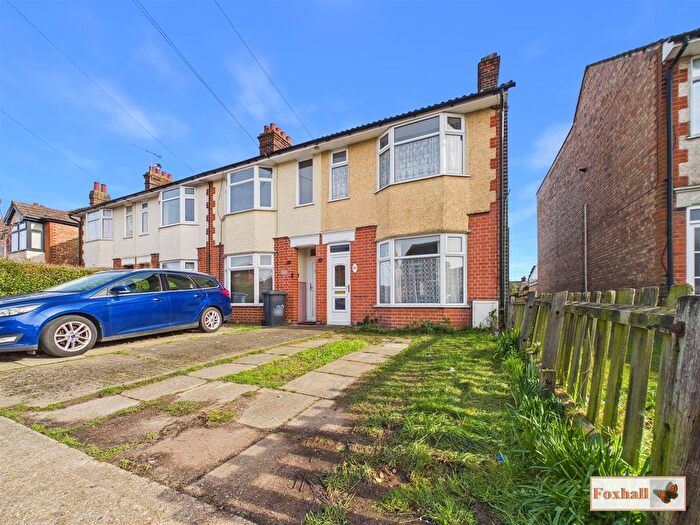
Houses for sale & to rent in Orwell, Ipswich
House Prices in Orwell
Properties in Orwell have an average house price of £655,000.00 and had 2 Property Transactions within the last 3 years¹.
Orwell is an area in Ipswich, Suffolk with 142 households², where the most expensive property was sold for £985,000.00.
Properties for sale in Orwell
Roads and Postcodes in Orwell
Navigate through our locations to find the location of your next house in Orwell, Ipswich for sale or to rent.
| Streets | Postcodes |
|---|---|
| Belstead Village | IP8 3JU |
| Bourne Hill | IP2 8NH |
| Bucks Horn Place | IP8 3GL |
| Clay Pond Way | IP2 8NE |
| Coronation Cottage | IP9 2AS |
| Crag Pit Cottages | IP9 2NX |
| Foxes Close | IP2 8NF |
| Glebe Close | IP9 2PE |
| Grove Hill | IP8 3LW |
| Harkstead Lane | IP9 1BB IP9 1BD IP9 1BF |
| Holbrook Road | IP9 2FN IP9 2NP |
| Ipswich Road | IP9 2NW |
| Main Road | IP9 1HL |
| Mannings Lane | IP9 1AN IP9 1AW |
| Meadow Close | IP9 1HQ |
| Mill Farm Place | IP8 3NP |
| Millfield | IP9 1DW |
| Moyes Place | IP8 3FE |
| Ostrich Close | IP2 8NN |
| Park Farm Cottages | IP9 2AG |
| Park Lane | IP9 2FP |
| Peppers Lane | IP9 2AB |
| Pin Mill Road | IP9 1JH |
| Richardsons Lane | IP9 1HR |
| Shotley Road | IP9 1EF |
| The Strand | IP2 8SA |
| The Street | IP9 2AJ IP9 2AL IP9 2AN |
| The Wonder | IP9 2EJ IP9 2PB |
| Valley Lane | IP9 2AX IP9 2AY |
| Wades Lane | IP9 1EH |
| Wherstead Park | IP9 2BJ IP9 2WG |
| IP8 3JT IP9 1AE IP9 1AG IP9 1AQ IP9 1AS IP9 1AT IP9 1AY IP9 1AZ IP9 1EZ IP9 1JR IP9 1JW IP9 1JY IP9 2AA IP9 2AT IP9 2AU IP9 2BA IP9 2BB IP9 2BD IP9 2LU IP9 2NG IP9 2NS |
Transport near Orwell
- FAQ
- Price Paid By Year
- Property Type Price
Frequently asked questions about Orwell
What is the average price for a property for sale in Orwell?
The average price for a property for sale in Orwell is £655,000. This amount is 127% higher than the average price in Ipswich. There are more than 10,000 property listings for sale in Orwell.
Which train stations are available in or near Orwell?
Some of the train stations available in or near Orwell are Ipswich, Derby Road and Wrabness.
Property Price Paid in Orwell by Year
The average sold property price by year was:
| Year | Average Sold Price | Price Change |
Sold Properties
|
|---|---|---|---|
| 2024 | £985,000 | 67% |
1 Property |
| 2023 | £325,000 | -126% |
1 Property |
| 2021 | £735,000 | 45% |
1 Property |
| 2020 | £403,666 | -22% |
3 Properties |
| 2019 | £492,500 | 5% |
4 Properties |
| 2018 | £470,187 | 37% |
8 Properties |
| 2017 | £297,000 | -64% |
5 Properties |
| 2016 | £488,333 | 14% |
3 Properties |
| 2015 | £418,000 | 28% |
1 Property |
| 2014 | £302,500 | -65% |
1 Property |
| 2006 | £500,000 | - |
1 Property |
Property Price per Property Type in Orwell
Here you can find historic sold price data in order to help with your property search.
The average Property Paid Price for specific property types in the last three years are:
| Property Type | Average Sold Price | Sold Properties |
|---|---|---|
| Semi Detached House | £325,000.00 | 1 Semi Detached House |
| Detached House | £985,000.00 | 1 Detached House |

