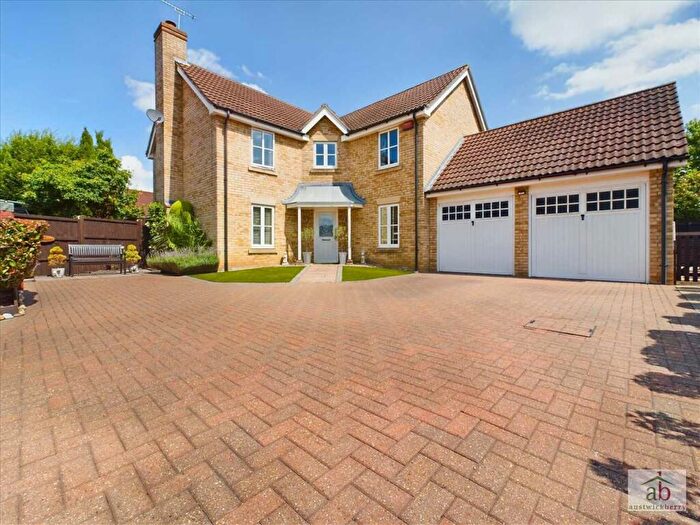
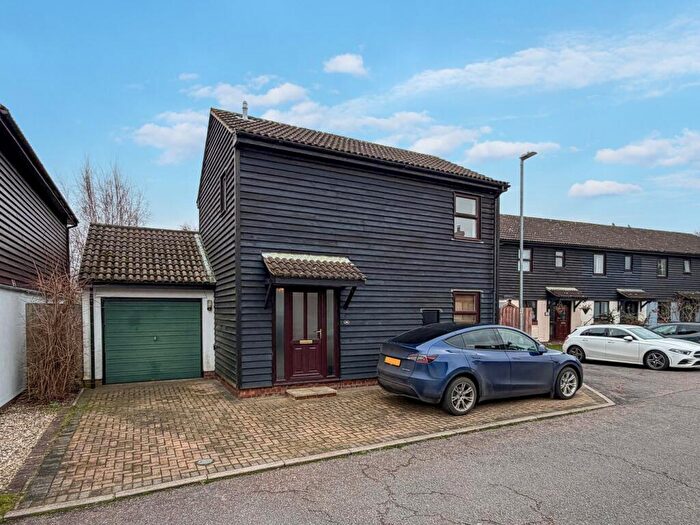
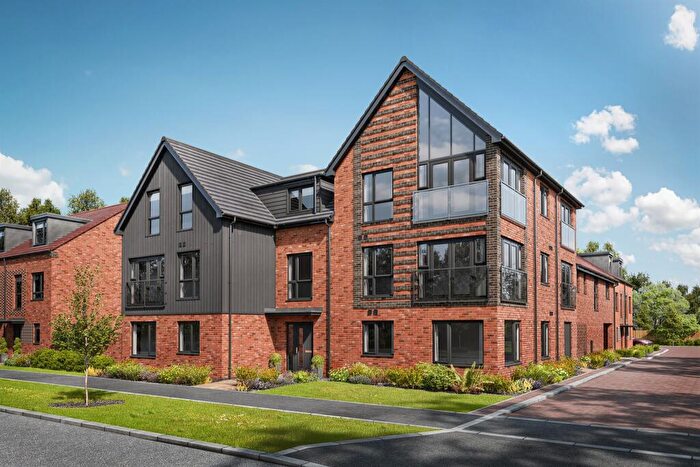
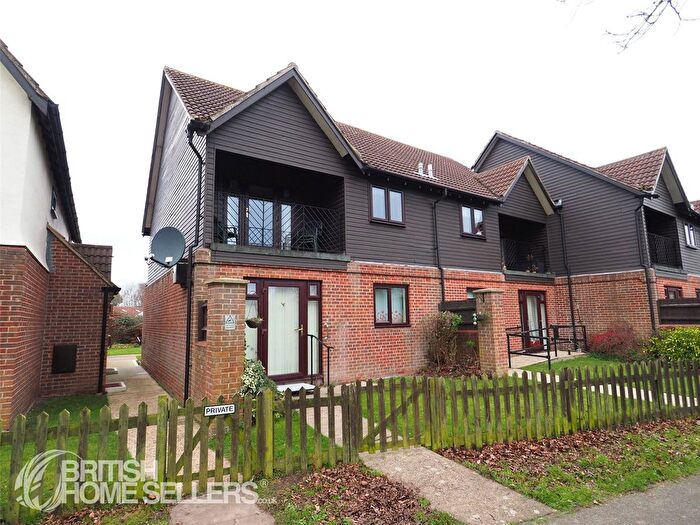
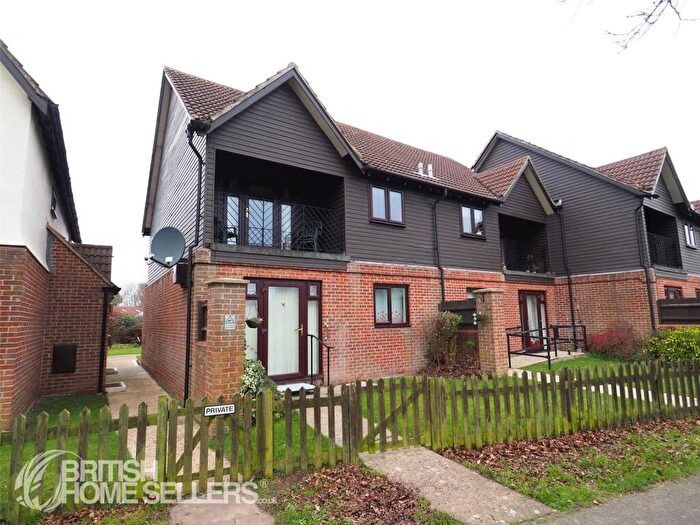
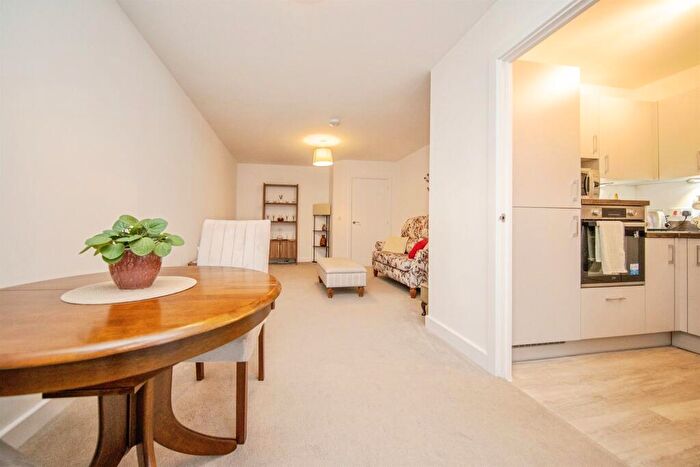
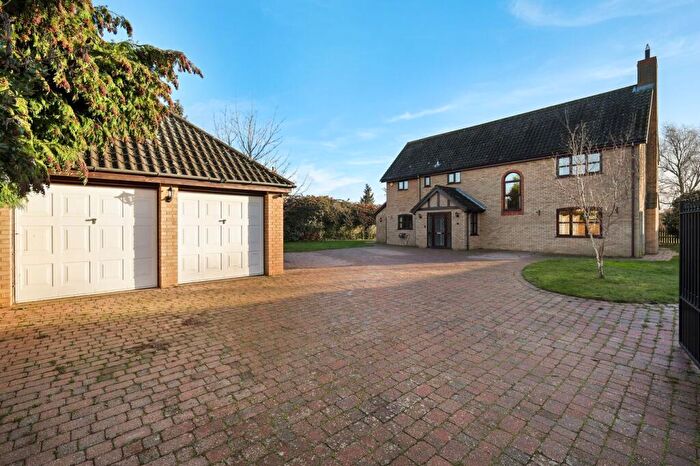
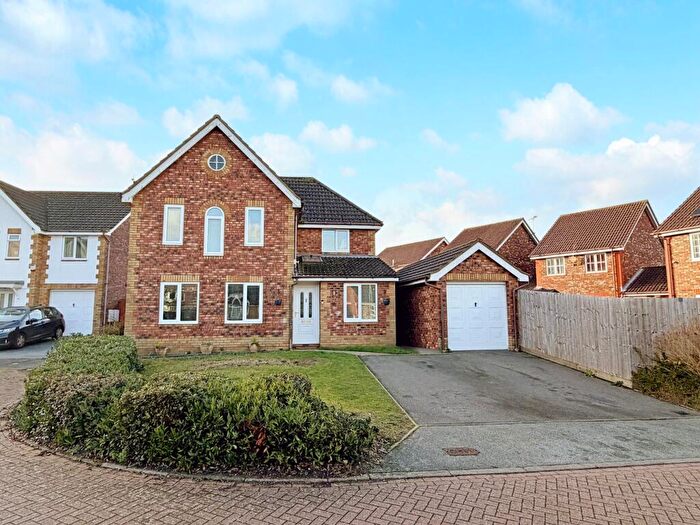
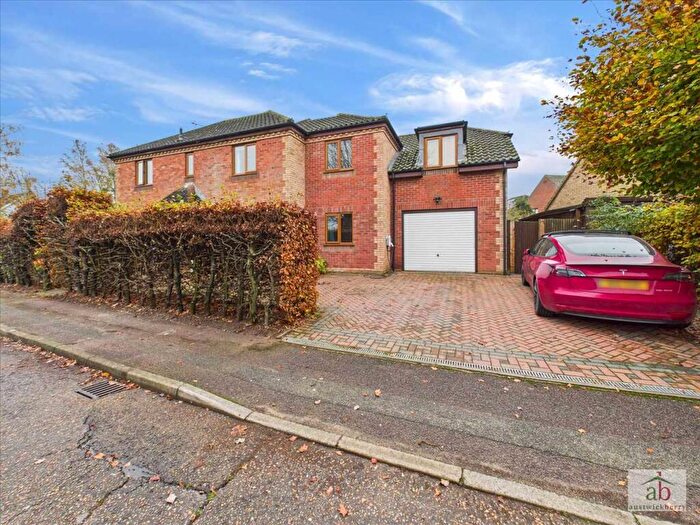
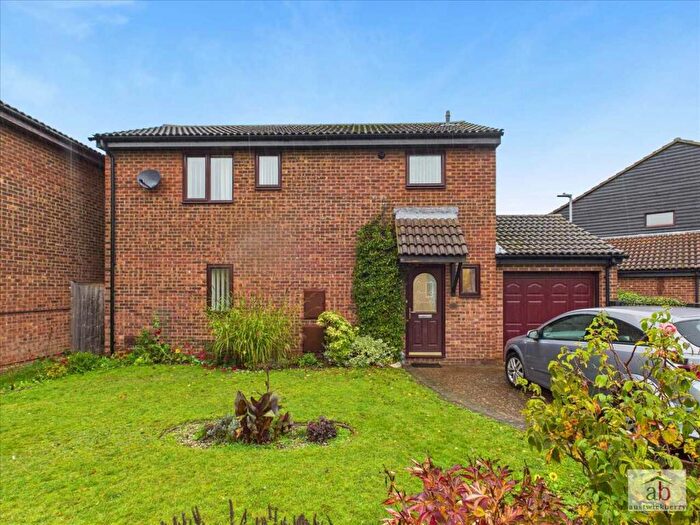
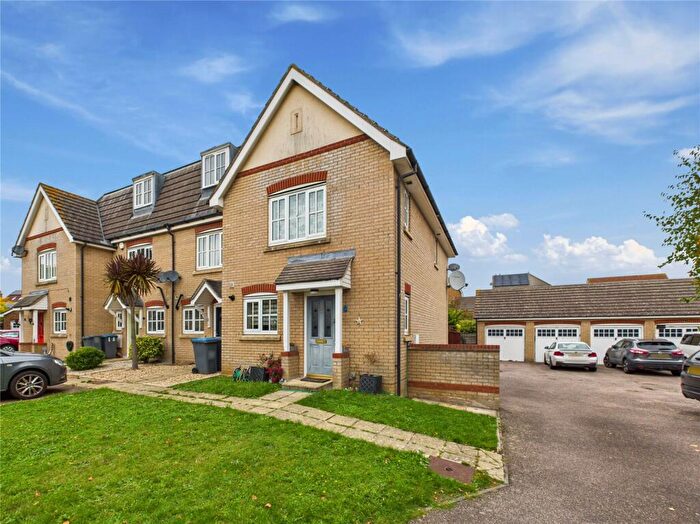
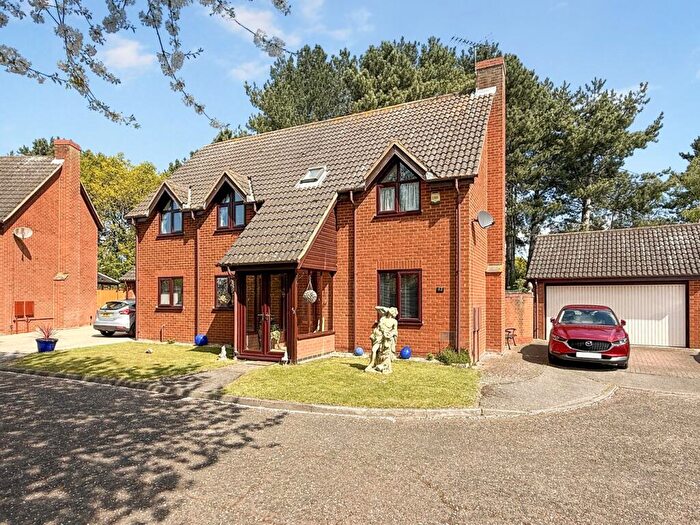
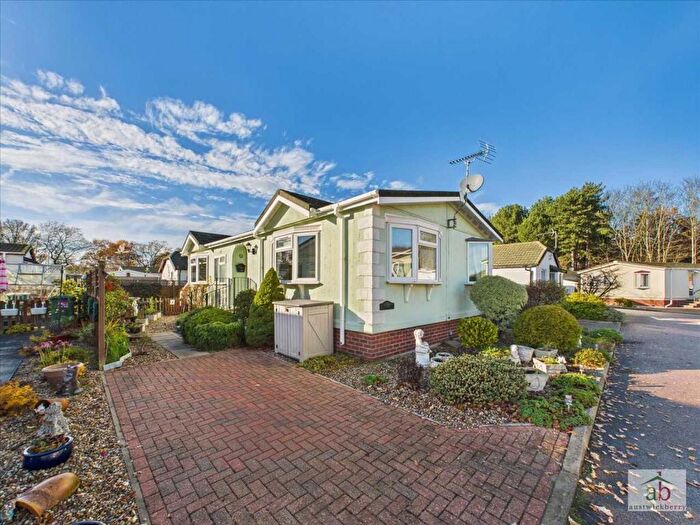
Houses for sale & to rent in Martlesham, Ipswich
House Prices in Martlesham
Properties in Martlesham have an average house price of £322,783.00 and had 132 Property Transactions within the last 3 years¹.
Martlesham is an area in Ipswich, Suffolk with 1,377 households², where the most expensive property was sold for £935,000.00.
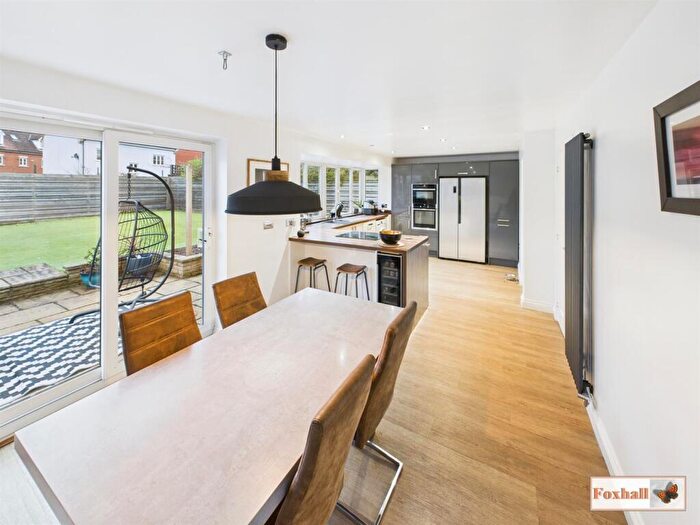
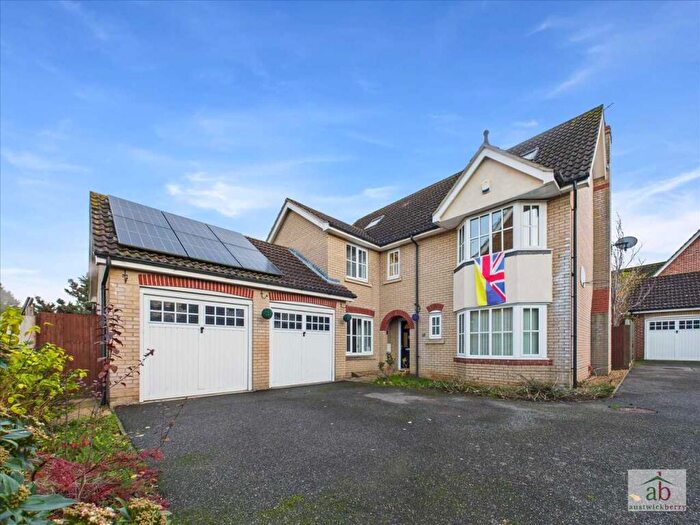
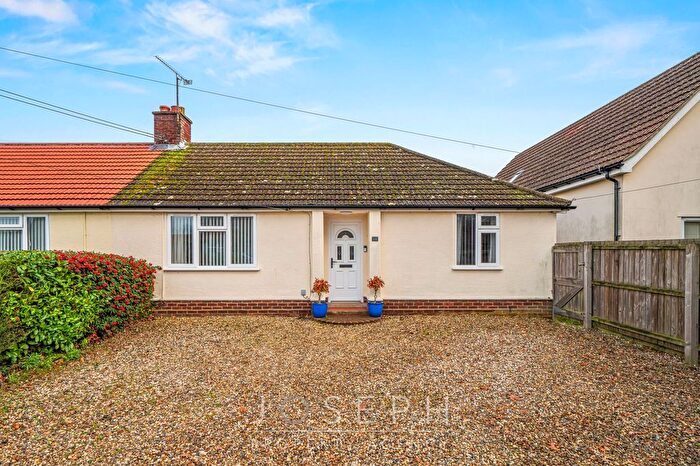
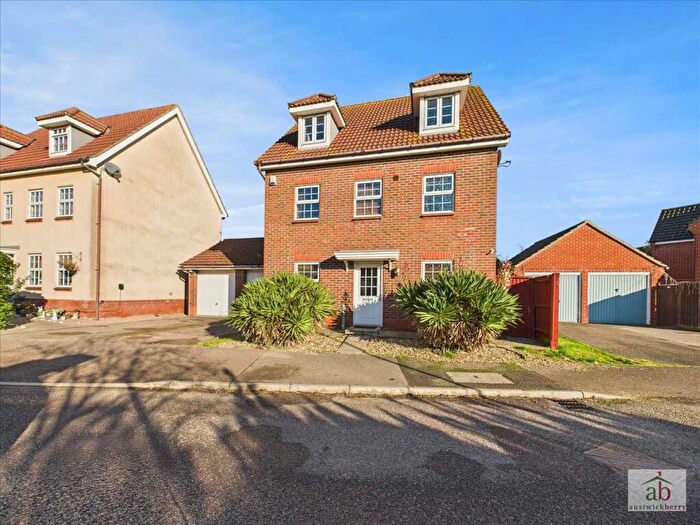
Properties for sale in Martlesham
Roads and Postcodes in Martlesham
Navigate through our locations to find the location of your next house in Martlesham, Ipswich for sale or to rent.
| Streets | Postcodes |
|---|---|
| Avocet Lane | IP5 3SE IP5 3SF |
| Bader Court | IP5 3UY |
| Birch Grove | IP5 3TD |
| Bradford Court | IP5 3TE |
| Broomfield | IP5 3TP IP5 3TW |
| Broomfield Mews | IP5 3TN |
| Burgess Place | IP5 3QZ |
| Carlford Close | IP5 3TA IP5 3TB |
| Coopers Road | IP5 3SJ |
| De Brink On The Green | IP5 3PJ |
| Demesne Gardens | IP5 3UA |
| Denham Court | IP5 3TF |
| Digby Close | IP5 3UD |
| Farriers Close | IP5 3SN IP5 3SW |
| Forest Lane | IP5 3ST |
| Gresswell Court | IP5 3TG |
| Hall Road | IP5 2QN |
| Harvesters Way | IP5 3UR |
| Heather Close | IP5 3UE |
| Heathfield | IP5 3UB |
| Heathfield Mews | IP5 3UF |
| Hilton Road | IP5 3RL |
| Holly End | IP5 3UW |
| Hunters Ride | IP5 3SQ |
| Jackson Court | IP5 3PH |
| Lancaster Drive | IP5 3TH IP5 3TJ |
| Lark Rise | IP5 3SA IP5 3SB |
| Lingside | IP5 3UT |
| Manor Road | IP5 3SX IP5 3SY |
| Mayfield Lane | IP5 3TZ |
| Mayfields | IP5 3TU |
| Park Close | IP5 3UJ |
| Parkers Place | IP5 3UX |
| Peel Yard | IP5 3UL |
| Pine Bank | IP5 3UP |
| Portal Avenue | IP5 3QY |
| Saddlers Place | IP5 3SS |
| Sidecentre Gate | IP5 3TY |
| Sorrell Walk | IP5 3UU |
| Squires Lane | IP5 3UG |
| Stable Court | IP5 3UQ |
| Swan Close | IP5 3SD |
| The Chase | IP5 3QT |
| The Grove | IP5 3UZ |
| The Oaks | IP5 3UN |
| The Paddocks | IP5 3UH |
| The Square | IP5 3SL |
| Thirling Court | IP5 3TS |
| Valiant Road | IP5 3SP IP5 3SR |
| Warren Lane | IP5 3SH |
| Westland | IP5 3SU |
| Whinfield | IP5 3TR |
| Whinfield Court | IP5 3TQ |
| York Road | IP5 3TL |
Transport near Martlesham
- FAQ
- Price Paid By Year
- Property Type Price
Frequently asked questions about Martlesham
What is the average price for a property for sale in Martlesham?
The average price for a property for sale in Martlesham is £322,783. This amount is 12% higher than the average price in Ipswich. There are 440 property listings for sale in Martlesham.
What streets have the most expensive properties for sale in Martlesham?
The streets with the most expensive properties for sale in Martlesham are Heather Close at an average of £715,000, Forest Lane at an average of £625,000 and Avocet Lane at an average of £590,000.
What streets have the most affordable properties for sale in Martlesham?
The streets with the most affordable properties for sale in Martlesham are Lark Rise at an average of £147,600, Bader Court at an average of £177,000 and Sorrell Walk at an average of £179,166.
Which train stations are available in or near Martlesham?
Some of the train stations available in or near Martlesham are Woodbridge, Derby Road and Melton.
Property Price Paid in Martlesham by Year
The average sold property price by year was:
| Year | Average Sold Price | Price Change |
Sold Properties
|
|---|---|---|---|
| 2025 | £345,076 | 2% |
39 Properties |
| 2024 | £338,659 | 14% |
42 Properties |
| 2023 | £292,661 | 1% |
51 Properties |
| 2022 | £288,776 | 10% |
52 Properties |
| 2021 | £260,646 | -10% |
81 Properties |
| 2020 | £285,971 | -2% |
35 Properties |
| 2019 | £292,085 | 5% |
48 Properties |
| 2018 | £278,777 | 3% |
27 Properties |
| 2017 | £271,073 | 10% |
54 Properties |
| 2016 | £245,297 | 3% |
52 Properties |
| 2015 | £236,746 | 10% |
65 Properties |
| 2014 | £213,819 | 7% |
72 Properties |
| 2013 | £197,948 | 2% |
54 Properties |
| 2012 | £193,897 | 3% |
44 Properties |
| 2011 | £187,632 | -8% |
49 Properties |
| 2010 | £202,111 | 14% |
53 Properties |
| 2009 | £174,694 | -6% |
51 Properties |
| 2008 | £185,696 | -23% |
42 Properties |
| 2007 | £228,212 | 20% |
60 Properties |
| 2006 | £181,584 | 17% |
95 Properties |
| 2005 | £150,494 | -14% |
72 Properties |
| 2004 | £171,034 | 21% |
63 Properties |
| 2003 | £134,905 | 6% |
111 Properties |
| 2002 | £126,972 | 10% |
92 Properties |
| 2001 | £113,933 | 15% |
72 Properties |
| 2000 | £96,376 | 5% |
66 Properties |
| 1999 | £91,976 | 16% |
72 Properties |
| 1998 | £77,592 | 4% |
74 Properties |
| 1997 | £74,586 | 11% |
78 Properties |
| 1996 | £66,455 | 4% |
51 Properties |
| 1995 | £63,654 | - |
62 Properties |
Property Price per Property Type in Martlesham
Here you can find historic sold price data in order to help with your property search.
The average Property Paid Price for specific property types in the last three years are:
| Property Type | Average Sold Price | Sold Properties |
|---|---|---|
| Semi Detached House | £320,468.00 | 32 Semi Detached Houses |
| Detached House | £438,994.00 | 53 Detached Houses |
| Terraced House | £248,295.00 | 22 Terraced Houses |
| Flat | £144,928.00 | 25 Flats |

