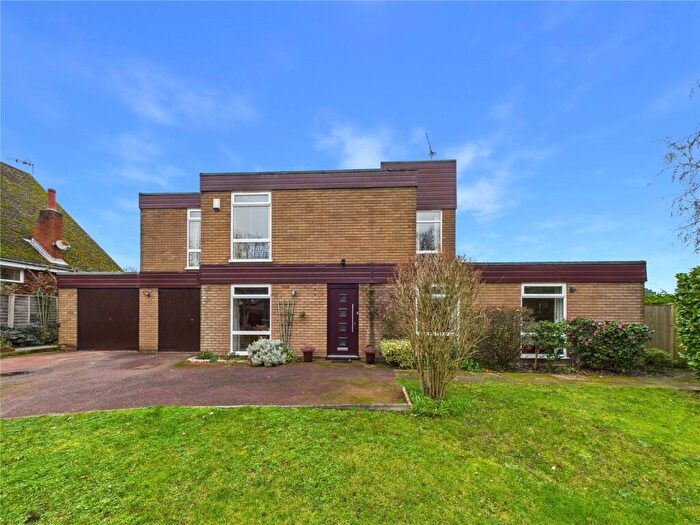
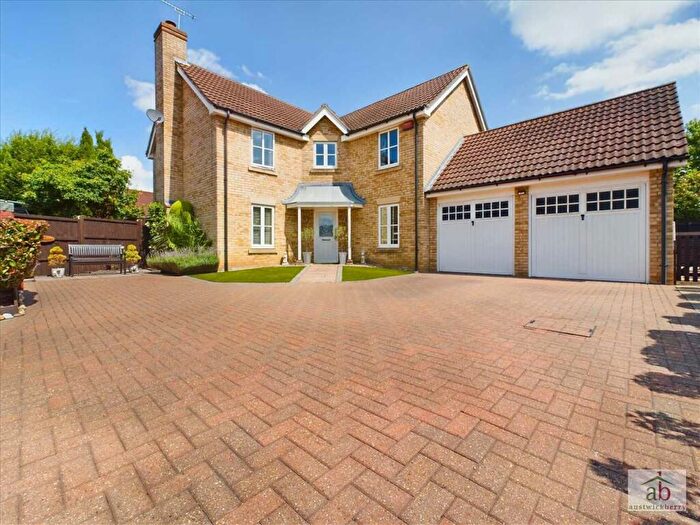
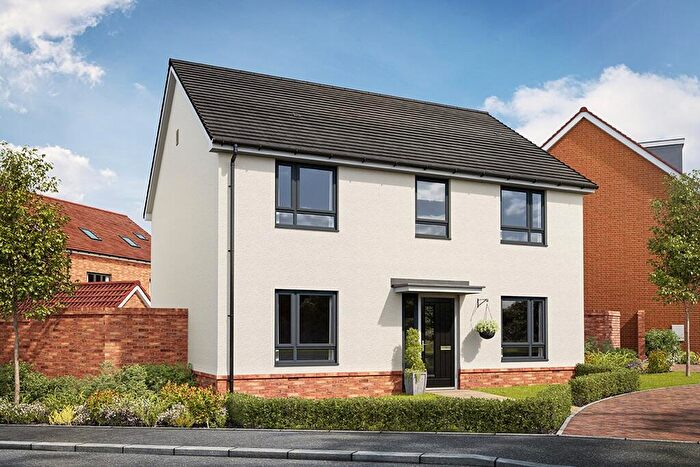
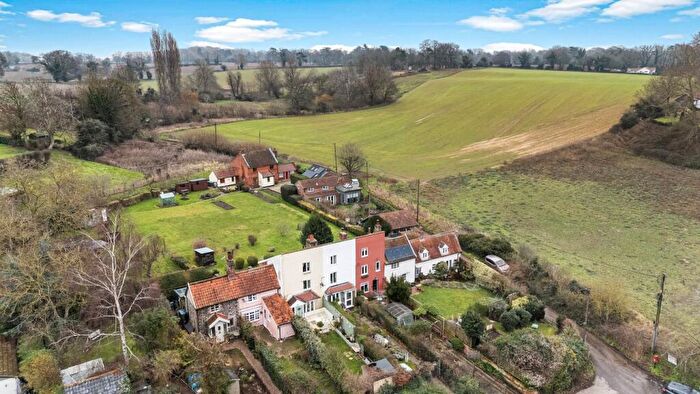
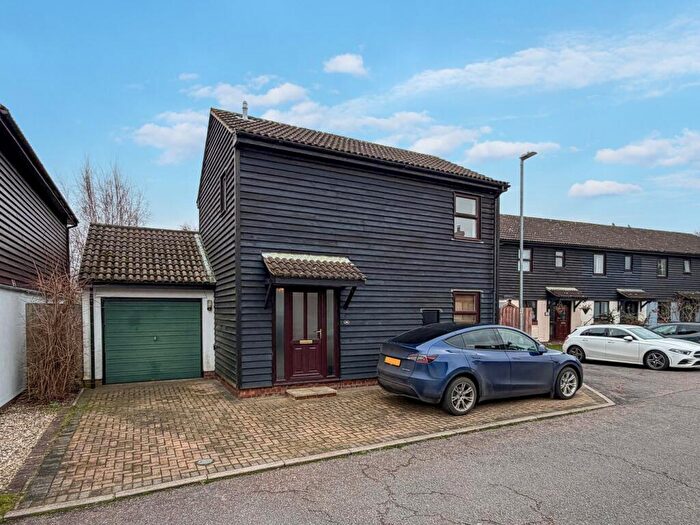
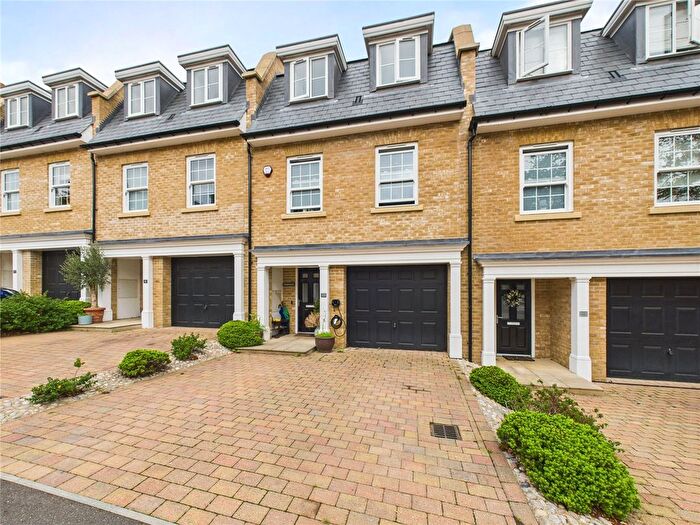
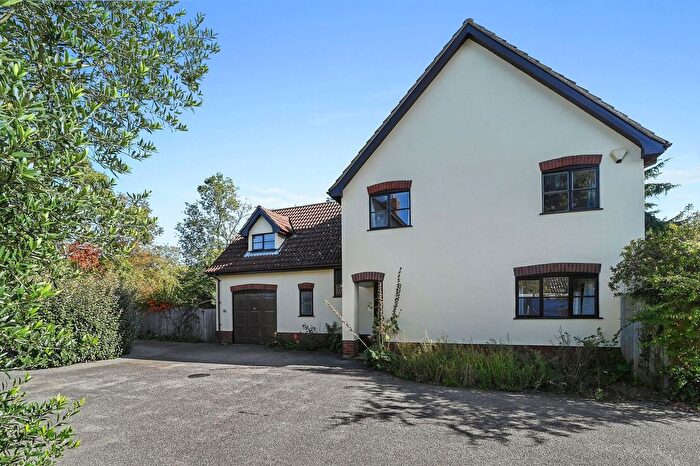
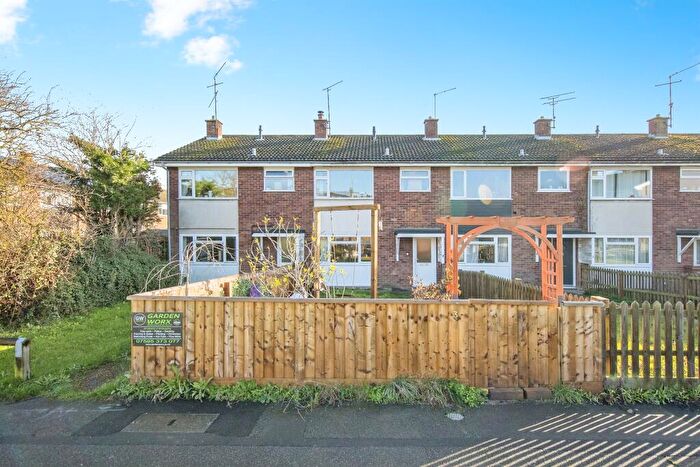
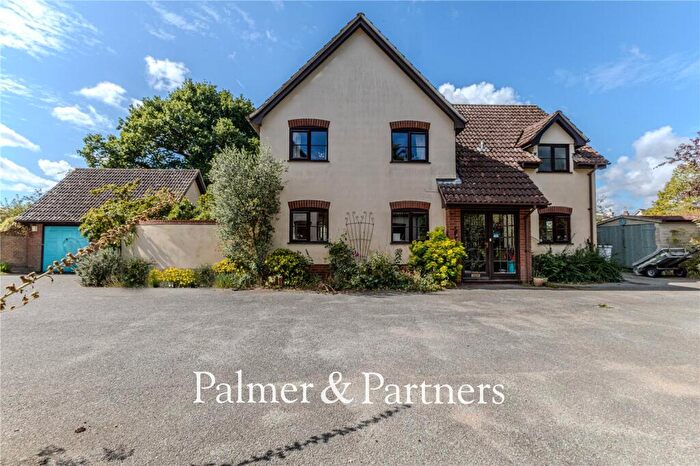
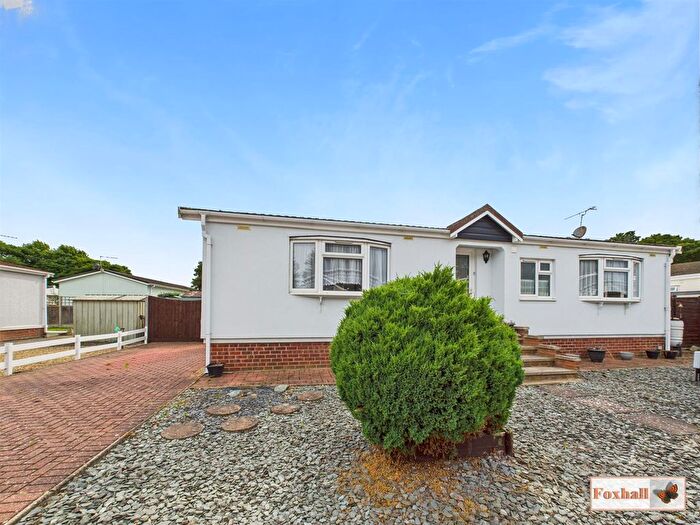
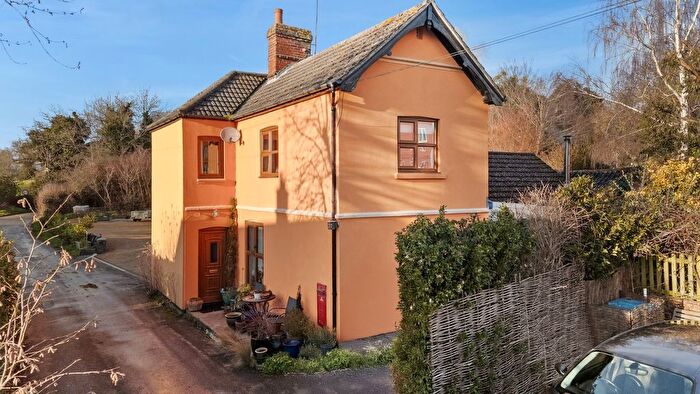
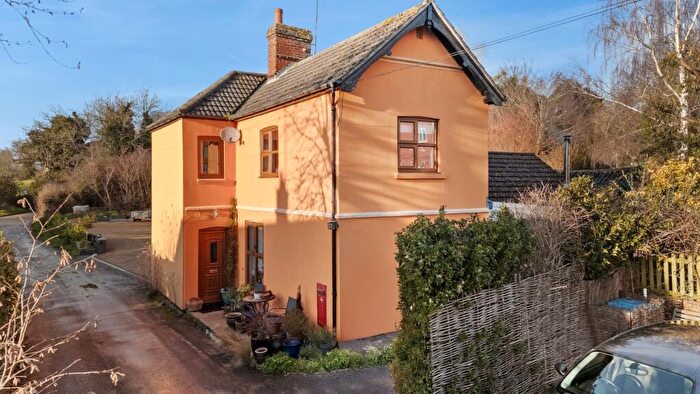
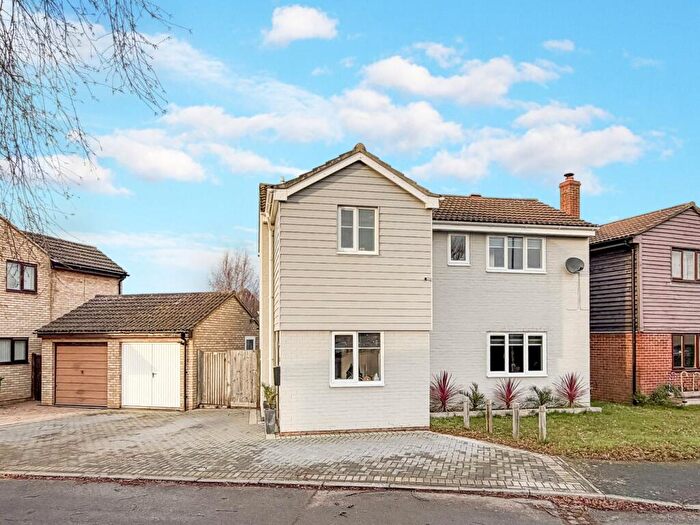
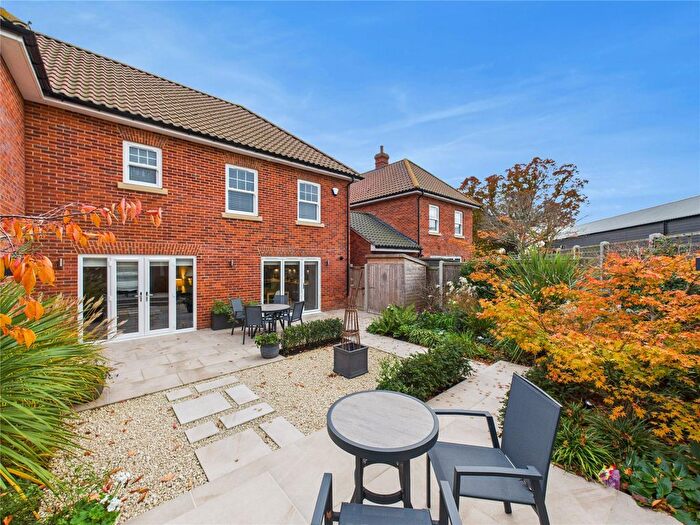
Houses for sale & to rent in Martlesham, Woodbridge
House Prices in Martlesham
Properties in Martlesham have an average house price of £540,750.00 and had 44 Property Transactions within the last 3 years¹.
Martlesham is an area in Woodbridge, Suffolk with 547 households², where the most expensive property was sold for £1,175,000.00.
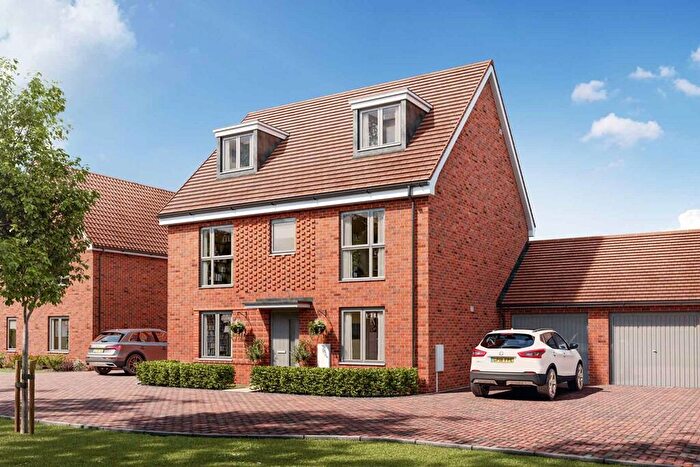
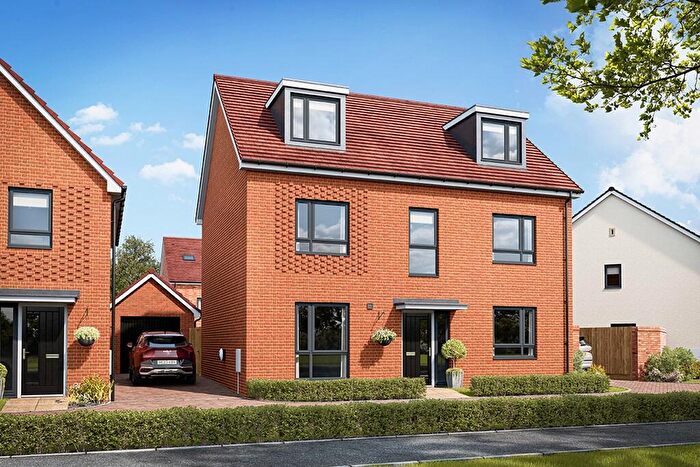
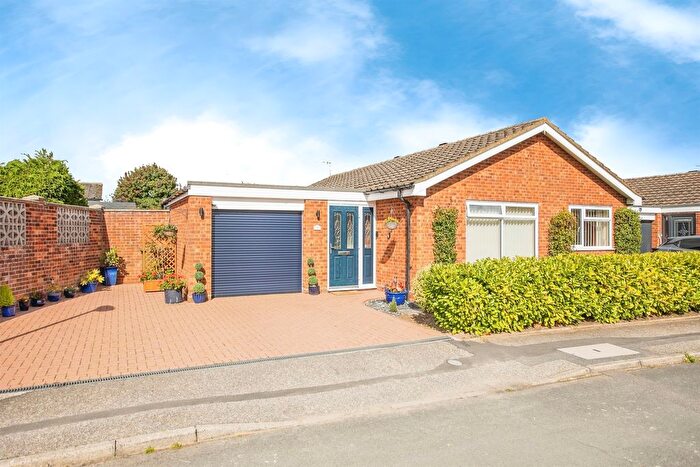
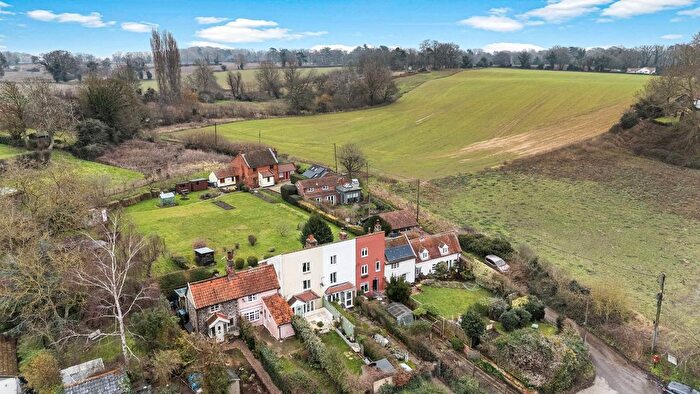
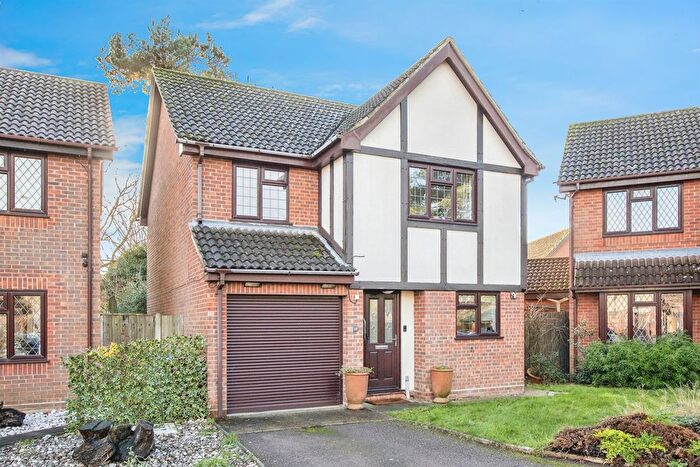
Properties for sale in Martlesham
Roads and Postcodes in Martlesham
Navigate through our locations to find the location of your next house in Martlesham, Woodbridge for sale or to rent.
| Streets | Postcodes |
|---|---|
| Alban Square | IP12 4TB |
| Angela Close | IP12 4TG |
| Bealings Road | IP12 4RW |
| Black Tiles Lane | IP12 4SP IP12 4SS IP12 4TQ |
| Bloomfield Farm Bungalows | IP12 4TD |
| Brock Lane | IP12 4RA |
| Buckingham Close | IP12 4SX |
| Carol Avenue | IP12 4SR |
| Chandos Court | IP12 4SU |
| Chandos Drive | IP12 4ST IP12 4TA |
| Church Lane | IP12 4PQ |
| Crown Close | IP12 4UH |
| Felixstowe Road | IP12 4PB IP12 4RX IP12 4RY |
| Green Lane | IP12 4SZ |
| Holfen Close | IP12 4TX |
| Laburnum Gardens | IP12 4TS |
| Main Road | IP12 4SE IP12 4SF IP12 4SJ IP12 4SL IP12 4SN IP12 4SQ IP12 4SW IP12 4TE |
| Newbourne Road | IP12 4PR |
| Nunn Close | IP12 4UL |
| Post Office Lane | IP12 4RQ |
| Private Road | IP12 4SG |
| Ravens Way | IP12 4SY |
| Redwold Close | IP12 4RL |
| Sandy Lane | IP12 4SD |
| School Lane | IP12 4RR IP12 4RS |
| Shaw Valley Road | IP12 4SH |
| The Street | IP12 4RF IP12 4RG IP12 4RH |
| Three Styles Lane | IP12 4PF |
| Top Street | IP12 4RB IP12 4RD |
| Valley View Rise | IP12 4UD |
| Viking Close | IP12 4RU |
| Viking Heights | IP12 4RT |
| Waldringfield Road | IP12 4PJ |
| IP12 4PG IP13 6LY |
Transport near Martlesham
- FAQ
- Price Paid By Year
- Property Type Price
Frequently asked questions about Martlesham
What is the average price for a property for sale in Martlesham?
The average price for a property for sale in Martlesham is £540,750. This amount is 28% higher than the average price in Woodbridge. There are 854 property listings for sale in Martlesham.
What streets have the most expensive properties for sale in Martlesham?
The streets with the most expensive properties for sale in Martlesham are Bealings Road at an average of £780,750, Holfen Close at an average of £728,750 and Main Road at an average of £715,909.
What streets have the most affordable properties for sale in Martlesham?
The streets with the most affordable properties for sale in Martlesham are Felixstowe Road at an average of £262,500, Chandos Court at an average of £376,250 and Green Lane at an average of £390,000.
Which train stations are available in or near Martlesham?
Some of the train stations available in or near Martlesham are Woodbridge, Melton and Derby Road.
Property Price Paid in Martlesham by Year
The average sold property price by year was:
| Year | Average Sold Price | Price Change |
Sold Properties
|
|---|---|---|---|
| 2025 | £563,944 | 9% |
9 Properties |
| 2024 | £514,500 | -9% |
19 Properties |
| 2023 | £558,875 | 15% |
16 Properties |
| 2022 | £477,388 | 15% |
18 Properties |
| 2021 | £405,035 | -41% |
31 Properties |
| 2020 | £573,088 | 33% |
17 Properties |
| 2019 | £383,083 | 4% |
12 Properties |
| 2018 | £366,749 | -3% |
20 Properties |
| 2017 | £377,793 | -2% |
17 Properties |
| 2016 | £384,575 | 11% |
20 Properties |
| 2015 | £342,683 | 1% |
27 Properties |
| 2014 | £338,952 | - |
21 Properties |
| 2013 | £338,796 | 13% |
16 Properties |
| 2012 | £294,321 | 9% |
14 Properties |
| 2011 | £266,722 | -26% |
27 Properties |
| 2010 | £335,475 | 13% |
22 Properties |
| 2009 | £293,438 | -12% |
24 Properties |
| 2008 | £327,192 | -3% |
13 Properties |
| 2007 | £337,727 | 22% |
24 Properties |
| 2006 | £264,966 | -27% |
29 Properties |
| 2005 | £335,542 | 26% |
26 Properties |
| 2004 | £246,850 | 20% |
27 Properties |
| 2003 | £196,304 | -2% |
23 Properties |
| 2002 | £199,973 | 32% |
21 Properties |
| 2001 | £135,908 | -12% |
25 Properties |
| 2000 | £151,922 | 21% |
20 Properties |
| 1999 | £120,135 | 10% |
42 Properties |
| 1998 | £107,620 | 2% |
12 Properties |
| 1997 | £104,992 | 15% |
26 Properties |
| 1996 | £88,831 | 12% |
33 Properties |
| 1995 | £78,605 | - |
14 Properties |
Property Price per Property Type in Martlesham
Here you can find historic sold price data in order to help with your property search.
The average Property Paid Price for specific property types in the last three years are:
| Property Type | Average Sold Price | Sold Properties |
|---|---|---|
| Semi Detached House | £415,200.00 | 5 Semi Detached Houses |
| Detached House | £603,000.00 | 34 Detached Houses |
| Terraced House | £243,000.00 | 5 Terraced Houses |

