
Houses for sale in IP2 0TT, Swallow Road, Sprites, Ipswich
House Prices in IP2 0TT, Swallow Road, Sprites
Properties in IP2 0TT have no sales history available within the last 3 years. IP2 0TT is a postcode in Swallow Road located in Sprites, an area in Ipswich, Suffolk, with 14 households².
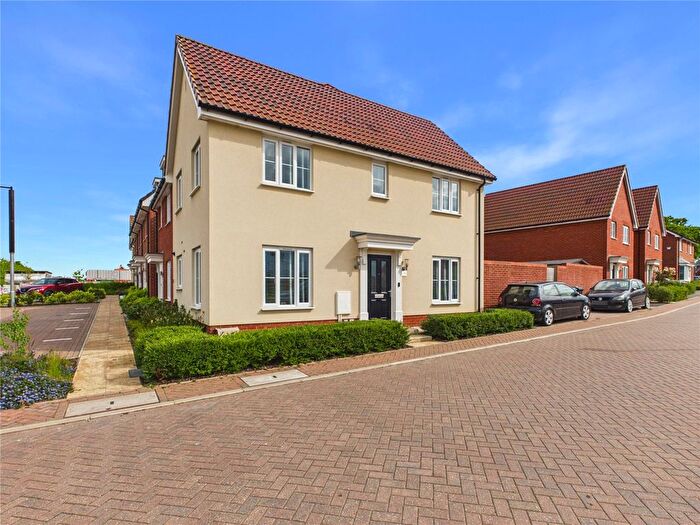
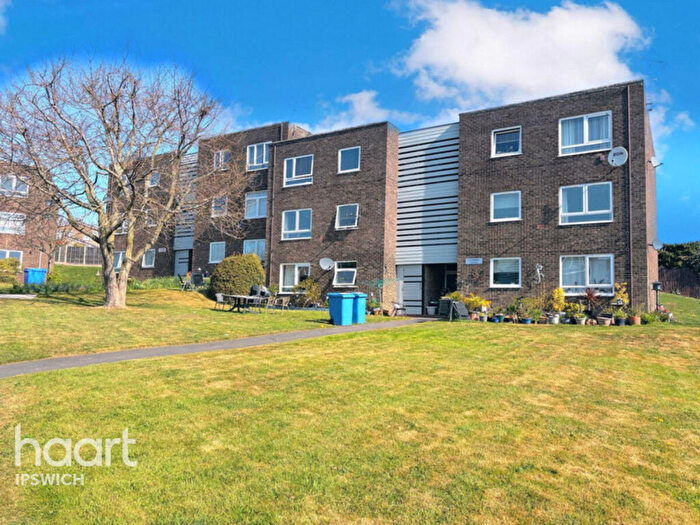
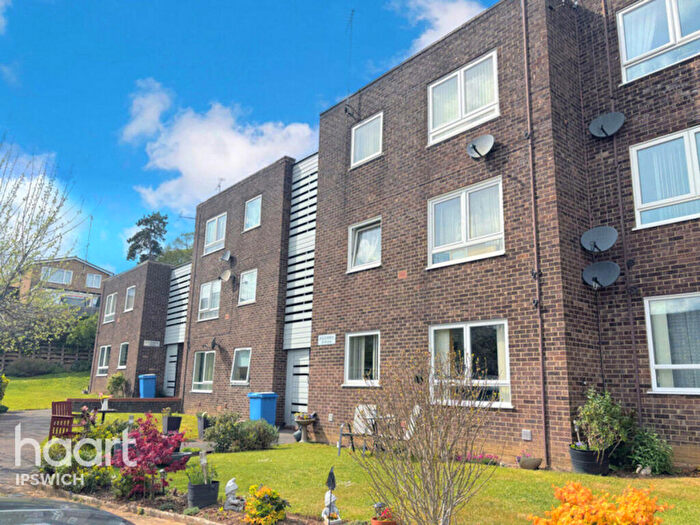
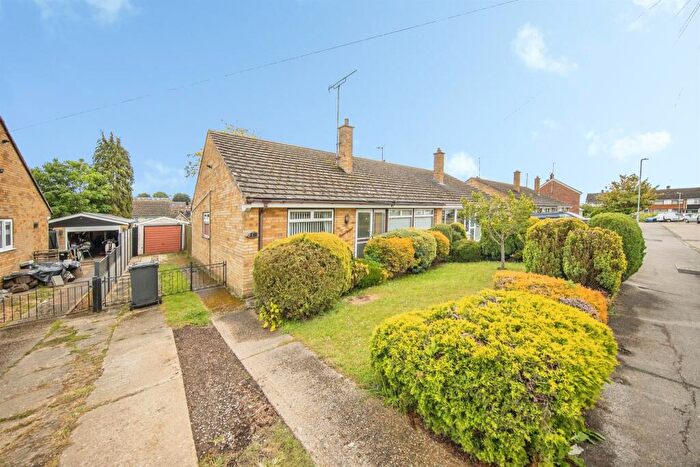
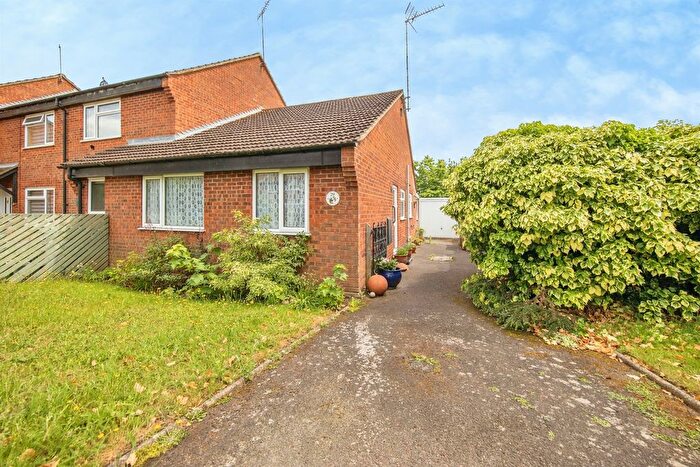
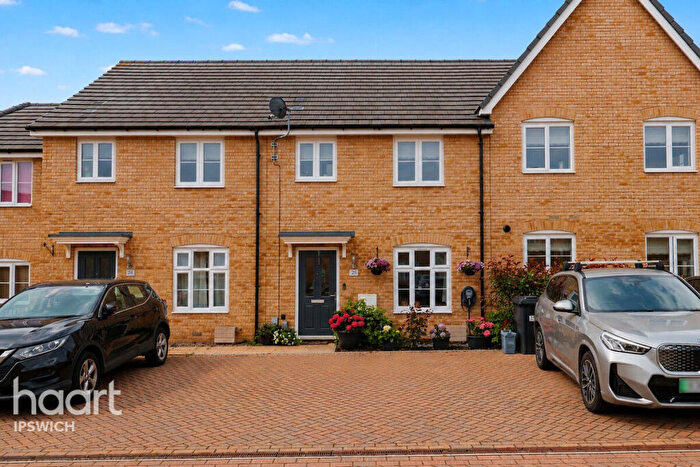
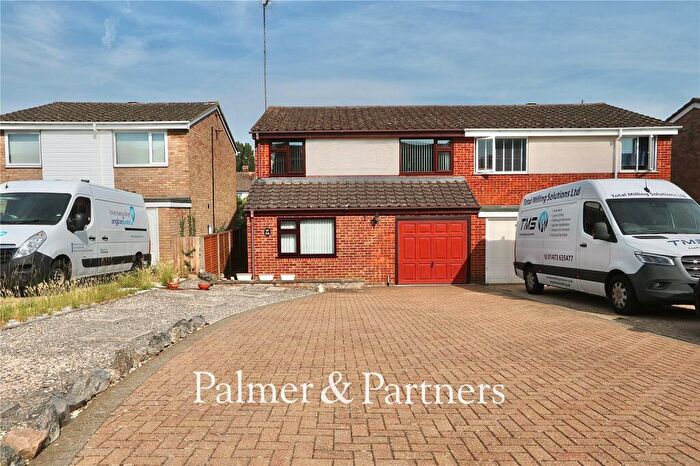
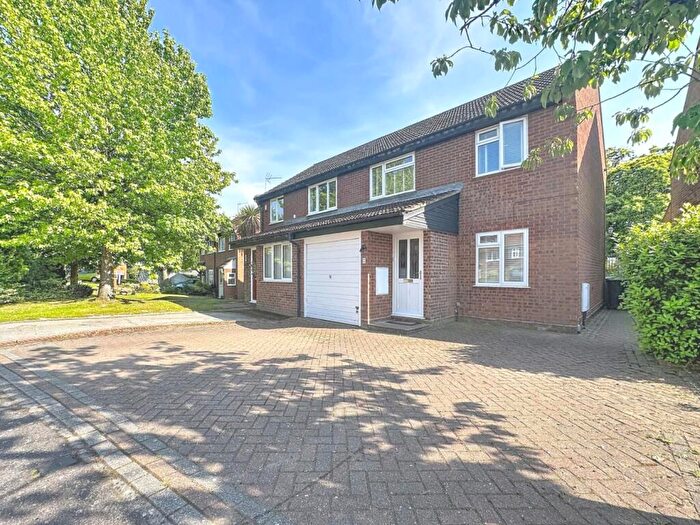
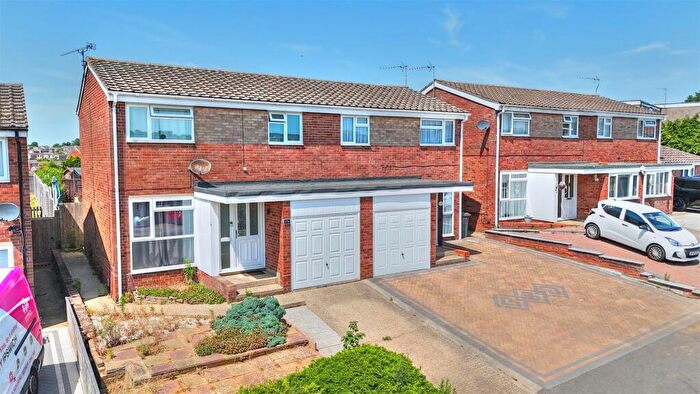
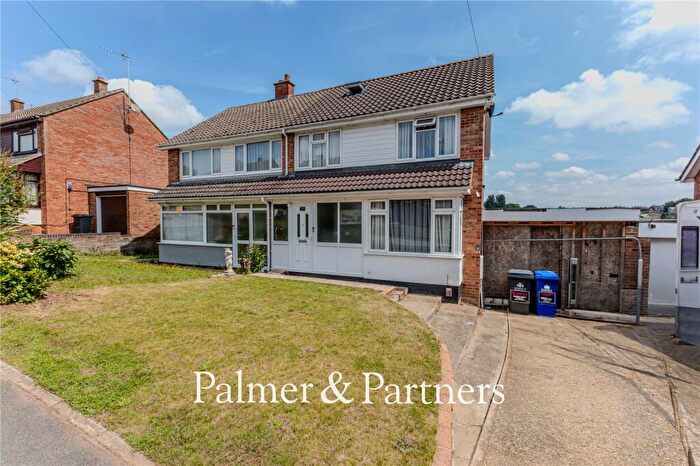
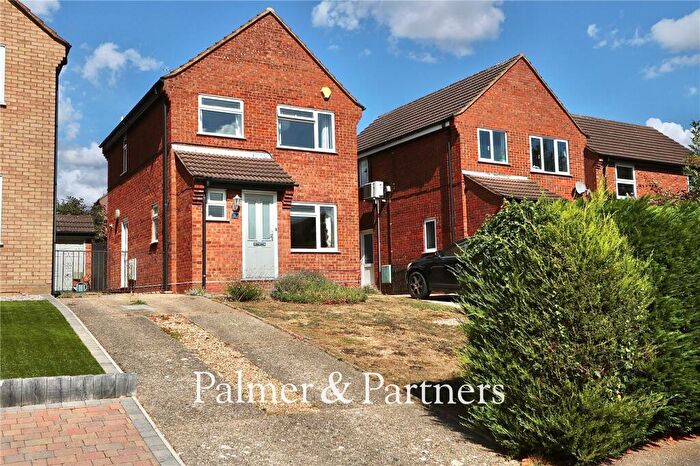
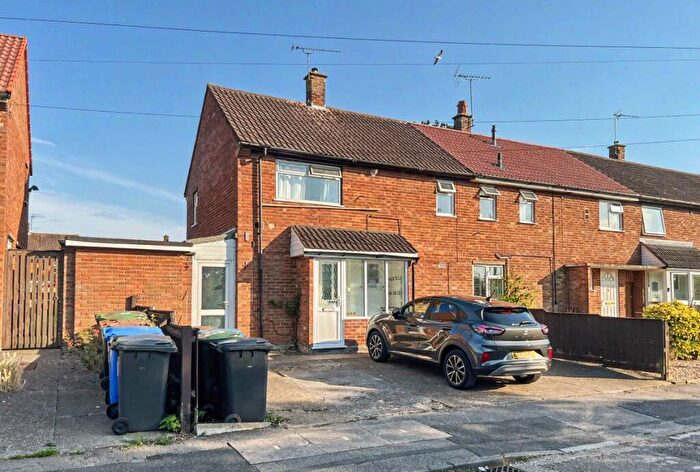
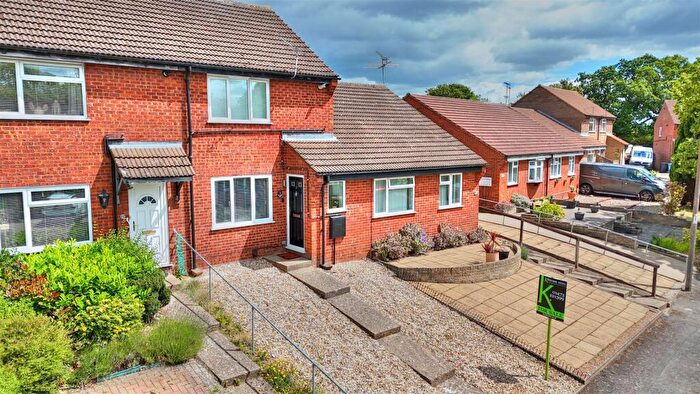
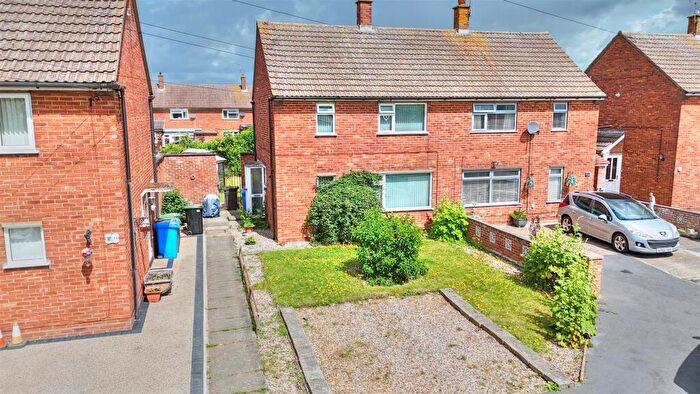
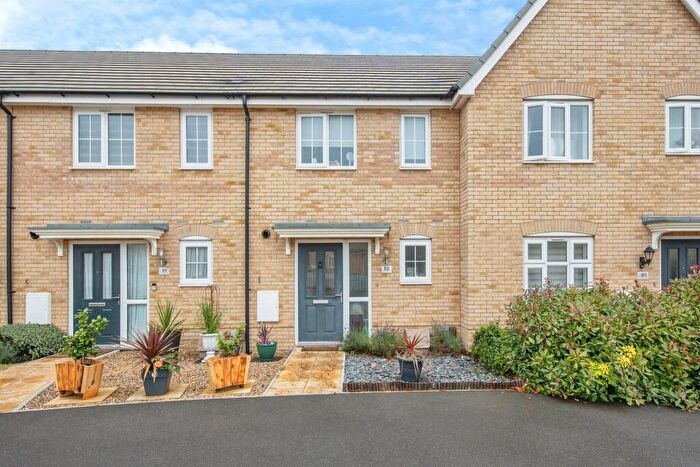
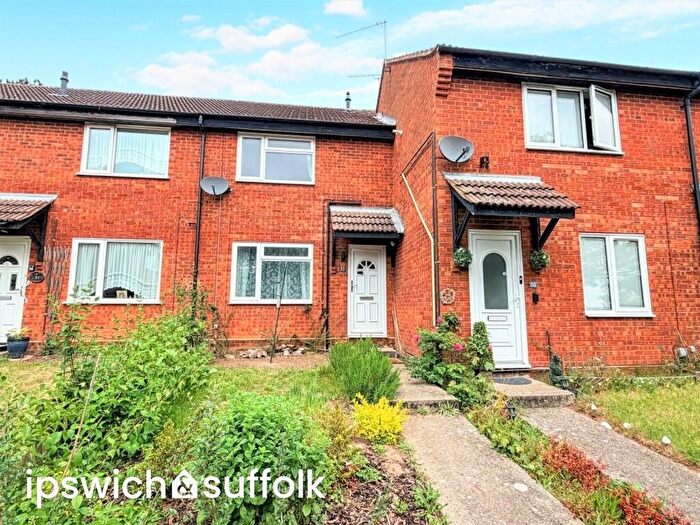
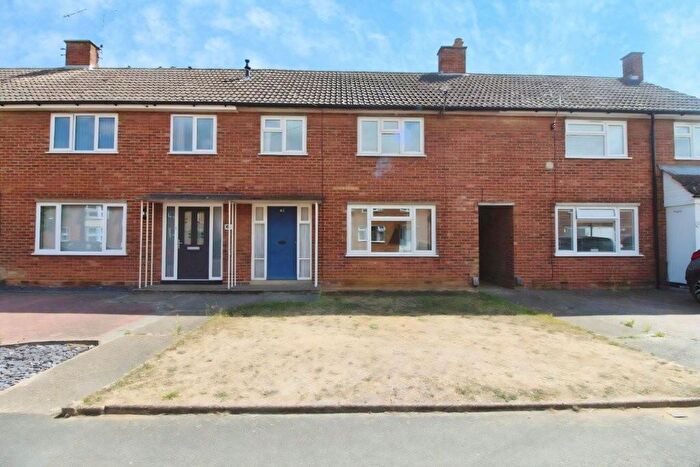
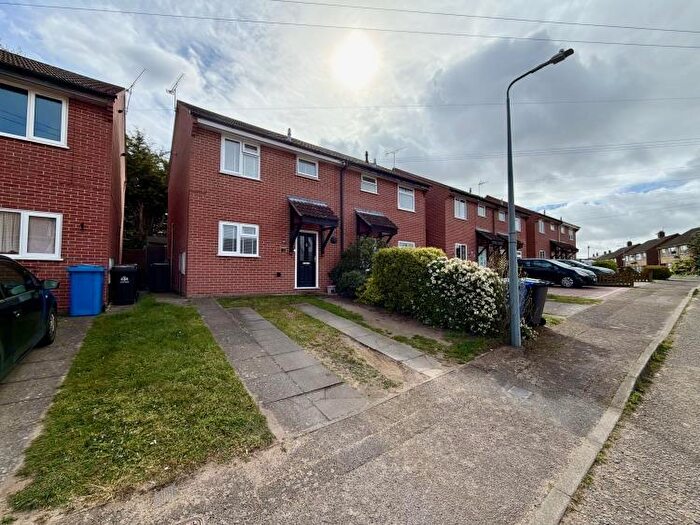
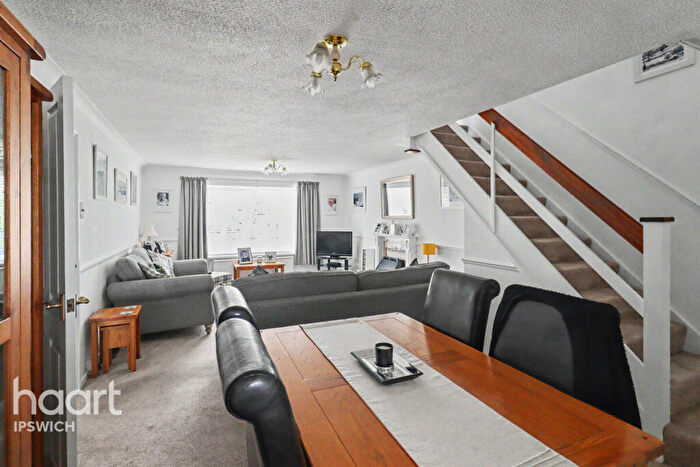
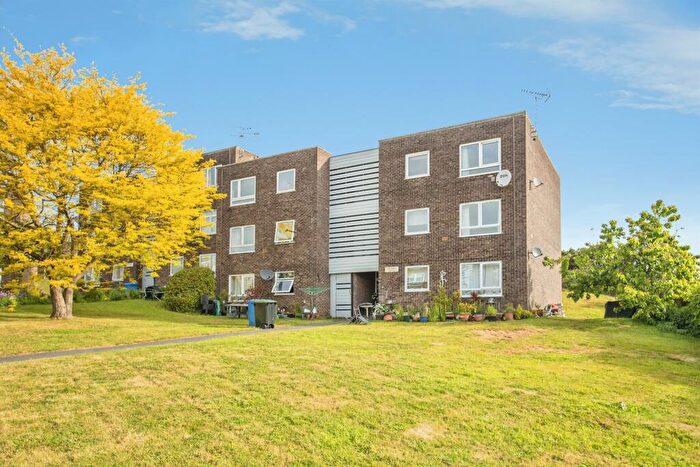
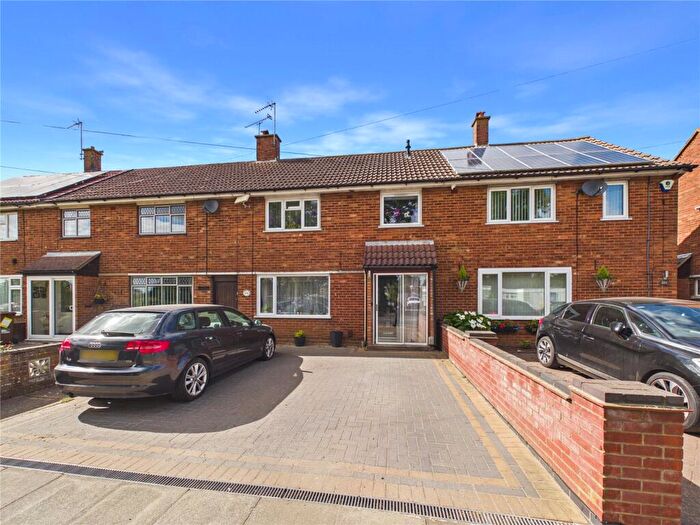
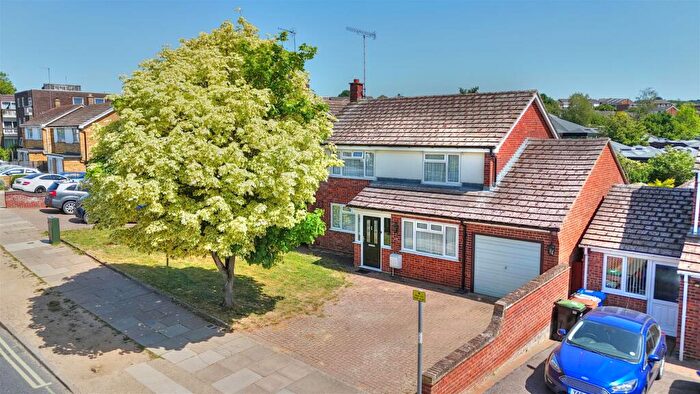
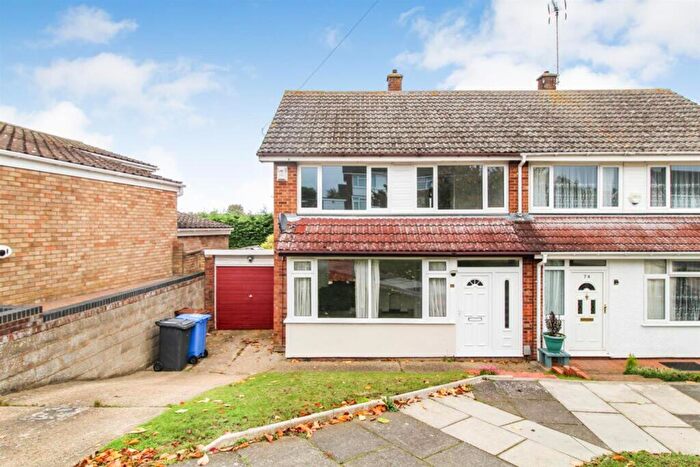
Properties for sale near IP2 0TT, Swallow Road
![]()
If you are looking to sell your house, let it out, or receive a property valuation, an expert can help you.
Click the button below to get started.

Price Paid in Swallow Road, IP2 0TT, Sprites
102 Swallow Road, IP2 0TT, Sprites Ipswich
Property 102 has been sold 1 time. The last time it was sold was in 19/07/2019 and the sold price was £180,000.00.
This semi detached house, sold as a freehold on 19/07/2019, is a 71 sqm semi-detached house with an EPC rating of C.
| Date | Price | Property Type | Tenure | Classification |
|---|---|---|---|---|
| 19/07/2019 | £180,000.00 | Semi Detached House | freehold | Established Building |
111 Swallow Road, IP2 0TT, Sprites Ipswich
Property 111 has been sold 1 time. The last time it was sold was in 31/07/2015 and the sold price was £160,000.00.
This terraced house, sold as a freehold on 31/07/2015, is a 76 sqm end-terrace house with an EPC rating of D.
| Date | Price | Property Type | Tenure | Classification |
|---|---|---|---|---|
| 31/07/2015 | £160,000.00 | Terraced House | freehold | Established Building |
104 Swallow Road, IP2 0TT, Sprites Ipswich
Property 104 has been sold 2 times. The last time it was sold was in 28/07/2006 and the sold price was £119,000.00.
This is a Semi Detached House which was sold as a freehold in 28/07/2006
| Date | Price | Property Type | Tenure | Classification |
|---|---|---|---|---|
| 28/07/2006 | £119,000.00 | Semi Detached House | freehold | Established Building |
| 27/08/1996 | £41,000.00 | Semi Detached House | freehold | Established Building |
119 Swallow Road, IP2 0TT, Sprites Ipswich
Property 119 has been sold 3 times. The last time it was sold was in 04/07/2006 and the sold price was £119,950.00.
This semi detached house, sold as a freehold on 04/07/2006, is a 71 sqm semi-detached house with an EPC rating of D.
| Date | Price | Property Type | Tenure | Classification |
|---|---|---|---|---|
| 04/07/2006 | £119,950.00 | Semi Detached House | freehold | Established Building |
| 28/11/2003 | £103,000.00 | Semi Detached House | freehold | Established Building |
| 02/09/1998 | £36,000.00 | Semi Detached House | freehold | Established Building |
109 Swallow Road, IP2 0TT, Sprites Ipswich
Property 109 has been sold 1 time. The last time it was sold was in 17/03/2005 and the sold price was £114,000.00.
This is a Terraced House which was sold as a freehold in 17/03/2005
| Date | Price | Property Type | Tenure | Classification |
|---|---|---|---|---|
| 17/03/2005 | £114,000.00 | Terraced House | freehold | Established Building |
117 Swallow Road, IP2 0TT, Sprites Ipswich
Property 117 has been sold 3 times. The last time it was sold was in 16/04/2003 and the sold price was £96,000.00.
This is a Terraced House which was sold as a freehold in 16/04/2003
| Date | Price | Property Type | Tenure | Classification |
|---|---|---|---|---|
| 16/04/2003 | £96,000.00 | Terraced House | freehold | Established Building |
| 14/12/2001 | £63,000.00 | Terraced House | freehold | Established Building |
| 31/03/1995 | £34,000.00 | Terraced House | freehold | Established Building |
107 Swallow Road, IP2 0TT, Sprites Ipswich
This is a 46 square meter End-terrace Bungalow with an EPC rating of C. Currently, there is no transaction history available for this property.
Postcodes in Swallow Road, Sprites
Navigate through other locations in Swallow Road, Sprites, Ipswich to see more property listings for sale or to rent.
Property price trends in IP2 0TT, Swallow Road
According to the latest Land Registry data, the average home in IP2 0TT, Swallow Road sold for £180,000 in 2019. That figure comes from 11 sales logged over the past 24 years.
Prices have continued to climb over the last three years. Compared with 2015, when the typical sale came in around £160,000, that's a rise of roughly 12.5%.
Looking back five years, average prices are up about 12.5% since 2015, a gain of around £20,000 in cash terms.
Property Price Paid in IP2 0TT, Swallow Road by Year
The average sold property price by year was:
| Year | Average Sold Price | Price Change |
Sold Properties
|
|---|---|---|---|
| 2019 | £180,000 | 11% |
1 Property |
| 2015 | £160,000 | 25% |
1 Property |
| 2006 | £119,475 | 5% |
2 Properties |
| 2005 | £114,000 | 13% |
1 Property |
| 2003 | £99,500 | 37% |
2 Properties |
| 2001 | £63,000 | 43% |
1 Property |
| 1998 | £36,000 | -14% |
1 Property |
| 1996 | £41,000 | 17% |
1 Property |
| 1995 | £34,000 | - |
1 Property |
