
Houses for sale in IP2 9TB, The Chestnuts, Sprites, Ipswich
House Prices in IP2 9TB, The Chestnuts, Sprites
Properties in IP2 9TB have no sales history available within the last 3 years. IP2 9TB is a postcode in The Chestnuts located in Sprites, an area in Ipswich, Suffolk, with 8 households².
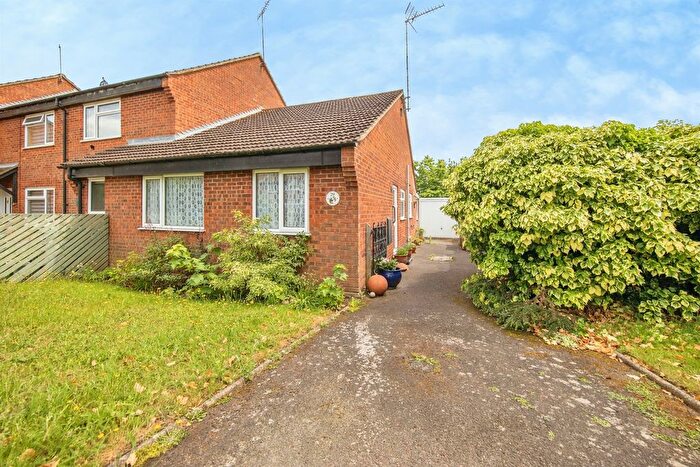
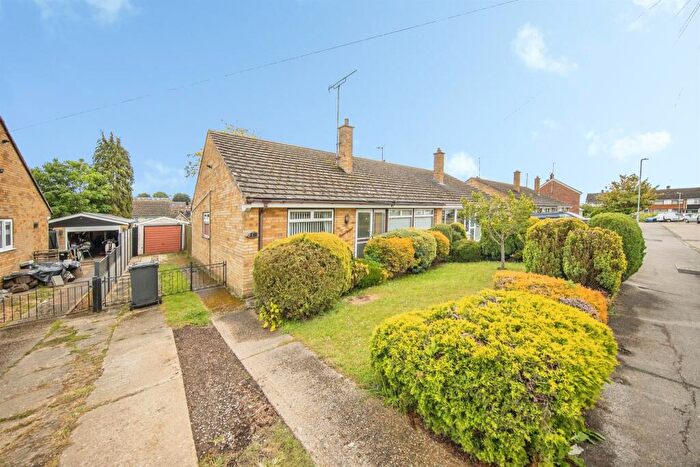
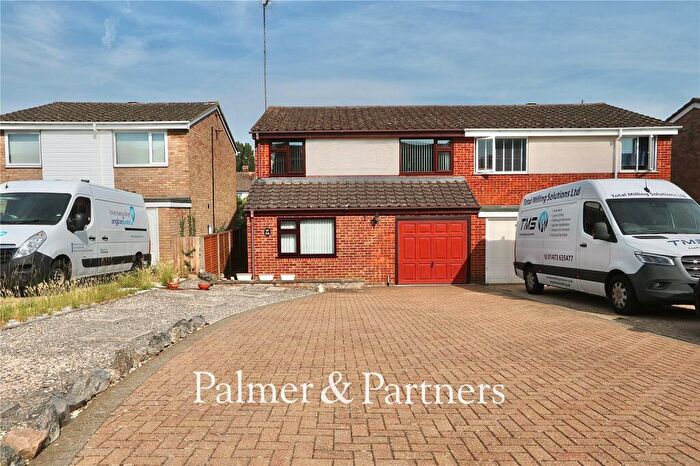
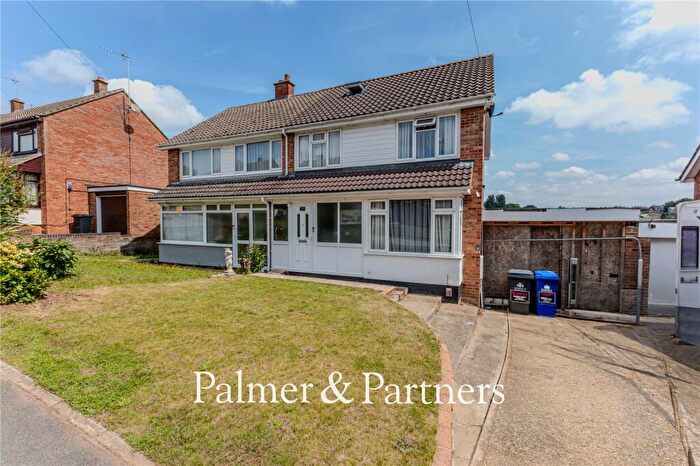
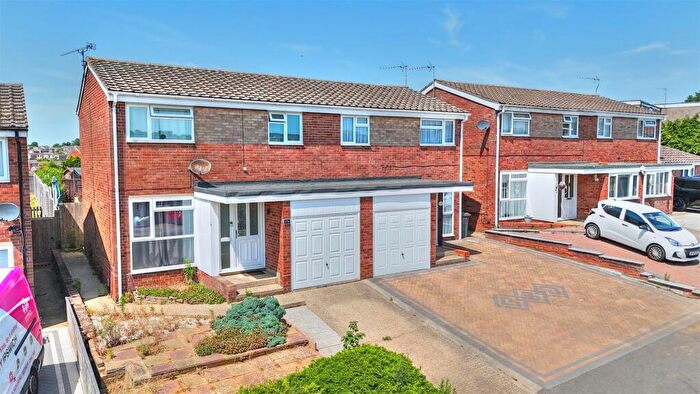
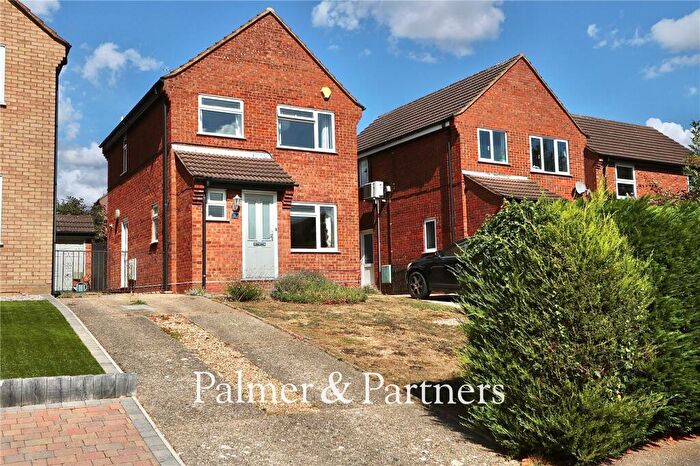
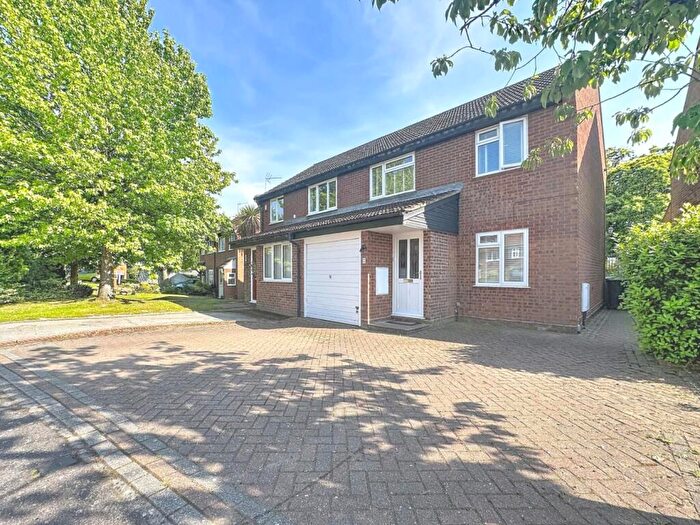
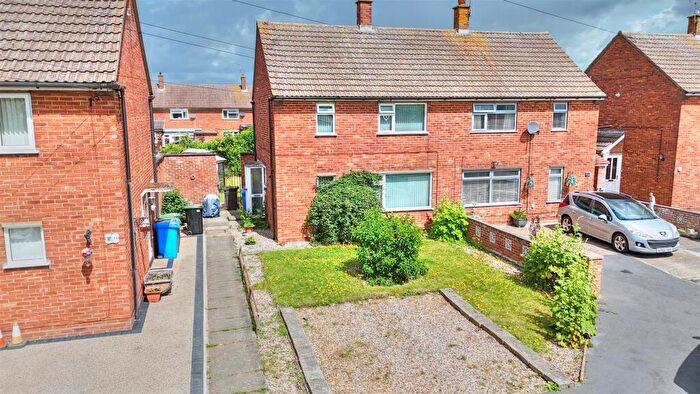
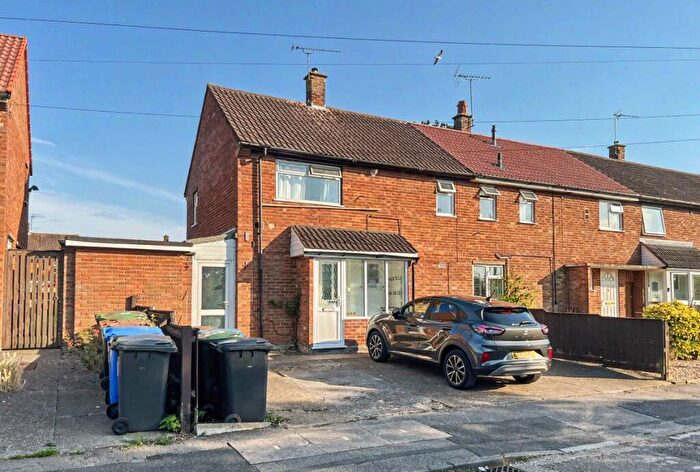
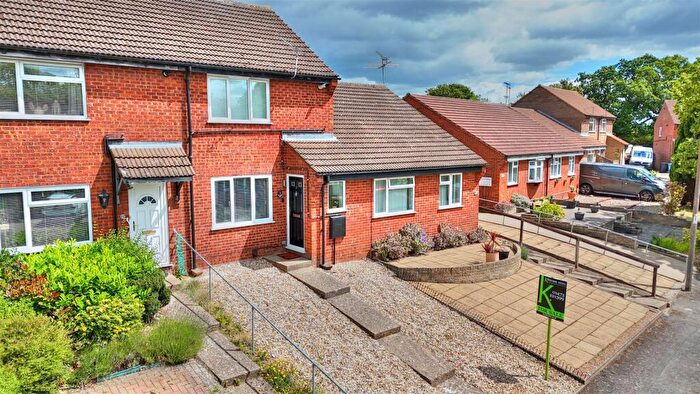
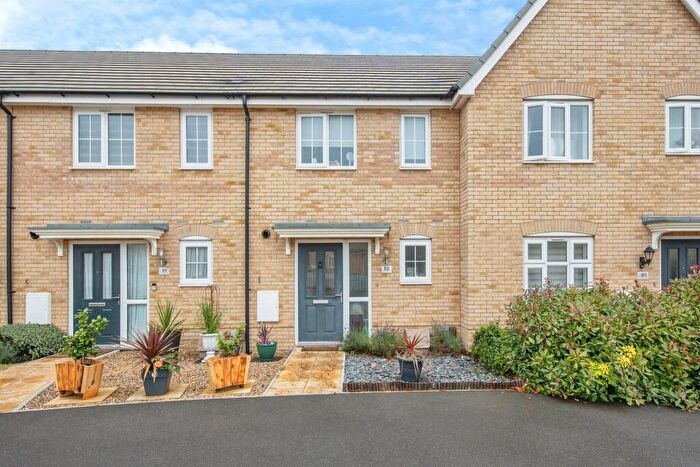
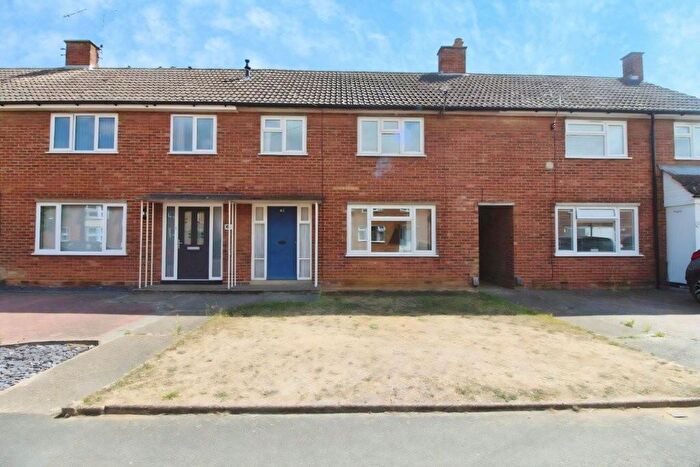
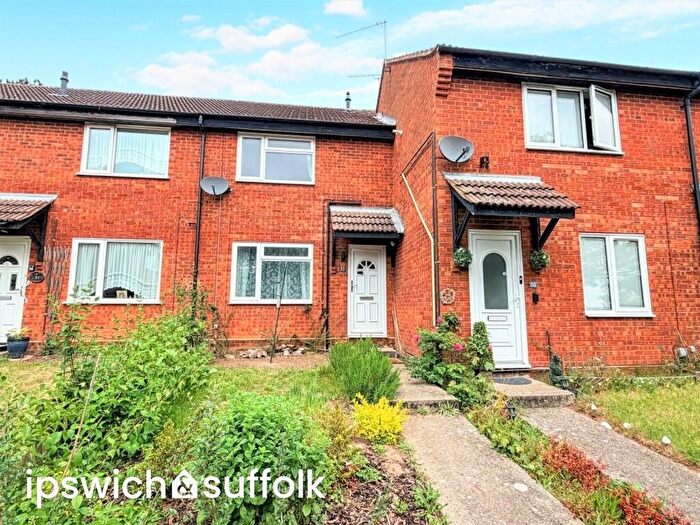
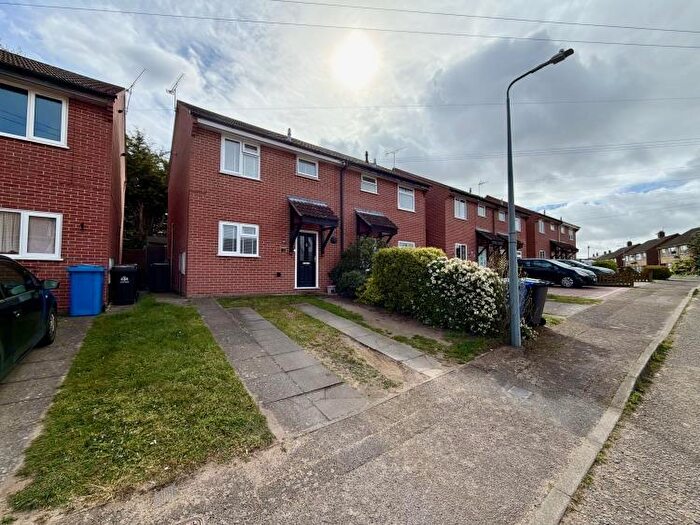
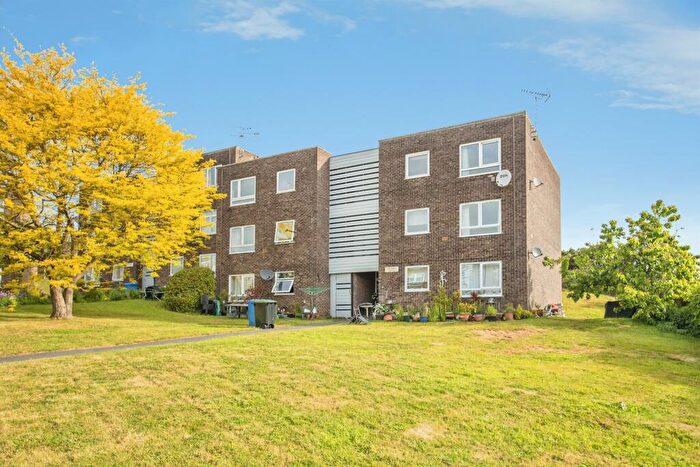
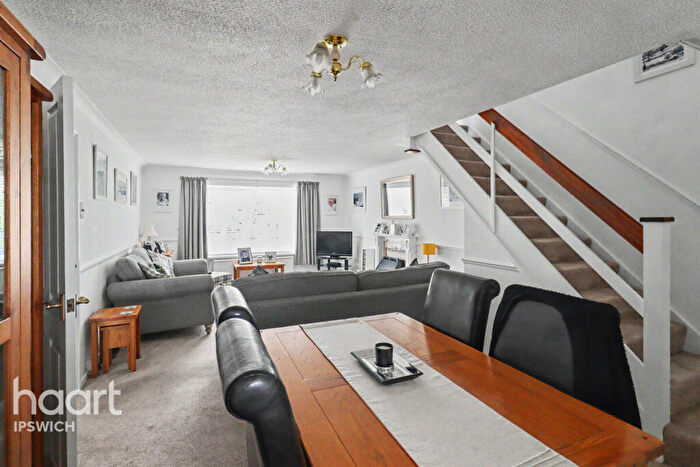
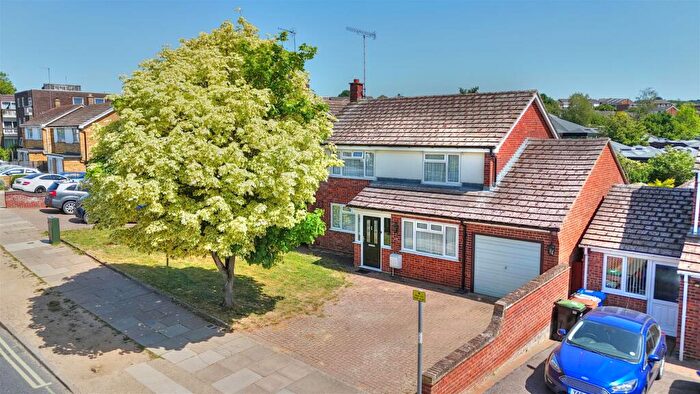
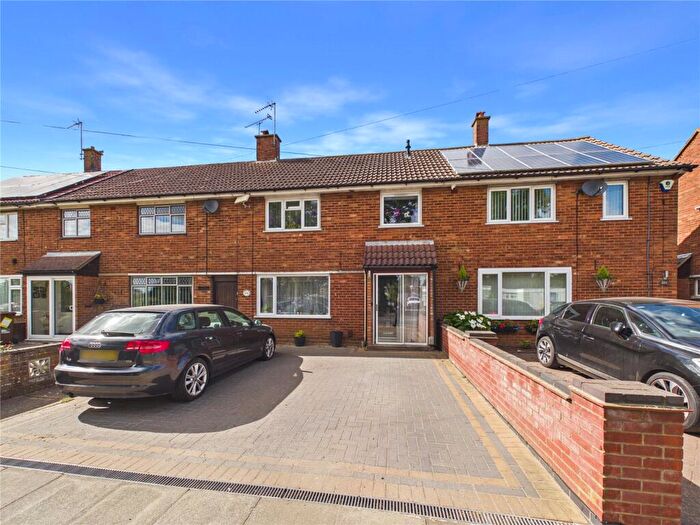
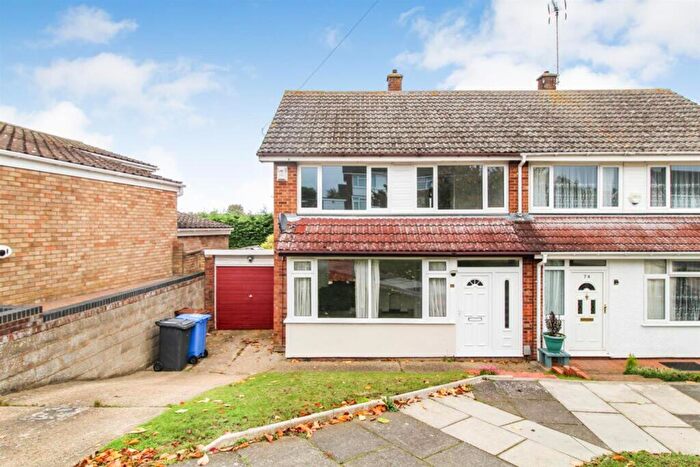
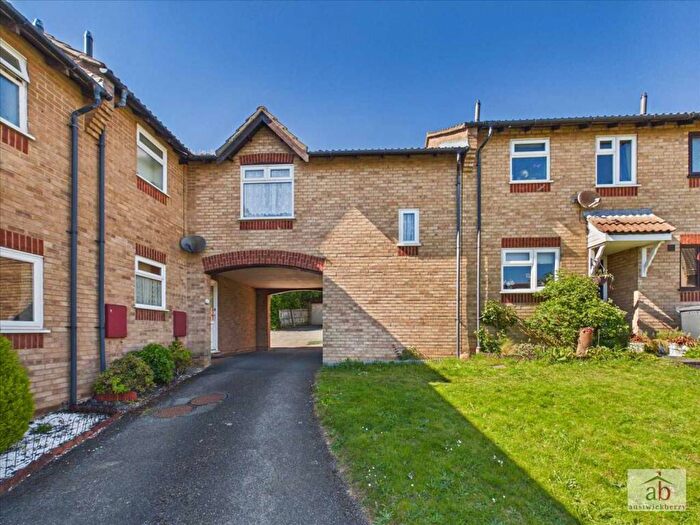
Properties for sale near IP2 9TB, The Chestnuts

![]()
If you are looking to sell your house, let it out, or receive a property valuation, an expert can help you.
Click the button below to get started.

Price Paid in The Chestnuts, IP2 9TB, Sprites
4 The Chestnuts, IP2 9TB, Sprites Ipswich
Property 4 has been sold 3 times. The last time it was sold was in 15/06/2018 and the sold price was £335,000.00.
This detached house, sold as a freehold on 15/06/2018, is a 116 sqm detached house with an EPC rating of E.
| Date | Price | Property Type | Tenure | Classification |
|---|---|---|---|---|
| 15/06/2018 | £335,000.00 | Detached House | freehold | Established Building |
| 16/12/2005 | £200,000.00 | Detached House | freehold | Established Building |
| 27/01/2000 | £85,950.00 | Detached House | freehold | Established Building |
3 The Chestnuts, IP2 9TB, Sprites Ipswich
Property 3 has been sold 2 times. The last time it was sold was in 01/09/2017 and the sold price was £350,000.00.
This detached house, sold as a freehold on 01/09/2017, is a 166 sqm detached house with an EPC rating of D.
| Date | Price | Property Type | Tenure | Classification |
|---|---|---|---|---|
| 01/09/2017 | £350,000.00 | Detached House | freehold | Established Building |
| 15/08/2005 | £185,000.00 | Detached House | freehold | Established Building |
6 The Chestnuts, IP2 9TB, Sprites Ipswich
Property 6 has been sold 2 times. The last time it was sold was in 18/11/2013 and the sold price was £220,000.00.
This detached house, sold as a freehold on 18/11/2013, is a 133 sqm detached house with an EPC rating of C.
| Date | Price | Property Type | Tenure | Classification |
|---|---|---|---|---|
| 18/11/2013 | £220,000.00 | Detached House | freehold | Established Building |
| 30/11/2001 | £142,000.00 | Detached House | freehold | Established Building |
Property price trends in IP2 9TB, The Chestnuts
According to the latest Land Registry data, the average home in IP2 9TB, The Chestnuts sold for £335,000 in 2018. That figure comes from 7 sales logged over the past 18 years.
Looking back five years, average prices are up about 52.3% since 2013, a gain of around £115,000 in cash terms.
Property Price Paid in IP2 9TB, The Chestnuts by Year
The average sold property price by year was:
| Year | Average Sold Price | Price Change |
Sold Properties
|
|---|---|---|---|
| 2018 | £335,000 | -4% |
1 Property |
| 2017 | £350,000 | 37% |
1 Property |
| 2013 | £220,000 | 13% |
1 Property |
| 2005 | £192,500 | 26% |
2 Properties |
| 2001 | £142,000 | 39% |
1 Property |
| 2000 | £85,950 | - |
1 Property |
