Houses for sale & to rent in All Saints, Newmarket
House Prices in All Saints
Properties in All Saints have an average house price of £284,427.00 and had 212 Property Transactions within the last 3 years¹.
All Saints is an area in Newmarket, Suffolk with 1,732 households², where the most expensive property was sold for £1,213,000.00.
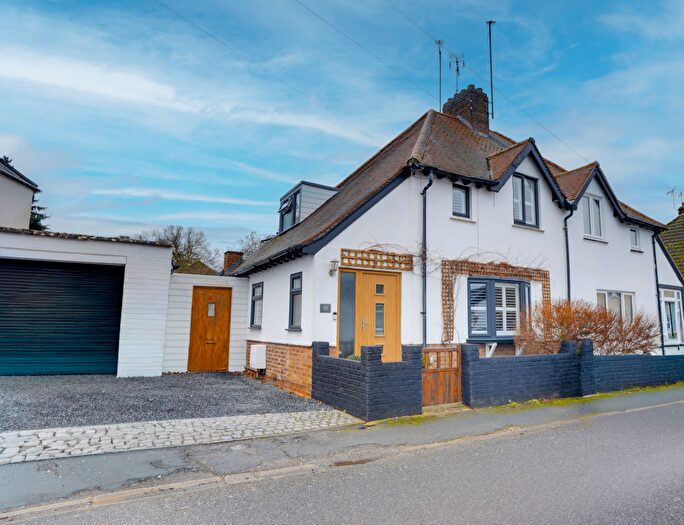
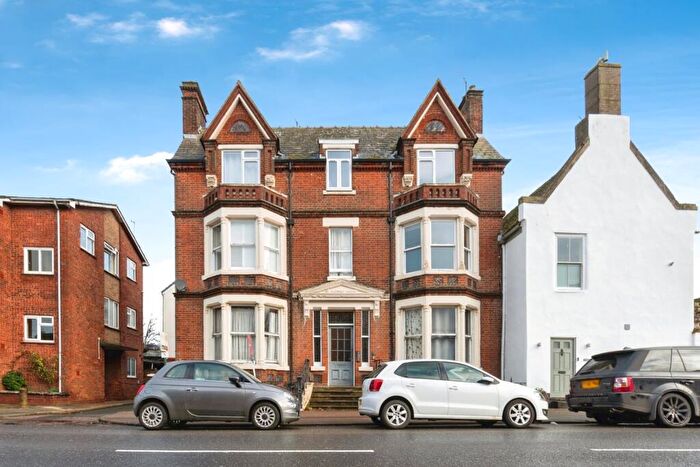
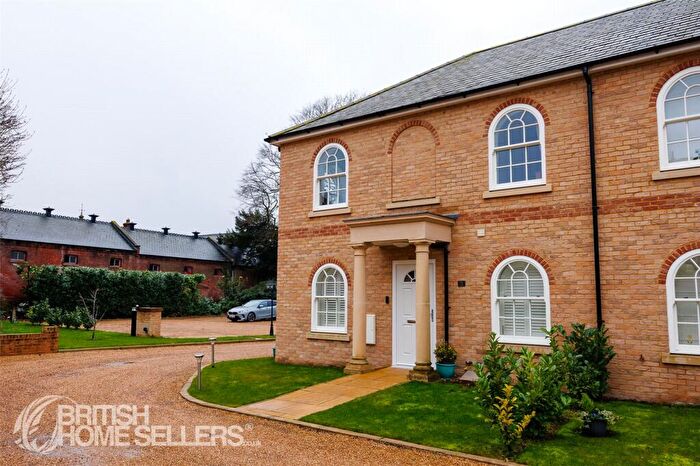
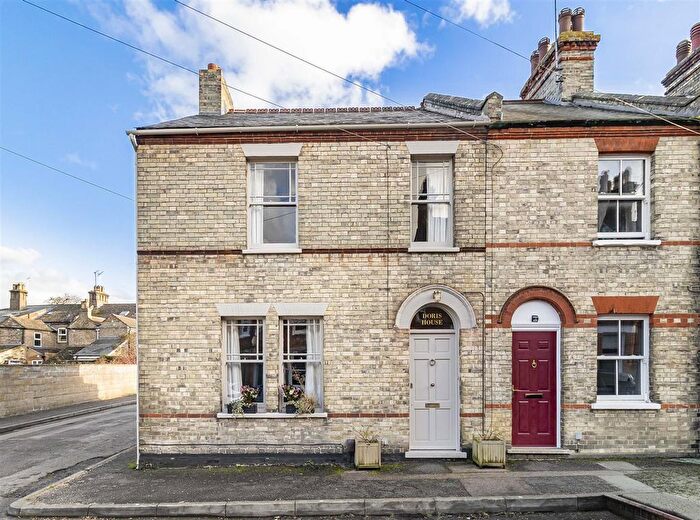
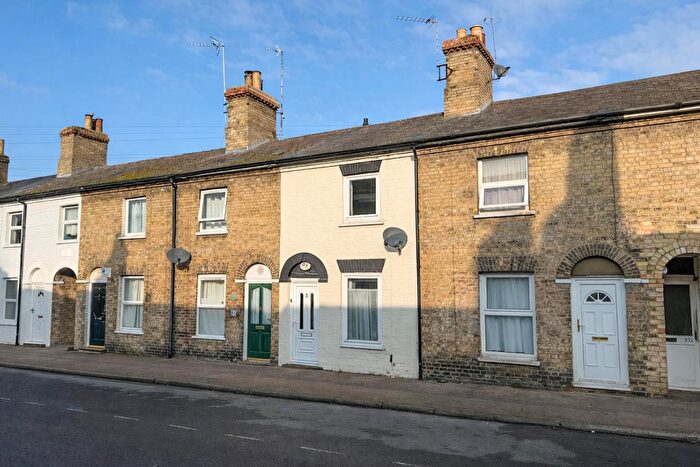
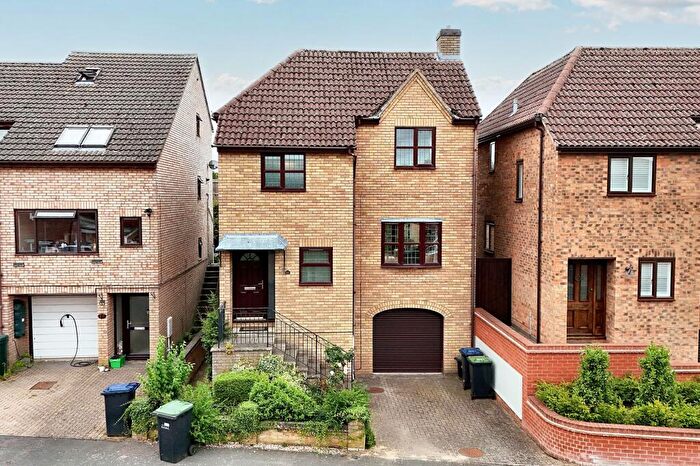
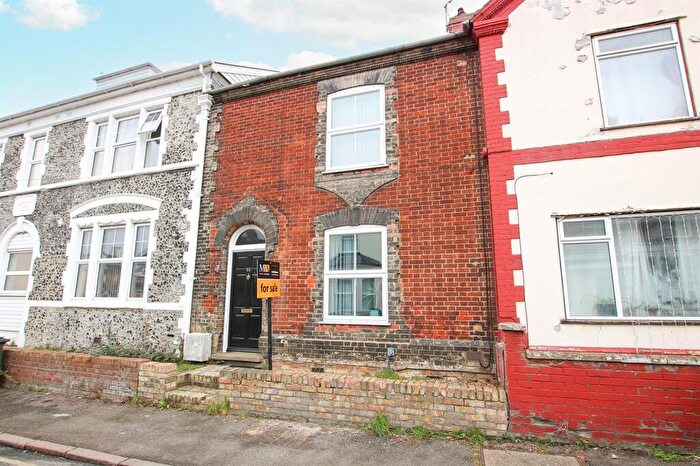
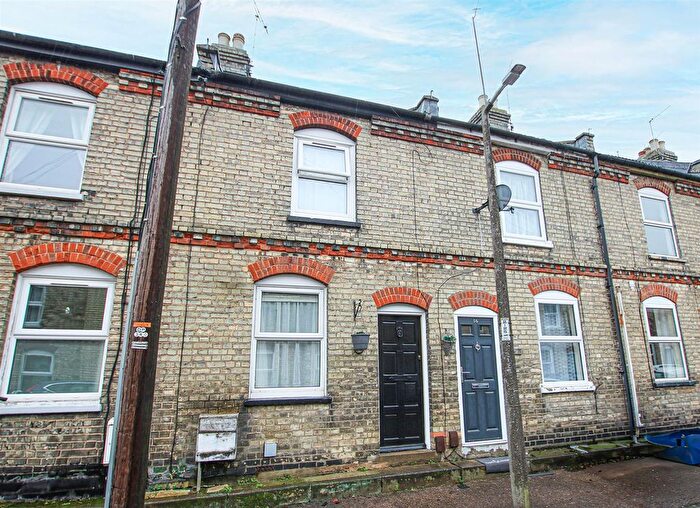
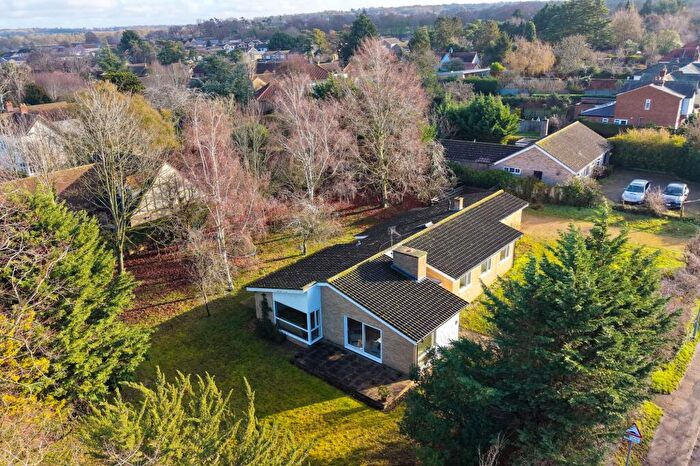
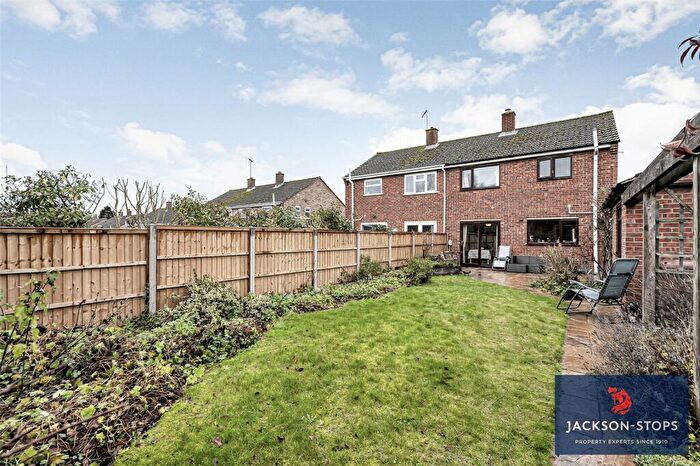
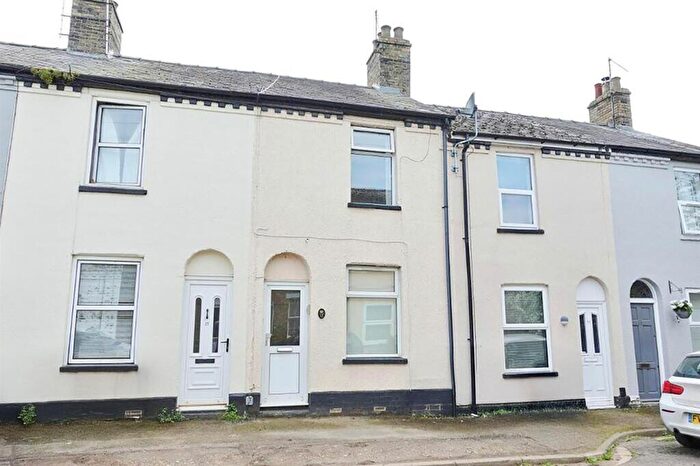
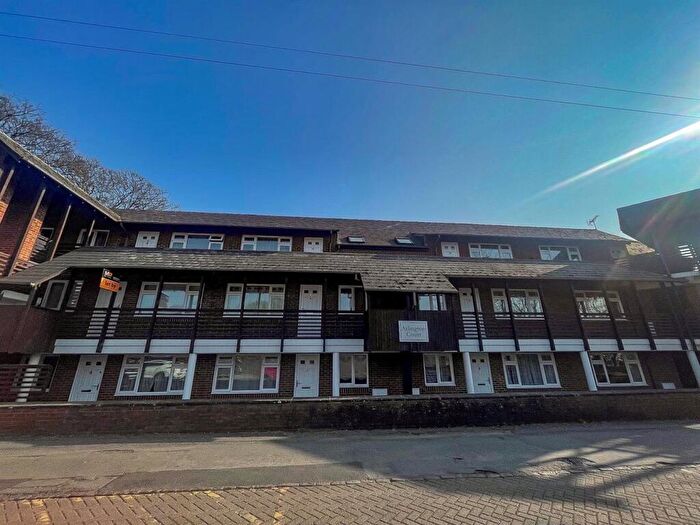
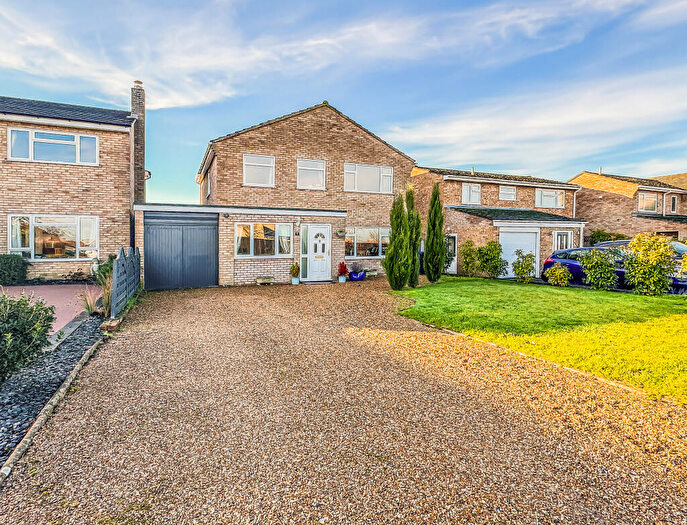
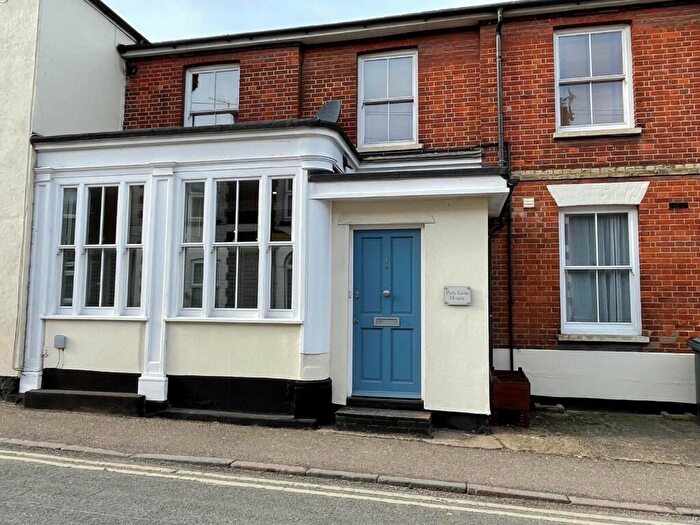
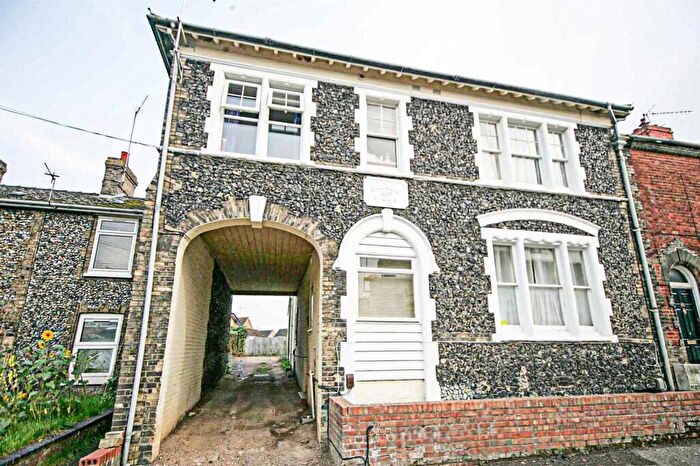
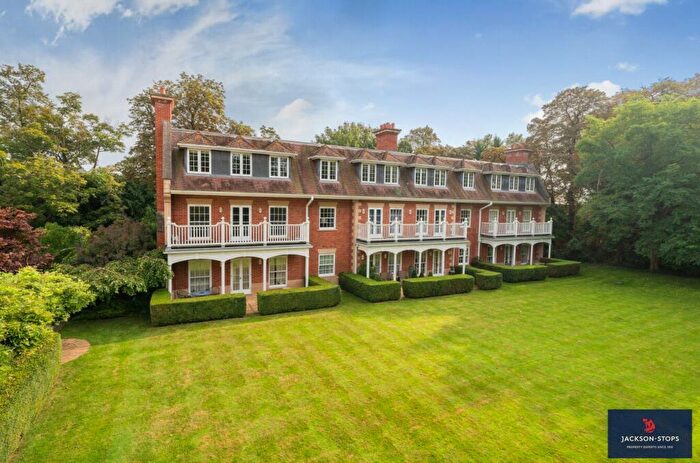
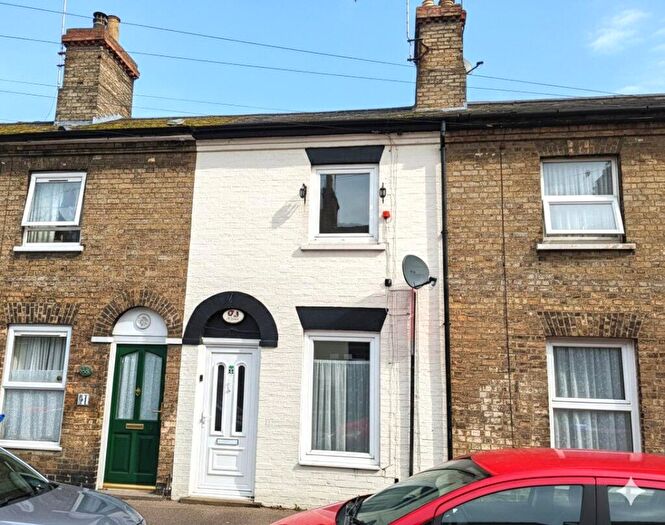
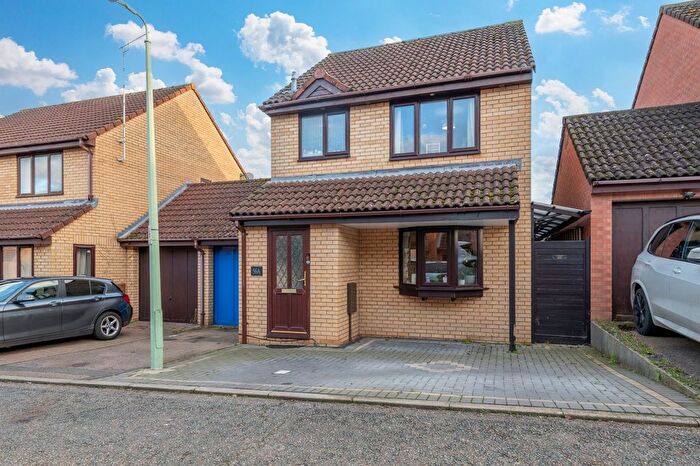
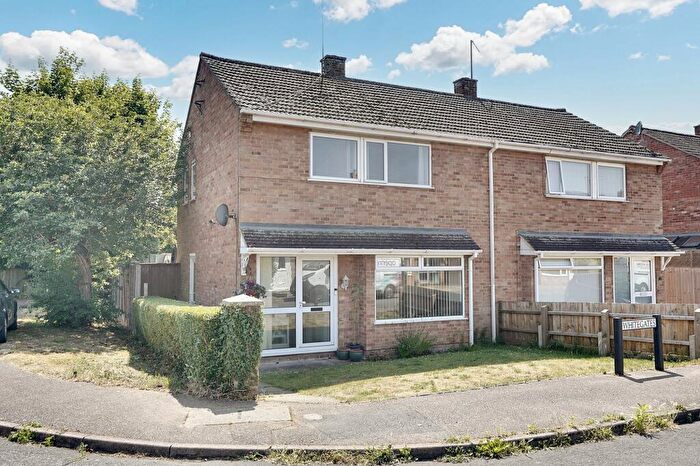
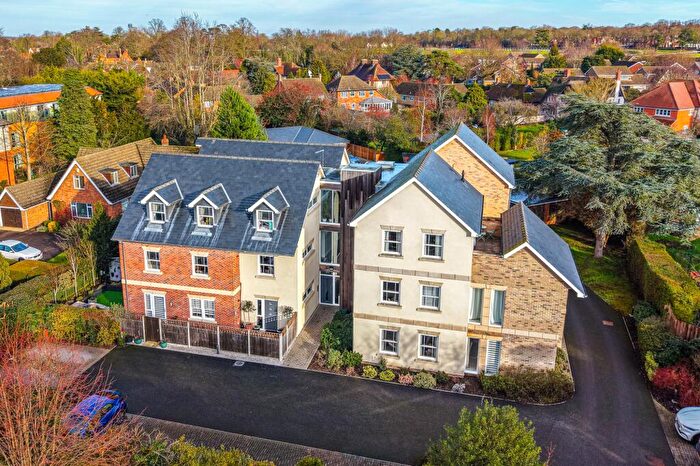
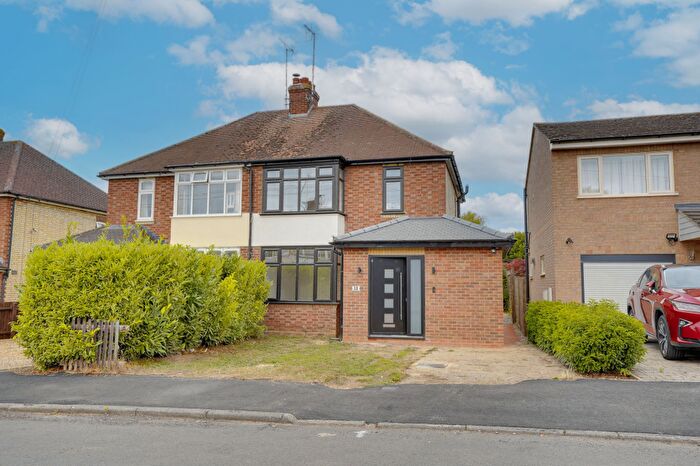
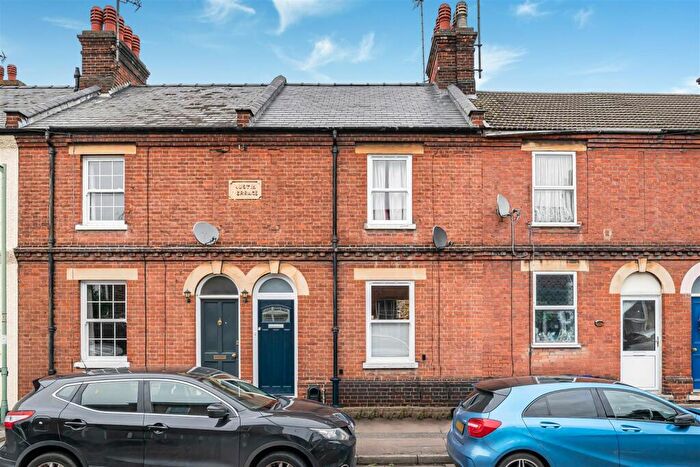
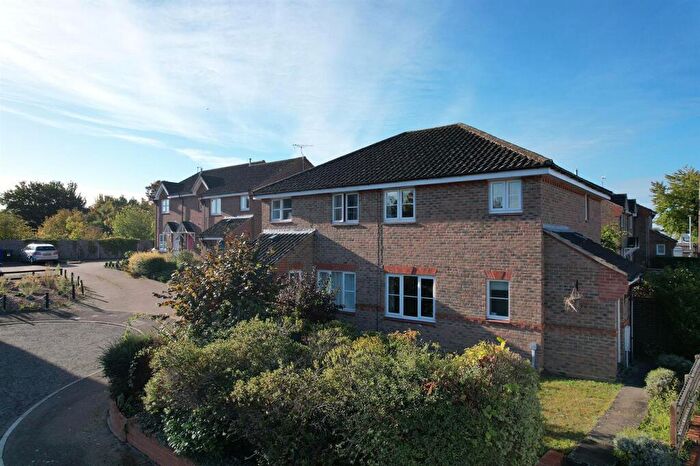
Properties for sale in All Saints
Roads and Postcodes in All Saints
Navigate through our locations to find the location of your next house in All Saints, Newmarket for sale or to rent.
| Streets | Postcodes |
|---|---|
| All Saints Road | CB8 8ES CB8 8ET CB8 8GH CB8 8HF CB8 8HH CB8 8HN |
| Armstrong Close | CB8 8HD |
| Barley Close | CB8 8GQ |
| Barry Lynham Drive | CB8 8YT CB8 8YU |
| Belmont Court | CB8 9BP |
| Boleyn Walk | CB8 8EJ |
| Bridlemere Court | CB8 9AT |
| Bunbury Terrace | CB8 8FL |
| Cardigan Street | CB8 8HZ |
| Cheveley Road | CB8 8AD CB8 8FD |
| Coronation Court | CB8 9BL |
| Cricket Field Road | CB8 8BT |
| Fairlawns | CB8 9JS |
| Glenwood Court | CB8 9AS |
| Granary Road | CB8 8GR |
| Granby Gardens | CB8 8HA |
| Granby Street | CB8 8EZ CB8 8HE CB8 8NS |
| Green Road | CB8 8BD CB8 8GJ CB8 9BA CB8 9BN |
| Greenfields | CB8 8DR |
| Hallwyck Gardens | CB8 9JR |
| Heath Road | CB8 8AB |
| Heath Villas | CB8 8DW |
| Heathbell Road | CB8 8AE |
| Heathcote Place | CB8 8GB |
| High Street | CB8 8JH CB8 8LX CB8 8NA CB8 9AG CB8 9AH |
| Hillside | CB8 8AY |
| Lisburn Road | CB8 8HS |
| Malt Close | CB8 8GP |
| Melton Close | CB8 8BE |
| Moulton Road | CB8 8DU |
| Murray Park | CB8 9BU |
| Nat Flatman Street | CB8 8HW |
| New Cheveley Road | CB8 8BU CB8 8BX CB8 8BY CB8 8BZ |
| Oakfield Place | CB8 8GA |
| Old Station Road | CB8 8AA CB8 8DN CB8 8DT CB8 8LA |
| Paddocks Drive | CB8 9BE |
| Palace Street | CB8 8EP |
| Park Avenue | CB8 8EY |
| Park Cottages | CB8 8BB |
| Park Lane | CB8 8AX CB8 8AZ |
| Queen Street | CB8 8EX |
| Queensberry Mews | CB8 9AE |
| Queensberry Road | CB8 9AU CB8 9BZ |
| Rous Road | CB8 8DH CB8 8DL |
| Sackville Street | CB8 8DX |
| Seymour Close | CB8 8EL |
| Sovereign Court | CB8 8JG |
| Stamford Street | CB8 8JB |
| Stanley Road | CB8 8AF |
| Station Approach | CB8 9BB |
| The Avenue | CB8 9AA CB8 9AY |
| Vicarage Road | CB8 8HP |
| Warrington Street | CB8 8BA |
| Whitegates | CB8 8DS |
| Willow Crescent | CB8 8ER |
Transport near All Saints
- FAQ
- Price Paid By Year
- Property Type Price
Frequently asked questions about All Saints
What is the average price for a property for sale in All Saints?
The average price for a property for sale in All Saints is £284,427. This amount is 17% lower than the average price in Newmarket. There are 472 property listings for sale in All Saints.
What streets have the most expensive properties for sale in All Saints?
The streets with the most expensive properties for sale in All Saints are Heath Road at an average of £1,213,000, Murray Park at an average of £1,100,000 and Heath Villas at an average of £610,000.
What streets have the most affordable properties for sale in All Saints?
The streets with the most affordable properties for sale in All Saints are Hillside at an average of £142,583, Green Road at an average of £169,416 and Warrington Street at an average of £173,150.
Which train stations are available in or near All Saints?
Some of the train stations available in or near All Saints are Newmarket, Dullingham and Kennett.
Property Price Paid in All Saints by Year
The average sold property price by year was:
| Year | Average Sold Price | Price Change |
Sold Properties
|
|---|---|---|---|
| 2025 | £283,696 | -2% |
66 Properties |
| 2024 | £288,305 | 3% |
80 Properties |
| 2023 | £280,458 | 4% |
66 Properties |
| 2022 | £268,728 | -11% |
105 Properties |
| 2021 | £298,194 | 21% |
97 Properties |
| 2020 | £236,066 | - |
59 Properties |
| 2019 | £236,128 | -5% |
68 Properties |
| 2018 | £246,954 | -7% |
70 Properties |
| 2017 | £264,790 | 4% |
95 Properties |
| 2016 | £253,902 | 9% |
92 Properties |
| 2015 | £230,442 | 16% |
105 Properties |
| 2014 | £194,540 | -2% |
117 Properties |
| 2013 | £199,361 | 4% |
92 Properties |
| 2012 | £192,372 | -3% |
77 Properties |
| 2011 | £199,045 | 10% |
88 Properties |
| 2010 | £178,474 | 3% |
59 Properties |
| 2009 | £172,485 | -19% |
56 Properties |
| 2008 | £204,921 | -6% |
73 Properties |
| 2007 | £217,593 | 5% |
152 Properties |
| 2006 | £206,785 | 3% |
168 Properties |
| 2005 | £200,006 | 20% |
145 Properties |
| 2004 | £159,910 | 12% |
192 Properties |
| 2003 | £140,731 | 6% |
141 Properties |
| 2002 | £132,235 | 25% |
157 Properties |
| 2001 | £99,351 | -6% |
130 Properties |
| 2000 | £104,842 | 29% |
115 Properties |
| 1999 | £74,438 | 14% |
146 Properties |
| 1998 | £64,029 | -8% |
126 Properties |
| 1997 | £68,993 | 3% |
165 Properties |
| 1996 | £66,966 | 1% |
129 Properties |
| 1995 | £66,573 | - |
122 Properties |
Property Price per Property Type in All Saints
Here you can find historic sold price data in order to help with your property search.
The average Property Paid Price for specific property types in the last three years are:
| Property Type | Average Sold Price | Sold Properties |
|---|---|---|
| Semi Detached House | £347,671.00 | 36 Semi Detached Houses |
| Detached House | £556,069.00 | 18 Detached Houses |
| Terraced House | £252,117.00 | 121 Terraced Houses |
| Flat | £196,405.00 | 37 Flats |

