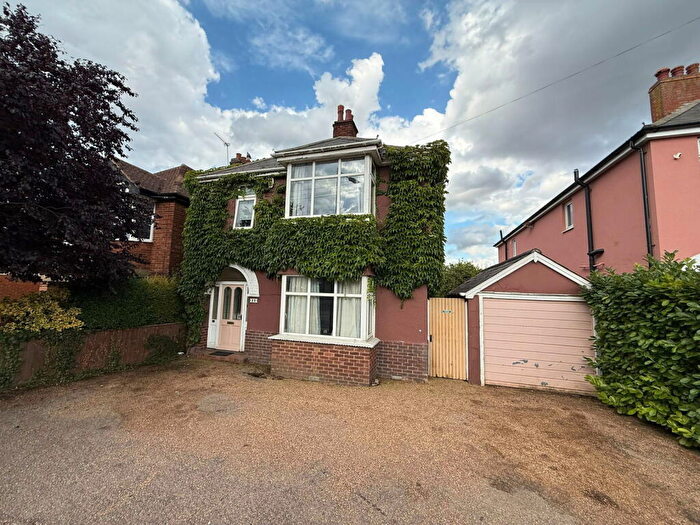
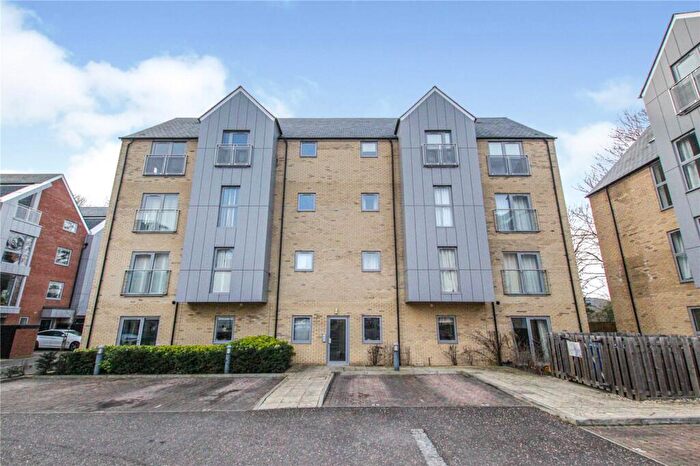
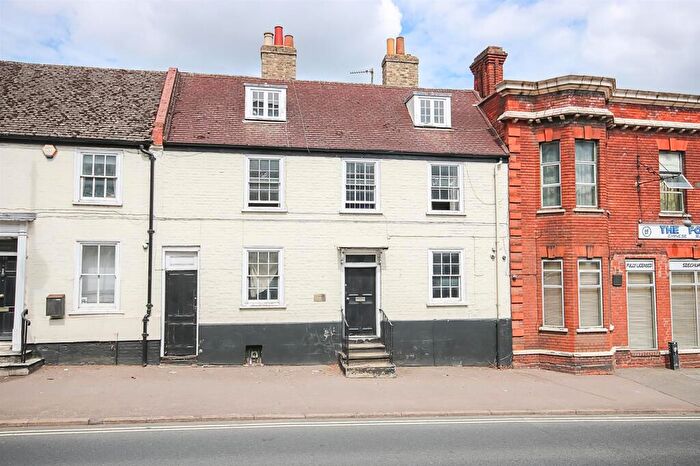
Houses for sale & to rent in St Marys, Newmarket
House Prices in St Marys
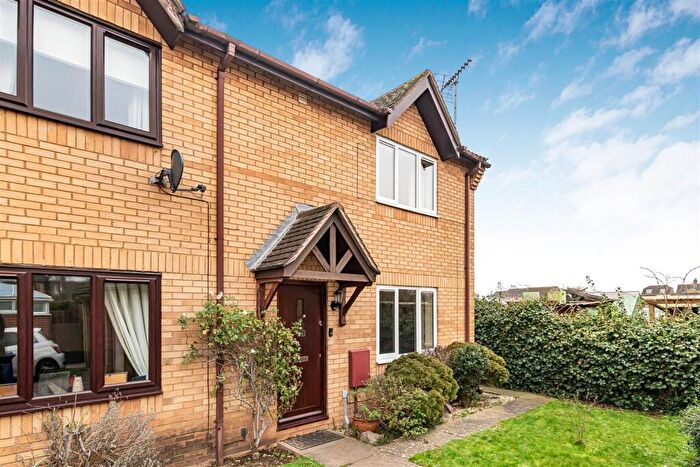
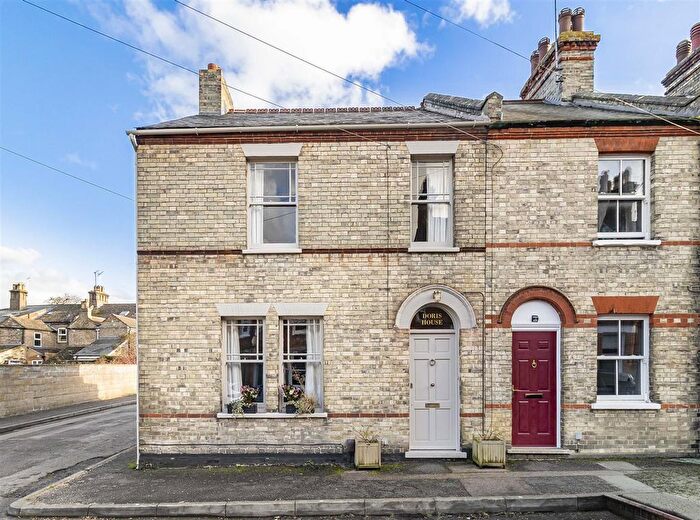
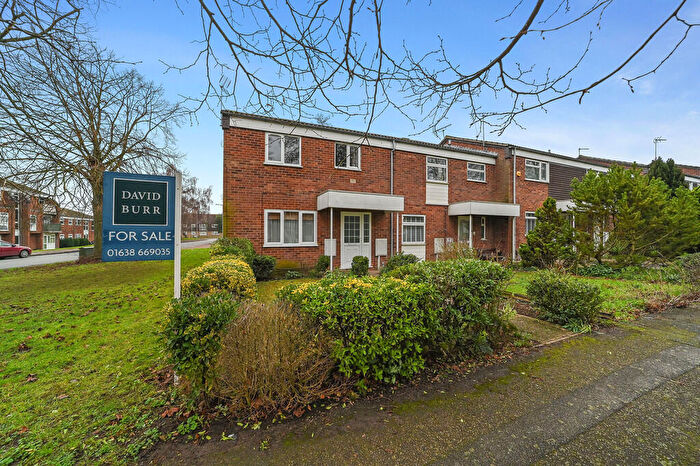
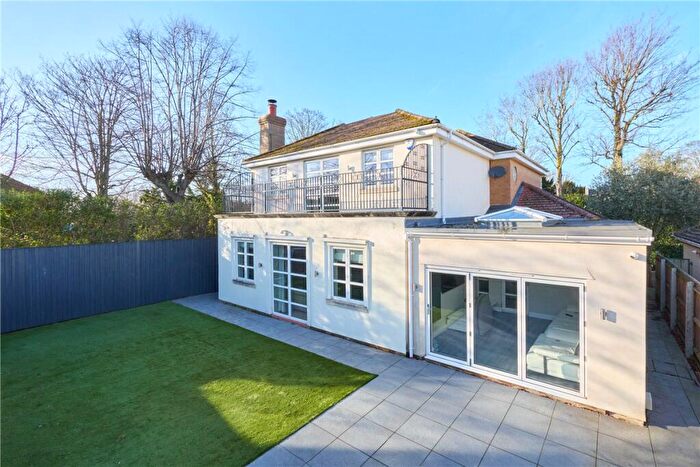
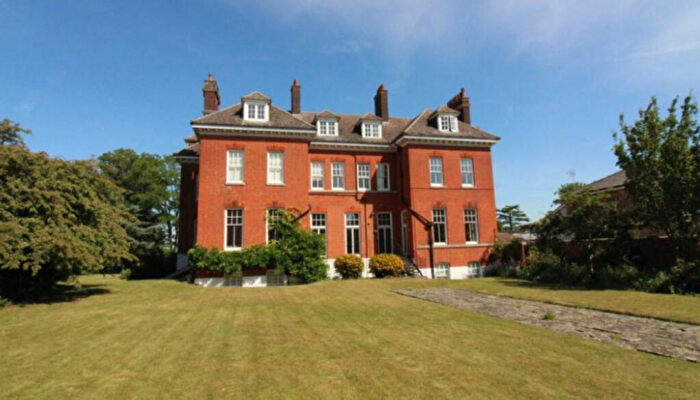
Properties in St Marys have an average house price of £284,555.00 and had 246 Property Transactions within the last 3 years¹.
St Marys is an area in Newmarket, Suffolk with 2,431 households², where the most expensive property was sold for £905,000.00.
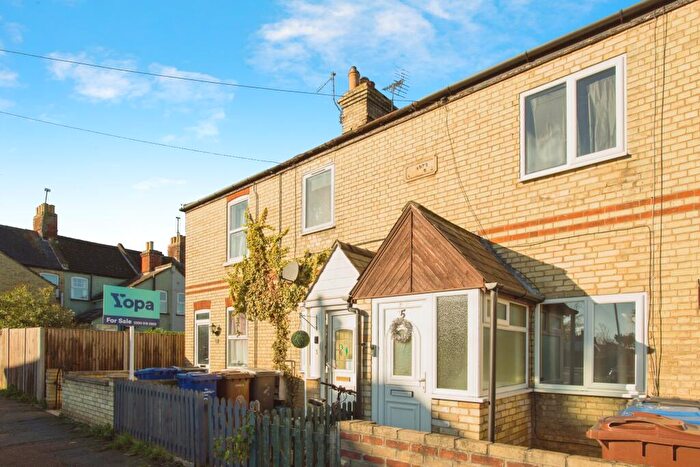
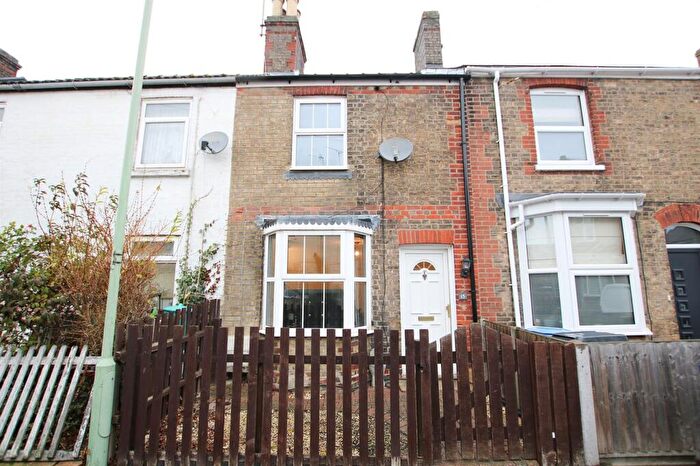
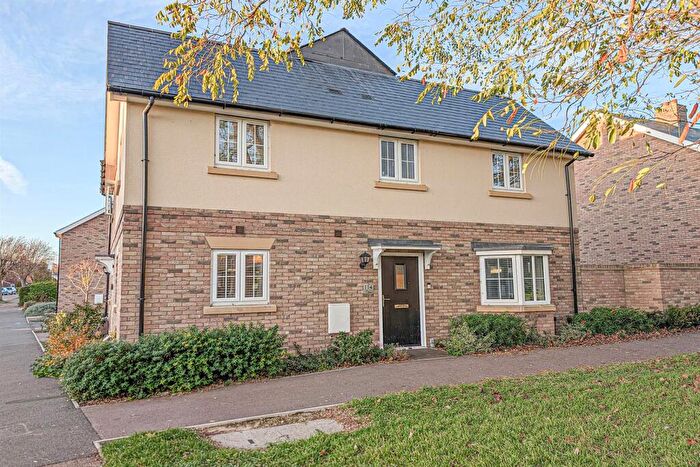
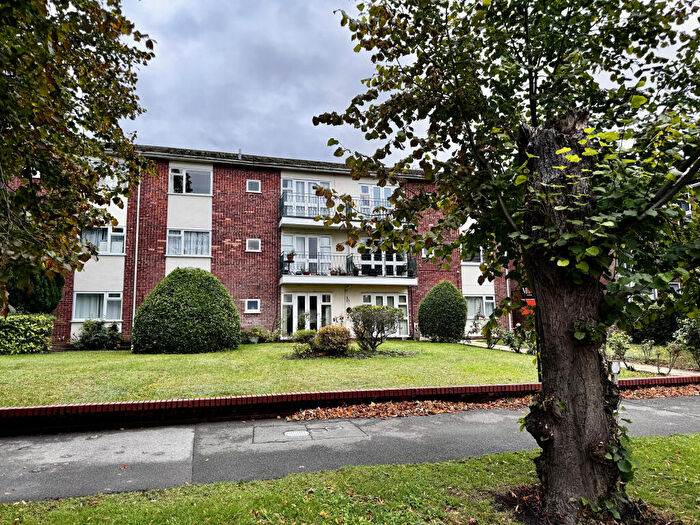
Properties for sale in St Marys
Roads and Postcodes in St Marys
Navigate through our locations to find the location of your next house in St Marys, Newmarket for sale or to rent.
| Streets | Postcodes |
|---|---|
| Abernant Drive | CB8 0FH |
| Adastral Close | CB8 0PX |
| Andrew Road | CB8 0DG |
| Bahram Close | CB8 0PZ |
| Bartons Place | CB8 0EY |
| Birdcage Walk | CB8 0NE |
| Black Bear Lane | CB8 0JT |
| Brazilian Terrace | CB8 0JU |
| Cecil Lodge Close | CB8 0ND |
| Charles Close | CB8 0NT |
| Church Lane | CB8 0HL CB8 0HN CB8 0HP |
| Churchill Avenue | CB8 0BU CB8 0BY CB8 0BZ |
| Churchill Court | CB8 0JY |
| Collings Place | CB8 0EX |
| Derby Way | CB8 0DD |
| Doris Street | CB8 0LD |
| Drinkwater Close | CB8 0QN CB8 0QW |
| Durham Way | CB8 0DN |
| Edinburgh Road | CB8 0EP CB8 0QD CB8 0QE CB8 0QF |
| Elizabeth Avenue | CB8 0DJ |
| Elvedon Way | CB8 0DF |
| Exning Road | CB8 0AT CB8 0AY CB8 0EA CB8 0EL |
| Fairhaven Way | CB8 0DQ |
| Falmouth Avenue | CB8 0GZ CB8 0NA CB8 0NB |
| Falmouth Street | CB8 0LE |
| Feilden Way | CB8 0BS |
| Fitzroy Street | CB8 0JW |
| Freshfields | CB8 0EF CB8 0EG CB8 0EH |
| Garden Court | CB8 0PT |
| Halifax Way | CB8 0DH |
| Hamilton Court | CB8 0NG |
| Hamilton Road | CB8 0NQ CB8 0NY CB8 0TE CB8 0WY CB8 7JQ |
| Harwood Terrace | CB8 0HX |
| High Street | CB8 8JP CB8 9AF CB8 9AP CB8 9AQ |
| Hill Close | CB8 0NR |
| Houldsworth Terrace | CB8 0JX |
| Jarvis Way | CB8 0DW |
| King Edward Vii Road | CB8 0ET CB8 0EU |
| Leaders Way | CB8 0DP |
| Lowther Street | CB8 0JS |
| Manderston Road | CB8 0NL CB8 0NN CB8 0NS CB8 0NU CB8 0QG |
| Melrose Gardens | CB8 0EW |
| Millbank | CB8 0EQ |
| New Cut | CB8 0HR |
| Norfolk Avenue | CB8 0DE |
| Portland Green | CB8 0NW |
| Portland Road | CB8 0NP |
| Princess Way | CB8 0NX |
| Rochfort Avenue | CB8 0DL |
| Rosebery Way | CB8 0DA |
| Rowley Court | CB8 0PA |
| Rowley Drive | CB8 0JA CB8 0JL CB8 0NH |
| Scaltback Close | CB8 0BT |
| Sefton Way | CB8 0DB |
| St Andrew | CB8 0JF |
| St Anthony | CB8 0JE |
| St David | CB8 0JH |
| St Denys | CB8 0JG |
| St Fabians Close | CB8 0EJ |
| St George | CB8 0JD |
| St James | CB8 0JQ |
| St Marys Square | CB8 0HZ |
| St Patrick | CB8 0JJ |
| St Philips Road | CB8 0EN CB8 0ES |
| Stirling Gardens | CB8 0ER |
| Suffolk Way | CB8 0DY |
| Tannersfield Way | CB8 0EE |
| The Hamiltons | CB8 0NF |
| The Rows | CB8 0NJ |
| Valley Way | CB8 0QH CB8 0QJ CB8 0QL CB8 0QQ |
| Wellington Street | CB8 0HT |
| Windsor Road | CB8 0PY CB8 0QA |
Transport near St Marys
- FAQ
- Price Paid By Year
- Property Type Price
Frequently asked questions about St Marys
What is the average price for a property for sale in St Marys?
The average price for a property for sale in St Marys is £284,555. This amount is 17% lower than the average price in Newmarket. There are 440 property listings for sale in St Marys.
What streets have the most expensive properties for sale in St Marys?
The streets with the most expensive properties for sale in St Marys are Hamilton Road at an average of £780,000, Cecil Lodge Close at an average of £618,333 and Black Bear Lane at an average of £540,000.
What streets have the most affordable properties for sale in St Marys?
The streets with the most affordable properties for sale in St Marys are Churchill Court at an average of £152,500, Church Lane at an average of £154,400 and High Street at an average of £156,250.
Which train stations are available in or near St Marys?
Some of the train stations available in or near St Marys are Newmarket, Dullingham and Kennett.
Property Price Paid in St Marys by Year
The average sold property price by year was:
| Year | Average Sold Price | Price Change |
Sold Properties
|
|---|---|---|---|
| 2025 | £293,416 | 1% |
77 Properties |
| 2024 | £291,299 | 9% |
99 Properties |
| 2023 | £265,269 | -3% |
70 Properties |
| 2022 | £271,989 | 1% |
100 Properties |
| 2021 | £269,190 | 3% |
95 Properties |
| 2020 | £260,871 | 1% |
88 Properties |
| 2019 | £257,923 | 3% |
82 Properties |
| 2018 | £251,436 | -3% |
87 Properties |
| 2017 | £257,956 | 12% |
97 Properties |
| 2016 | £226,985 | 3% |
89 Properties |
| 2015 | £220,918 | -2% |
83 Properties |
| 2014 | £224,649 | 17% |
108 Properties |
| 2013 | £187,308 | -8% |
114 Properties |
| 2012 | £202,992 | 9% |
78 Properties |
| 2011 | £184,685 | 6% |
81 Properties |
| 2010 | £174,036 | 4% |
72 Properties |
| 2009 | £166,690 | -25% |
65 Properties |
| 2008 | £208,003 | 4% |
61 Properties |
| 2007 | £199,543 | 12% |
121 Properties |
| 2006 | £174,695 | -4% |
133 Properties |
| 2005 | £181,634 | 5% |
118 Properties |
| 2004 | £172,330 | 17% |
146 Properties |
| 2003 | £143,251 | 22% |
128 Properties |
| 2002 | £111,092 | 6% |
108 Properties |
| 2001 | £104,735 | 19% |
141 Properties |
| 2000 | £84,970 | 10% |
127 Properties |
| 1999 | £76,818 | 17% |
115 Properties |
| 1998 | £63,908 | -4% |
110 Properties |
| 1997 | £66,281 | 14% |
93 Properties |
| 1996 | £57,155 | 1% |
98 Properties |
| 1995 | £56,768 | - |
89 Properties |
Property Price per Property Type in St Marys
Here you can find historic sold price data in order to help with your property search.
The average Property Paid Price for specific property types in the last three years are:
| Property Type | Average Sold Price | Sold Properties |
|---|---|---|
| Semi Detached House | £298,354.00 | 69 Semi Detached Houses |
| Detached House | £399,755.00 | 49 Detached Houses |
| Terraced House | £259,932.00 | 89 Terraced Houses |
| Flat | £171,591.00 | 39 Flats |

