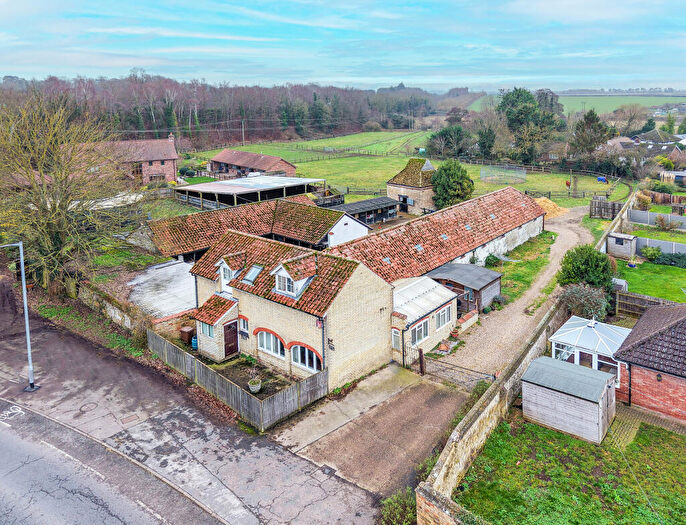
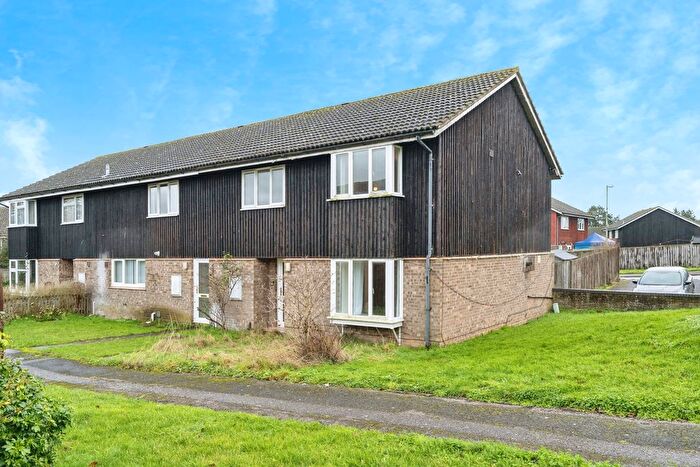
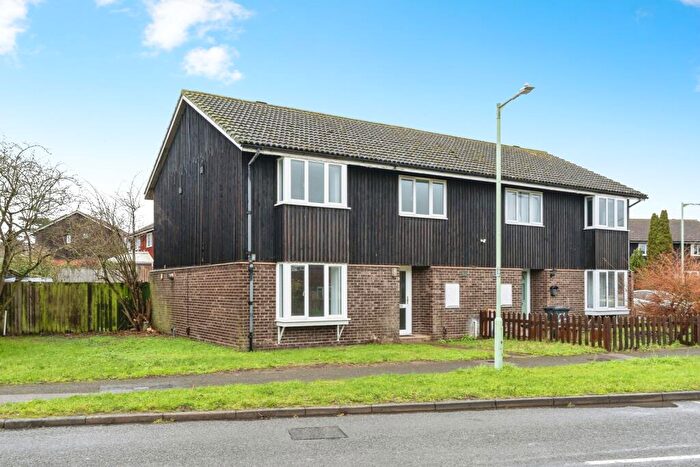
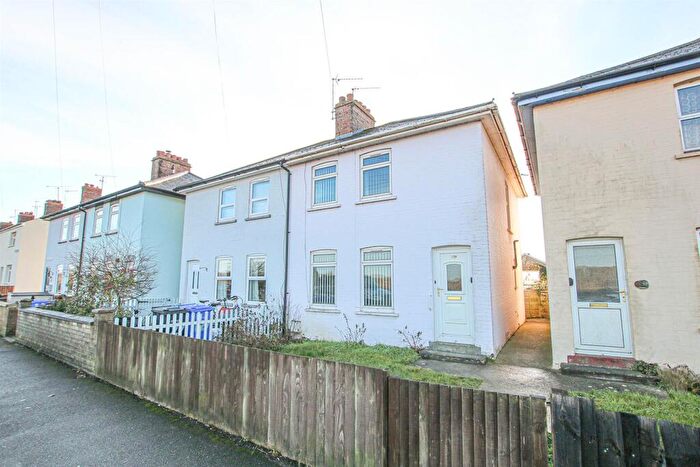
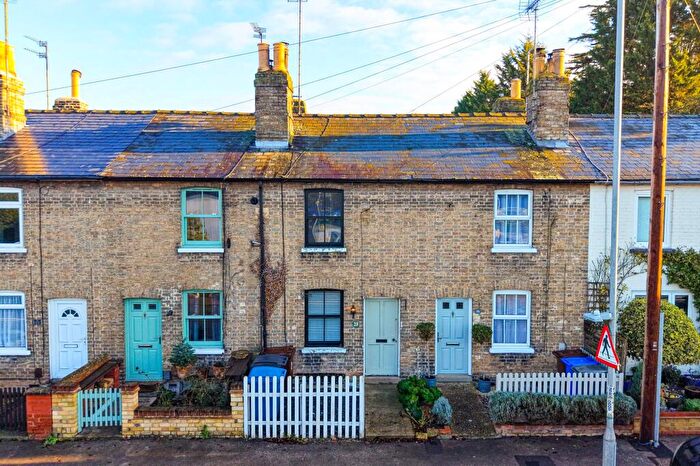
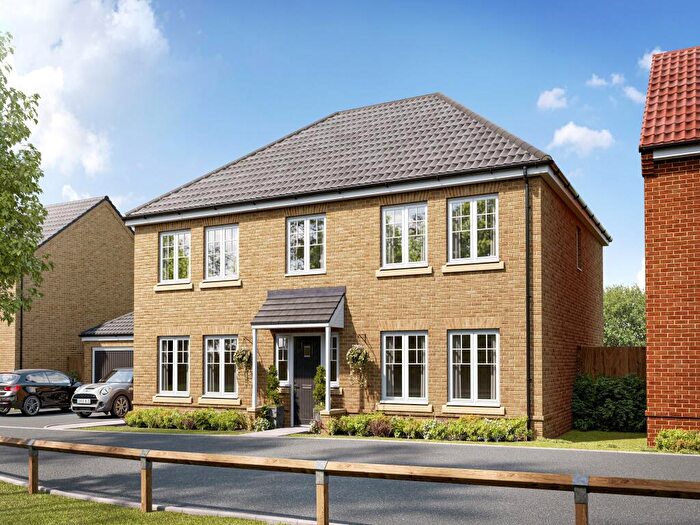
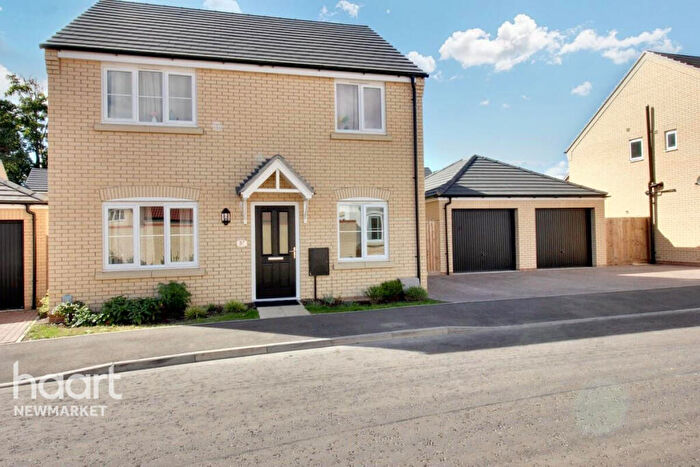
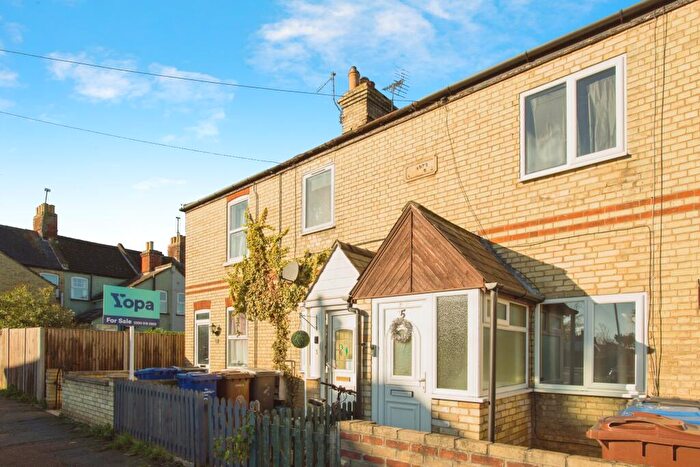
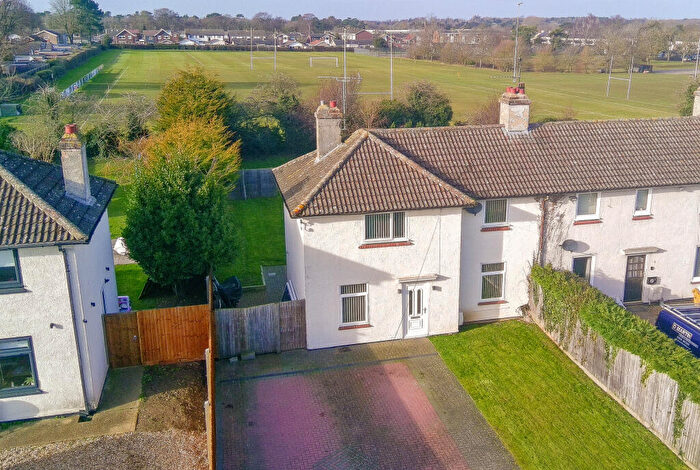
Houses for sale & to rent in Exning, Newmarket
House Prices in Exning
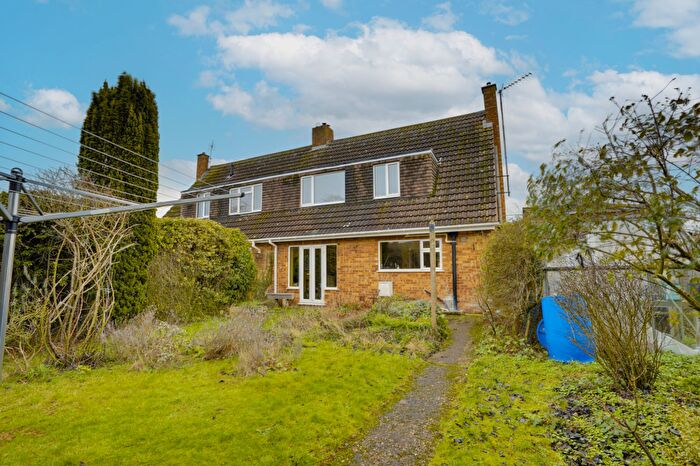
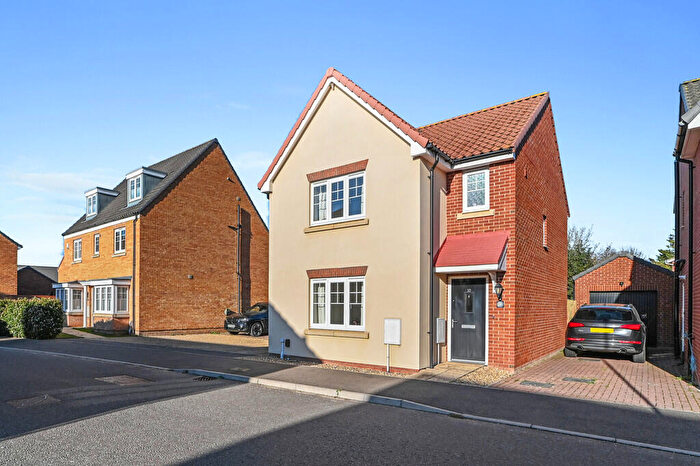
Properties in Exning have an average house price of £395,082.00 and had 135 Property Transactions within the last 3 years¹.
Exning is an area in Newmarket, Suffolk with 870 households², where the most expensive property was sold for £1,575,000.00.
Properties for sale in Exning
Roads and Postcodes in Exning
Navigate through our locations to find the location of your next house in Exning, Newmarket for sale or to rent.
| Streets | Postcodes |
|---|---|
| Annes Close | CB8 7JE |
| Ascot Close | CB8 7FJ |
| Beechwood Close | CB8 7EL |
| Bluebell Drive | CB8 7JA |
| Brookside | CB8 7HP |
| Burwell Road | CB8 7DU CB8 7EX CB8 7EY CB8 7LA |
| Chapel Street | CB8 7HA CB8 7HB |
| Church Close | CB8 7EJ |
| Church Lane | CB8 7HF |
| Church Street | CB8 7EH |
| Coronation Cottages | CB8 7JS |
| Cotton End Road | CB8 7NA CB8 7NN CB8 7NW CB8 7PF |
| Ducks Lane | CB8 7HQ |
| Fordham Road | CB8 7LF |
| Foxglove Drive | CB8 7GX |
| Frogmore | CB8 7FR |
| Garlic Street | CB8 7GW |
| George Gibson Close | CB8 7LE |
| Glanely Gardens | CB8 7PA |
| Glebe Drive | CB8 7FQ |
| Iceni Way | CB8 7HT |
| King George Avenue | CB8 7ES CB8 7ET |
| La Grange Place | CB8 7HE |
| Laceys Lane | CB8 7HL CB8 7HN CB8 7HW |
| Landwade Road | CB8 7NG CB8 7NH CB8 7NJ CB8 7NL CB8 7NQ |
| Mallard Way | CB8 7FS |
| Mill Close | CB8 7JF |
| Mill Lane | CB8 7JN CB8 7JW |
| New River Green | CB8 7HS |
| New Road | CB8 7JP |
| North End Road | CB8 7JT CB8 7JU CB8 7JX CB8 7PD CB8 7JR CB8 7JZ |
| Northend Road | CB8 7JY |
| Nursery Cottages | CB8 7NP |
| Oxford Street | CB8 7EW |
| Plover Place | CB8 7FT |
| Prince Close | CB8 7HU |
| Queens View | CB8 7HR |
| Queensway | CB8 7EU |
| Saxon Close | CB8 7NS |
| Shepherd Close | CB8 7PG |
| Short Road | CB8 7LH |
| St Martins Close | CB8 7HG |
| St Wendreds Way | CB8 7HH CB8 7HJ |
| Swan Grove | CB8 7HX |
| Swan Lane | CB8 7EN CB8 7FN |
| Tern Place | CB8 7FU |
| The Drift | CB8 7EZ |
| The Highlands | CB8 7NT |
| Windmill Hill | CB8 7LB CB8 7PB CB8 7LD |
| CB8 7NE CB8 7NF |
Transport near Exning
-
Newmarket Station
-
Dullingham Station
-
Kennett Station
-
Waterbeach Station
-
Cambridge North Station
-
Ely Station
- FAQ
- Price Paid By Year
- Property Type Price
Frequently asked questions about Exning
What is the average price for a property for sale in Exning?
The average price for a property for sale in Exning is £395,082. This amount is 16% higher than the average price in Newmarket. There are 637 property listings for sale in Exning.
What streets have the most expensive properties for sale in Exning?
The streets with the most expensive properties for sale in Exning are Saxon Close at an average of £940,000, Windmill Hill at an average of £825,000 and Shepherd Close at an average of £810,000.
What streets have the most affordable properties for sale in Exning?
The streets with the most affordable properties for sale in Exning are King George Avenue at an average of £212,500, La Grange Place at an average of £245,666 and New Road at an average of £265,000.
Which train stations are available in or near Exning?
Some of the train stations available in or near Exning are Newmarket, Dullingham and Kennett.
Property Price Paid in Exning by Year
The average sold property price by year was:
| Year | Average Sold Price | Price Change |
Sold Properties
|
|---|---|---|---|
| 2025 | £375,127 | -9% |
43 Properties |
| 2024 | £410,266 | 3% |
48 Properties |
| 2023 | £398,018 | 6% |
44 Properties |
| 2022 | £373,668 | 6% |
37 Properties |
| 2021 | £351,753 | 13% |
49 Properties |
| 2020 | £305,805 | -18% |
36 Properties |
| 2019 | £361,049 | 10% |
30 Properties |
| 2018 | £323,872 | -2% |
42 Properties |
| 2017 | £331,576 | -10% |
79 Properties |
| 2016 | £365,831 | 18% |
42 Properties |
| 2015 | £301,234 | 15% |
33 Properties |
| 2014 | £256,397 | 6% |
43 Properties |
| 2013 | £239,990 | -4% |
34 Properties |
| 2012 | £250,675 | 29% |
37 Properties |
| 2011 | £176,893 | -9% |
31 Properties |
| 2010 | £193,336 | -28% |
26 Properties |
| 2009 | £246,952 | 19% |
21 Properties |
| 2008 | £200,010 | -14% |
20 Properties |
| 2007 | £228,413 | 2% |
39 Properties |
| 2006 | £224,101 | -7% |
55 Properties |
| 2005 | £239,637 | 4% |
44 Properties |
| 2004 | £229,547 | 22% |
47 Properties |
| 2003 | £179,960 | 7% |
47 Properties |
| 2002 | £167,103 | 31% |
52 Properties |
| 2001 | £115,799 | 22% |
42 Properties |
| 2000 | £90,745 | 19% |
39 Properties |
| 1999 | £73,746 | 2% |
43 Properties |
| 1998 | £72,256 | -8% |
45 Properties |
| 1997 | £78,300 | 13% |
44 Properties |
| 1996 | £68,071 | -16% |
51 Properties |
| 1995 | £79,080 | - |
33 Properties |
Property Price per Property Type in Exning
Here you can find historic sold price data in order to help with your property search.
The average Property Paid Price for specific property types in the last three years are:
| Property Type | Average Sold Price | Sold Properties |
|---|---|---|
| Semi Detached House | £343,763.00 | 23 Semi Detached Houses |
| Detached House | £498,683.00 | 63 Detached Houses |
| Terraced House | £286,509.00 | 46 Terraced Houses |
| Flat | £277,666.00 | 3 Flats |

