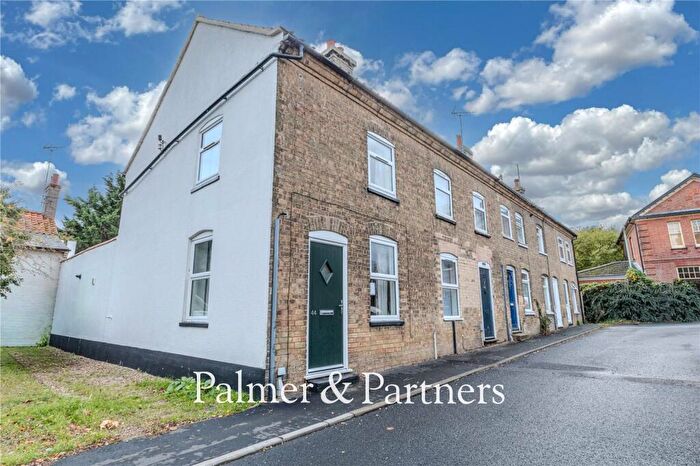
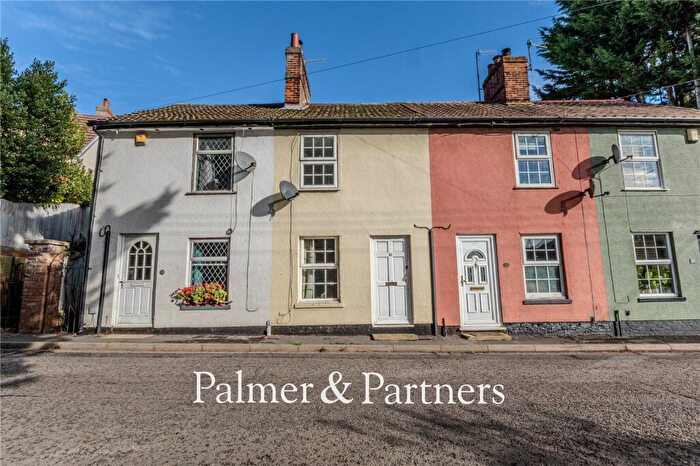
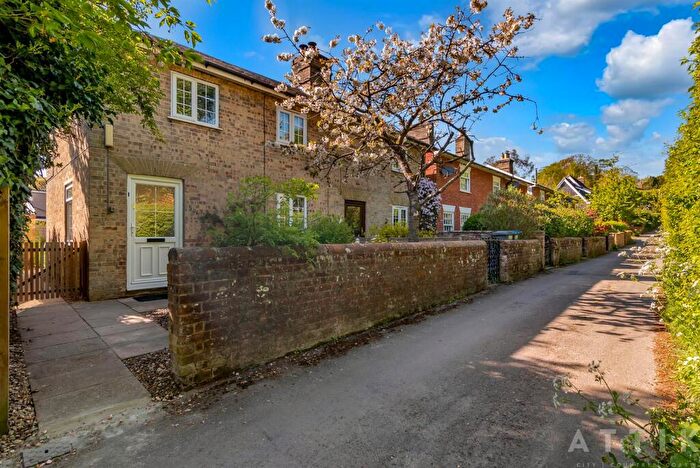
Houses for sale & to rent in Saxmundham, Saxmundham
House Prices in Saxmundham
Properties in Saxmundham have an average house price of £318,524.00 and had 229 Property Transactions within the last 3 years¹.
Saxmundham is an area in Saxmundham, Suffolk with 2,021 households², where the most expensive property was sold for £1,500,000.00.
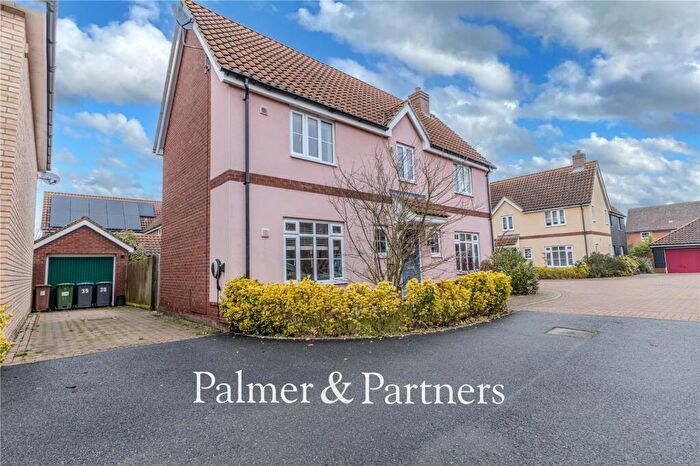
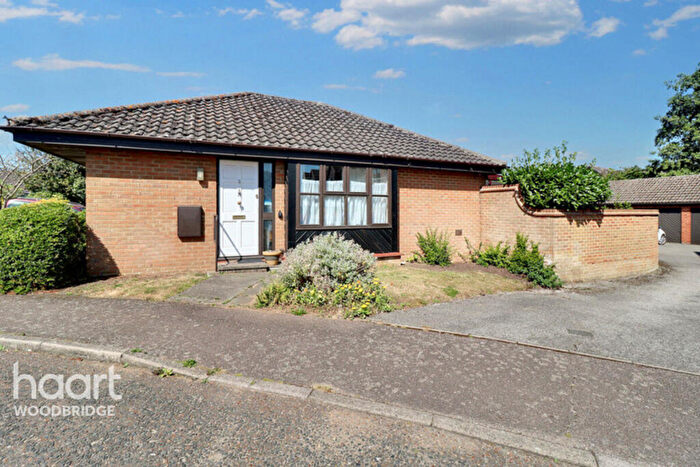
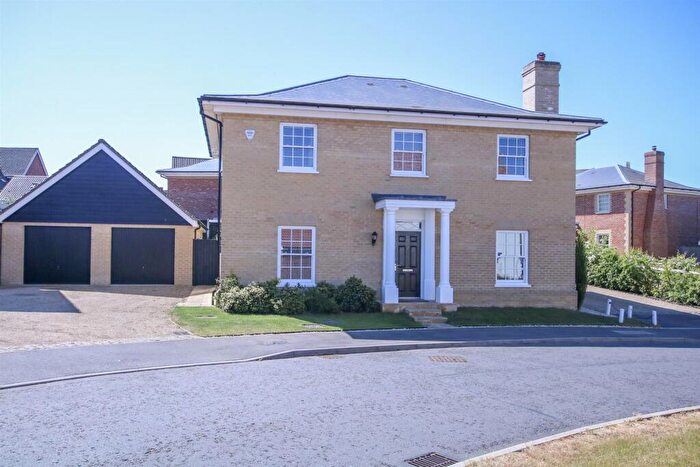
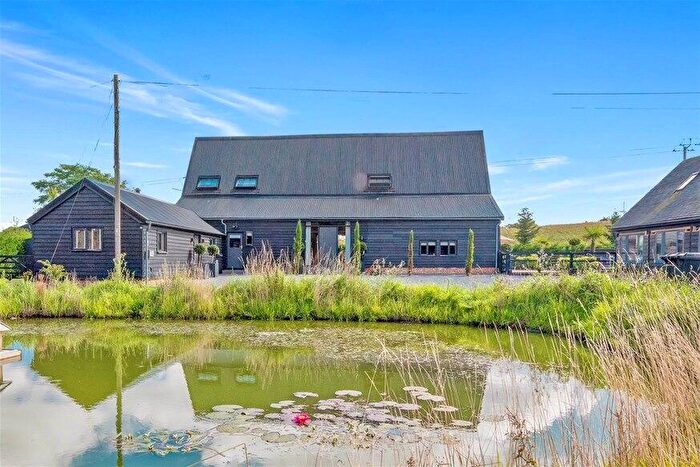
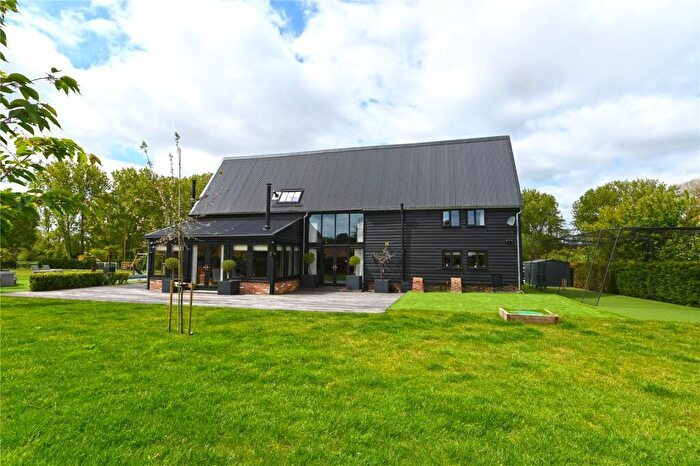
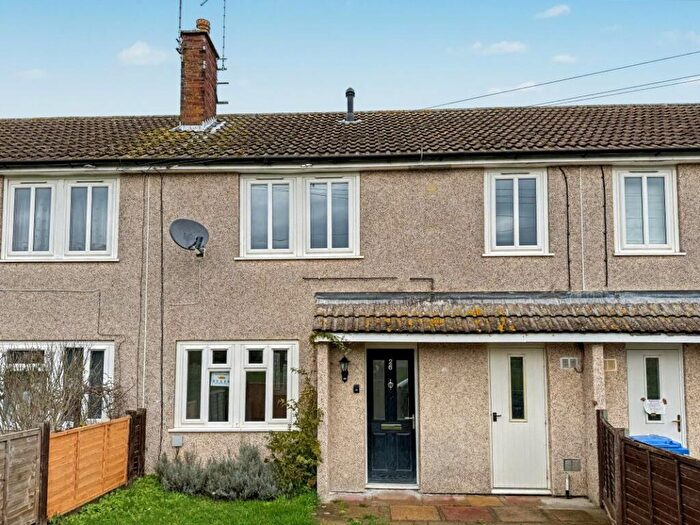
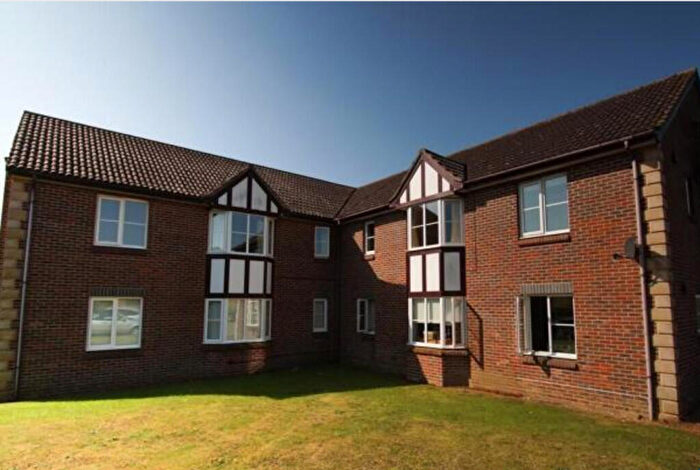
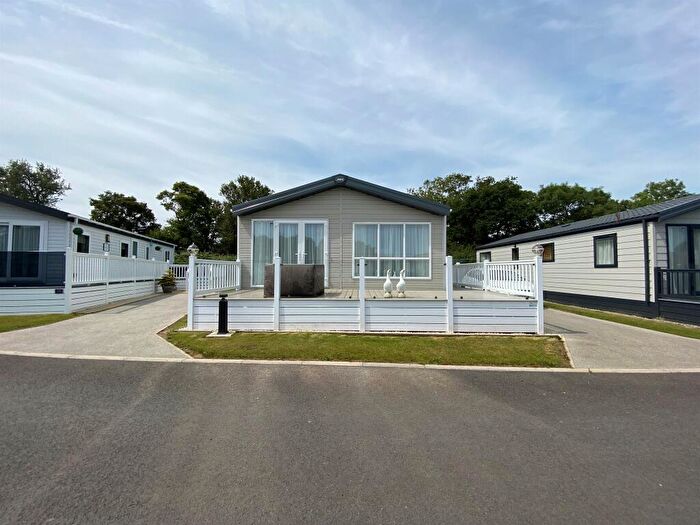
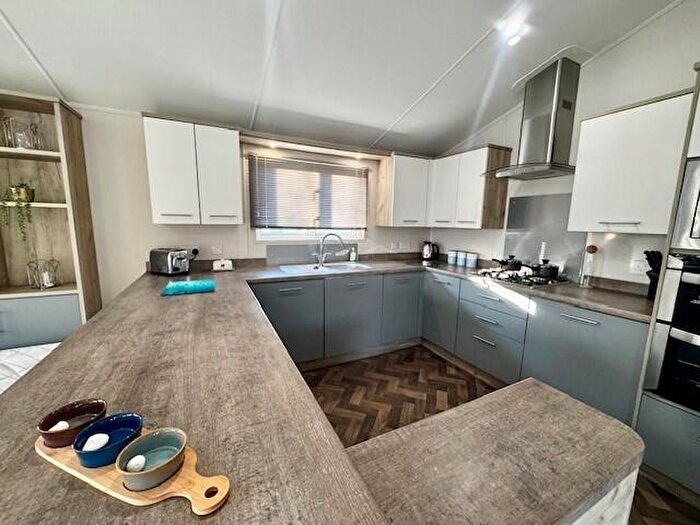
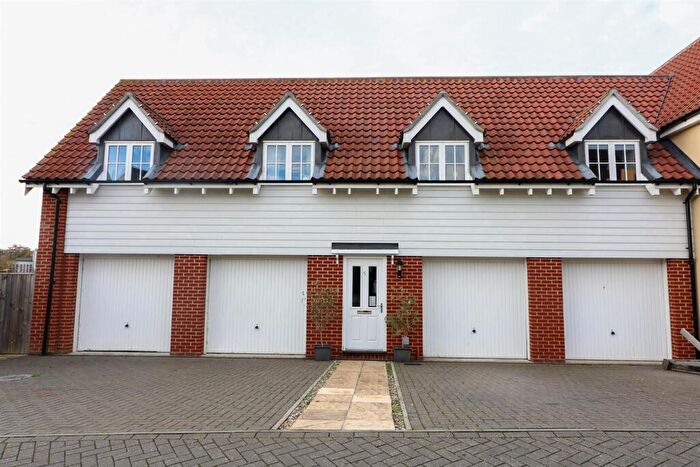
Properties for sale in Saxmundham
Roads and Postcodes in Saxmundham
Navigate through our locations to find the location of your next house in Saxmundham, Saxmundham for sale or to rent.
| Streets | Postcodes |
|---|---|
| Abbey Court | IP17 1DX |
| Albion Street | IP17 1BL IP17 1BN |
| Alde Close | IP17 1YD |
| Alma Place | IP17 1DN |
| Ashfords Close | IP17 1WB |
| Avocet Court | IP17 1WP |
| Back Of Market Place | IP17 1AH |
| Bakers Mews | IP17 1FX |
| Beaumont Cottages | IP17 2NW |
| Beech Road | IP17 1FP IP17 1FQ |
| Bell Close | IP17 1AZ |
| Belvedere Close | IP17 2RS |
| Bigsbys Corner | IP17 1RP |
| Bittern Road | IP17 1WT |
| Blyth Close | IP17 1YH |
| Bridge Street | IP17 2PB IP17 2PE IP17 2PG |
| Bright Close | IP17 1GB |
| Brook Farm Road | IP17 1WL IP17 1XT IP17 1XQ |
| Byron Court | IP17 1WS |
| Carlton Park | IP17 2NJ |
| Carlton Road | IP17 2NP IP17 2QB IP17 2QD IP17 2QE IP17 2QG IP17 2QJ |
| Chantry Road | IP17 1DJ |
| Chapel Road | IP17 1BG IP17 1BH |
| Church Close | IP17 2PA |
| Church Hill | IP17 1ES IP17 1EU |
| Church Lane | IP17 2NZ |
| Church Street | IP17 1EP |
| Cloutings Close | IP17 2RX |
| Collins Close | IP17 1GE |
| Cooper Close | IP17 1EX |
| Curlew Court | IP17 1WQ |
| Curlew Green | IP17 2RA |
| Deben Road | IP17 1YA |
| Dennys Lane | IP17 2PD |
| Dorleys Corner | IP17 2QZ |
| Dove Close | IP17 1XU |
| Drake Close | IP17 1FG |
| East Green | IP17 2PH IP17 2PJ |
| East View | IP17 2NT |
| Elm Close | IP17 1FT |
| Fairfield Drive | IP17 1AX |
| Fairfield House Gardens | IP17 1DL |
| Fairfield Place | IP17 1FH |
| Fairfield Road | IP17 1BA IP17 1BB IP17 1EG |
| Felsham Rise | IP17 1EZ |
| Fisher Close | IP17 1XL |
| Fitzgerald Mews | IP17 1XP |
| Franklin Road | IP17 1FJ |
| Fromus Walk | IP17 1GG |
| Gilbert Road | IP17 1FE |
| Gull Road | IP17 1WN |
| Harpers Lane | IP17 1BP |
| Haywards Mews | IP17 1XS |
| Henley Close | IP17 1EY |
| Heron Road | IP17 1WR IP17 1YT |
| High Street | IP17 1AB IP17 1AJ IP17 1DD IP17 1AA IP17 1AF IP17 1DB IP17 1DF |
| Holly Way | IP17 1FU |
| Howards Walk | IP17 1FA |
| Hubbards Close | IP17 1GA |
| Keats Close | IP17 1WJ |
| Kingfisher Rise | IP17 1WE |
| Lambsale Meadow | IP17 1DY |
| Leiston Road | IP17 1TG |
| Lincoln Avenue | IP17 1BY IP17 1BZ |
| Long Avenue | IP17 1WG |
| Low Road | IP17 2NU |
| Lowes Hill | IP17 2PQ |
| Main Road | IP17 2NS IP17 2QU IP17 2QY IP17 2RD IP17 2RE IP17 2RG IP17 2RQ |
| Mallard Road | IP17 1WW |
| Manor Gardens | IP17 1ET |
| Market Place | IP17 1AG IP17 1EL |
| Mayflower Avenue | IP17 1BU IP17 1BX |
| Mill Rise | IP17 1XJ |
| Mill Road | IP17 1DP IP17 1DS |
| Millfield Close | IP17 1XH |
| Milton Close | IP17 1WH |
| Montagu Drive | IP17 1FL IP17 1FN |
| New Cut | IP17 1EH |
| North Entrance | IP17 1AP IP17 1AS IP17 1AU IP17 1AY |
| North Green | IP17 2RL IP17 2RN IP17 2RP |
| Oak Close | IP17 1FW |
| Orwell Avenue | IP17 1XY |
| Park Avenue | IP17 1DR |
| Park End | IP17 1DW |
| Pear Tree Close | IP17 2RR |
| Queens Close | IP17 1EQ |
| Rectory Cottages | IP17 2NX |
| Rendham Road | IP17 1BJ IP17 1DT IP17 1EA IP17 1EJ IP17 2AA IP17 2QN IP17 1WA |
| Rosemary Lane | IP17 2QS IP17 2QT |
| Sandbanks Court | IP17 1BF |
| Sandy Lane | IP17 2QH |
| Saxon Road | IP17 1EB IP17 1ED IP17 1EE IP17 1EF |
| Seaman Avenue | IP17 1DZ |
| Shelley Mews | IP17 1XR |
| South Entrance | IP17 1DG IP17 1DQ |
| Southwood Close | IP17 1EN |
| St Johns Road | IP17 1BD IP17 1BE IP17 1BQ |
| Station Approach | IP17 1BW |
| Stour Close | IP17 1XX |
| Street Farm Road | IP17 1AL IP17 1DU |
| Tennyson Road | IP17 1WU |
| The Limes | IP17 1TD |
| The Old Bell Yard | IP17 1BT |
| The Spinney | IP17 1AR |
| The Vines | IP17 2PU |
| Thurlow Close | IP17 1GD |
| Tiggins Lane | IP17 2QX |
| Warren Avenue | IP17 1GF IP17 1GN IP17 1GL |
| Waveney Close | IP17 1YB |
| West View | IP17 2NR |
| Willow Way | IP17 1FR |
| Wordsworth Close | IP17 1WF |
| Yew Close | IP17 1FS |
| IP17 1ER IP17 2QP IP17 1AT IP17 1DH IP17 1FZ IP17 1XE IP17 2PX IP17 9AP IP17 9AT IP17 9AX IP17 9AZ IP17 9BB |
Transport near Saxmundham
- FAQ
- Price Paid By Year
- Property Type Price
Frequently asked questions about Saxmundham
What is the average price for a property for sale in Saxmundham?
The average price for a property for sale in Saxmundham is £318,524. This amount is 18% lower than the average price in Saxmundham. There are 1,075 property listings for sale in Saxmundham.
What streets have the most expensive properties for sale in Saxmundham?
The streets with the most expensive properties for sale in Saxmundham are Main Road at an average of £967,500, The Spinney at an average of £720,000 and Church Close at an average of £543,500.
What streets have the most affordable properties for sale in Saxmundham?
The streets with the most affordable properties for sale in Saxmundham are Queens Close at an average of £119,500, Dennys Lane at an average of £145,666 and Park Avenue at an average of £158,666.
Which train stations are available in or near Saxmundham?
Some of the train stations available in or near Saxmundham are Saxmundham, Darsham and Wickham Market.
Property Price Paid in Saxmundham by Year
The average sold property price by year was:
| Year | Average Sold Price | Price Change |
Sold Properties
|
|---|---|---|---|
| 2025 | £305,234 | -4% |
81 Properties |
| 2024 | £317,148 | -6% |
83 Properties |
| 2023 | £336,844 | 7% |
65 Properties |
| 2022 | £314,006 | 1% |
105 Properties |
| 2021 | £310,582 | 20% |
160 Properties |
| 2020 | £249,571 | 9% |
102 Properties |
| 2019 | £225,967 | -9% |
87 Properties |
| 2018 | £245,886 | -7% |
126 Properties |
| 2017 | £263,547 | 12% |
128 Properties |
| 2016 | £232,889 | 2% |
139 Properties |
| 2015 | £227,857 | -5% |
169 Properties |
| 2014 | £238,815 | 8% |
136 Properties |
| 2013 | £219,740 | 1% |
88 Properties |
| 2012 | £216,562 | 7% |
91 Properties |
| 2011 | £201,506 | -2% |
64 Properties |
| 2010 | £205,534 | 15% |
75 Properties |
| 2009 | £175,694 | -5% |
76 Properties |
| 2008 | £183,883 | -1% |
56 Properties |
| 2007 | £185,998 | 3% |
127 Properties |
| 2006 | £180,388 | 0,4% |
159 Properties |
| 2005 | £179,685 | 15% |
126 Properties |
| 2004 | £153,588 | -0,2% |
173 Properties |
| 2003 | £153,841 | 23% |
194 Properties |
| 2002 | £118,984 | 15% |
221 Properties |
| 2001 | £100,787 | 19% |
143 Properties |
| 2000 | £81,307 | 12% |
90 Properties |
| 1999 | £71,192 | 9% |
84 Properties |
| 1998 | £64,691 | 9% |
105 Properties |
| 1997 | £59,081 | 3% |
85 Properties |
| 1996 | £57,176 | 11% |
64 Properties |
| 1995 | £50,751 | - |
44 Properties |
Property Price per Property Type in Saxmundham
Here you can find historic sold price data in order to help with your property search.
The average Property Paid Price for specific property types in the last three years are:
| Property Type | Average Sold Price | Sold Properties |
|---|---|---|
| Flat | £152,461.00 | 13 Flats |
| Semi Detached House | £271,235.00 | 58 Semi Detached Houses |
| Detached House | £420,301.00 | 101 Detached Houses |
| Terraced House | £224,176.00 | 57 Terraced Houses |

