Houses for sale & to rent in Snape, Saxmundham
House Prices in Snape
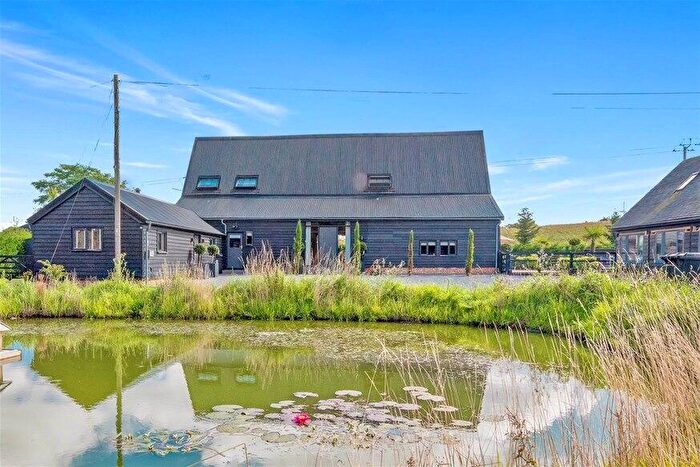
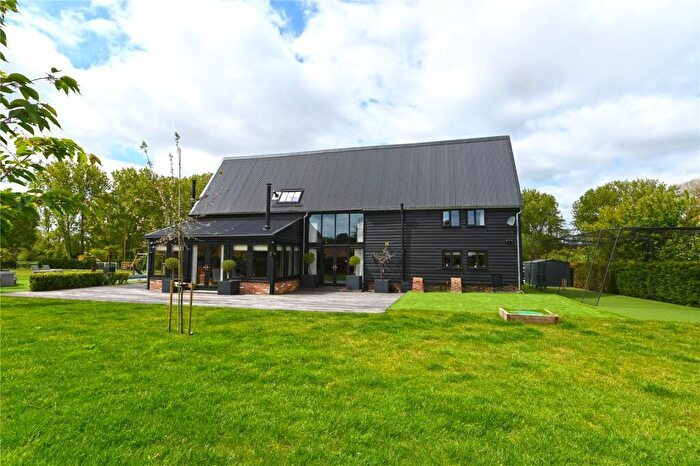
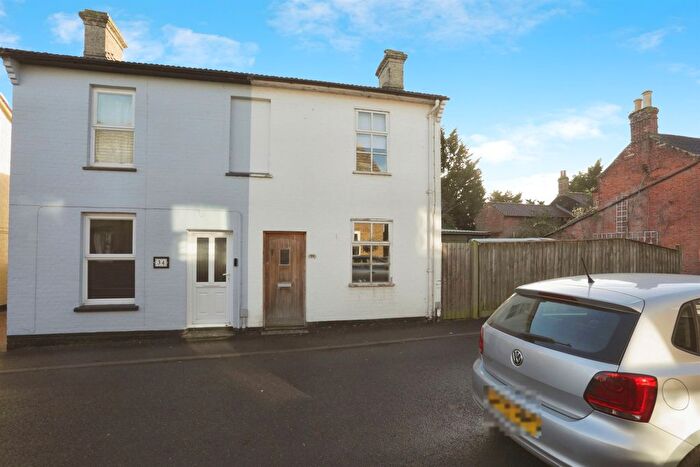
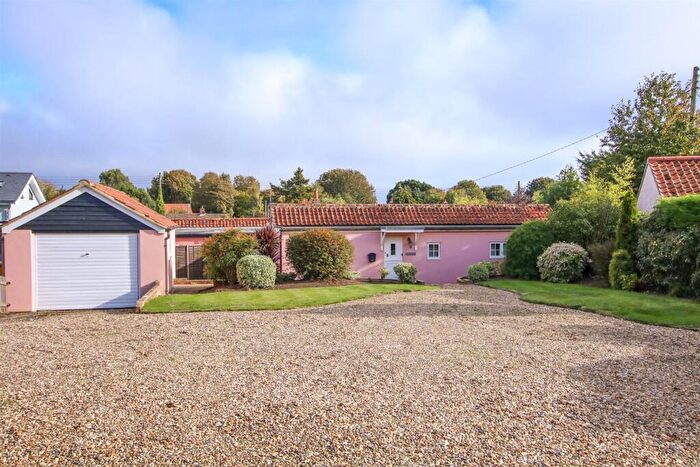
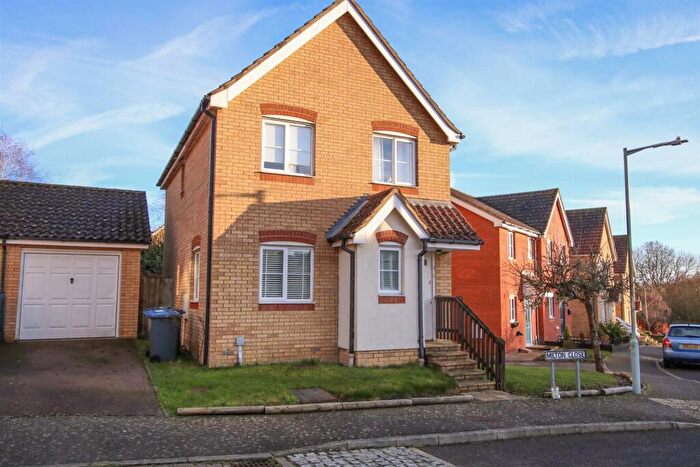
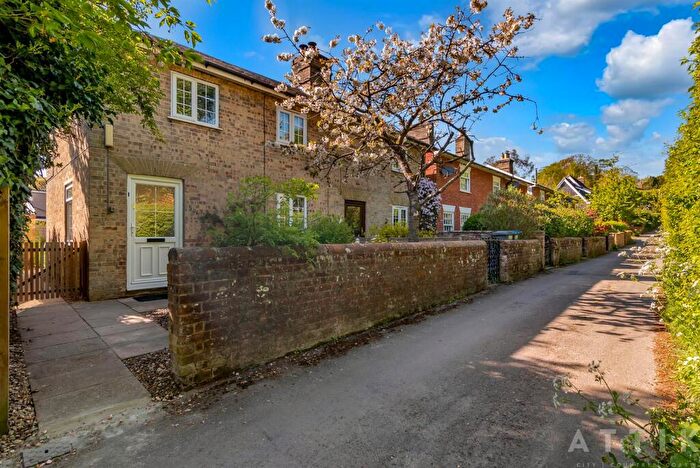
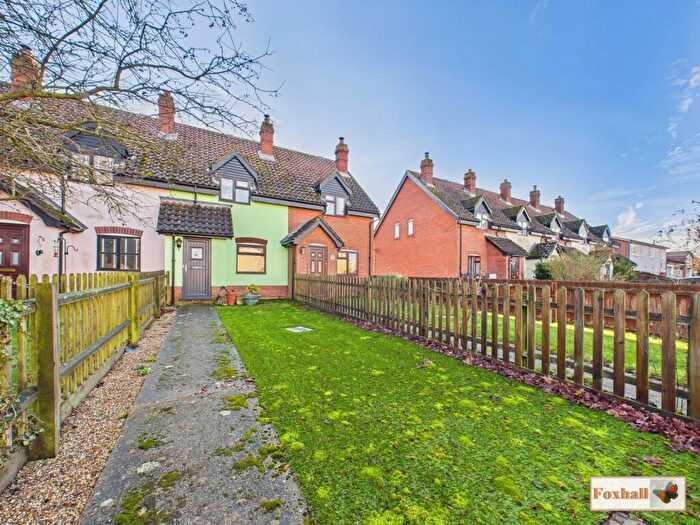
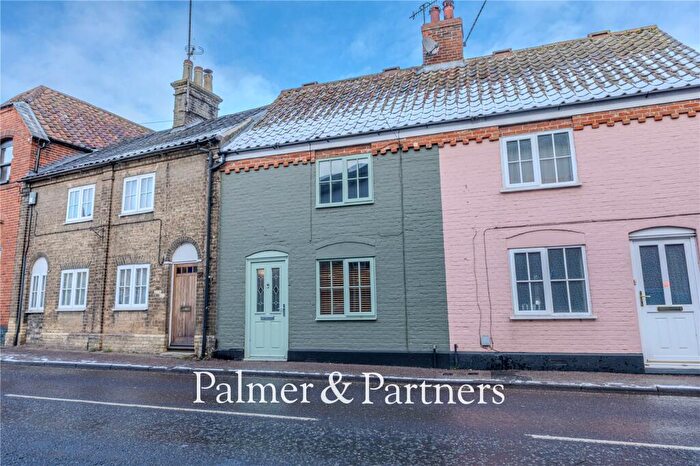
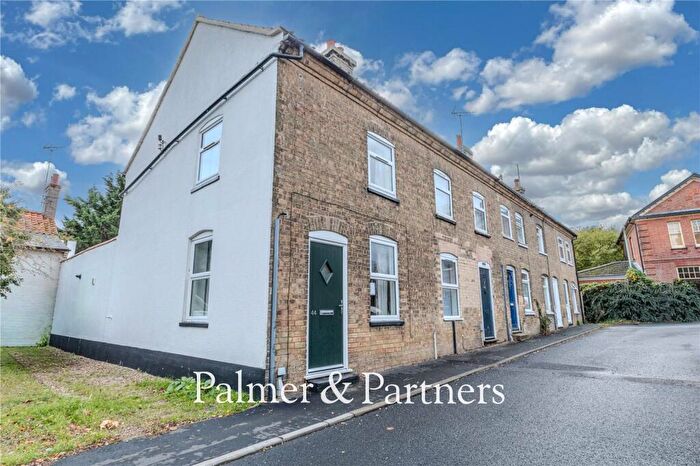
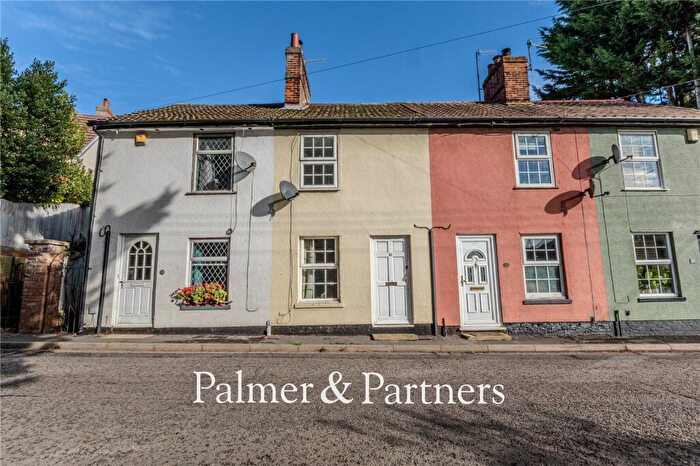
Properties in Snape have an average house price of £455,543.00 and had 74 Property Transactions within the last 3 years¹.
Snape is an area in Saxmundham, Suffolk with 795 households², where the most expensive property was sold for £1,260,000.00.
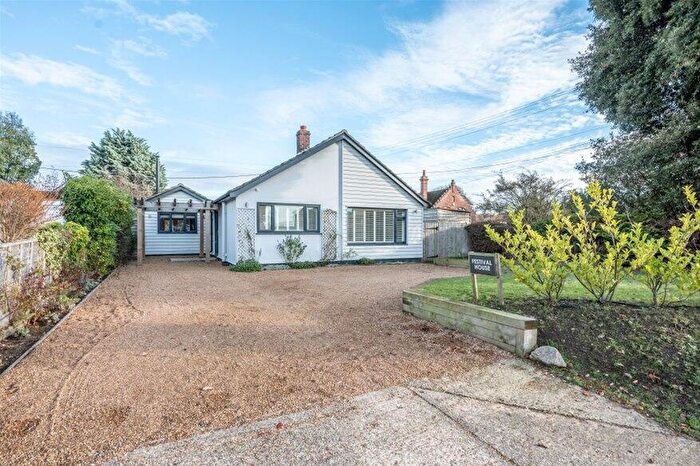
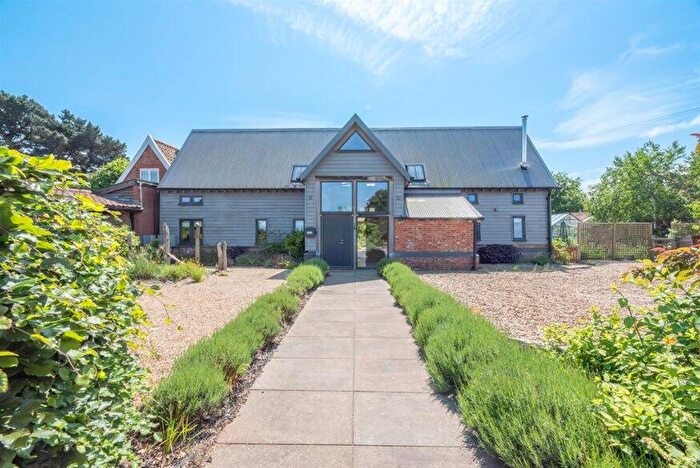
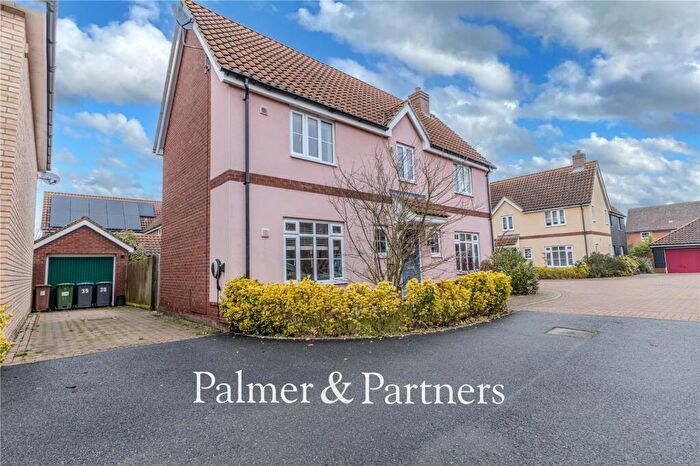
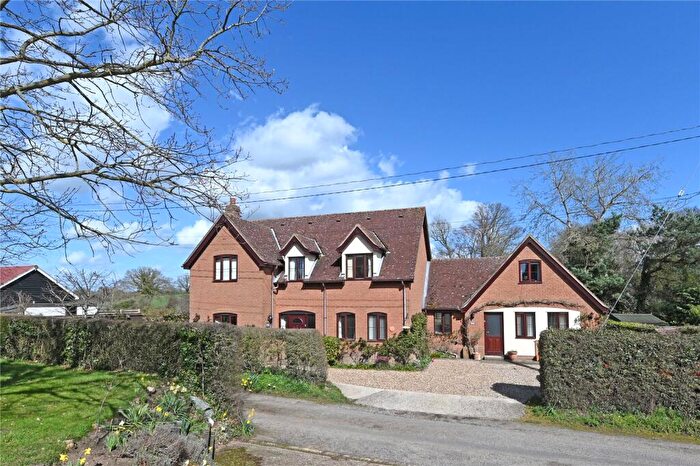
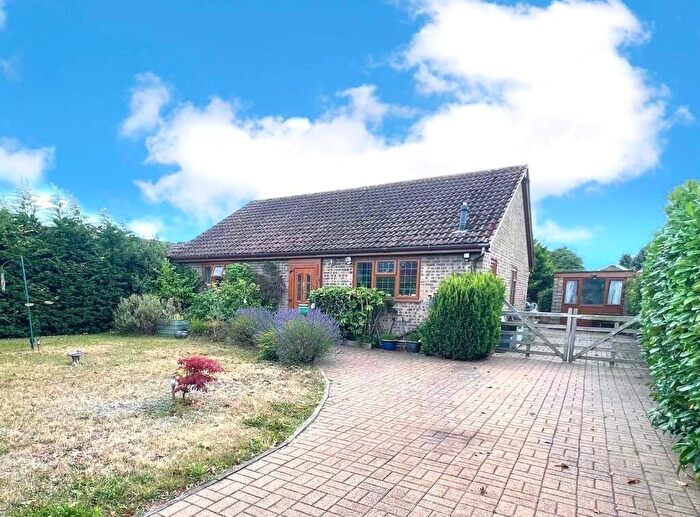
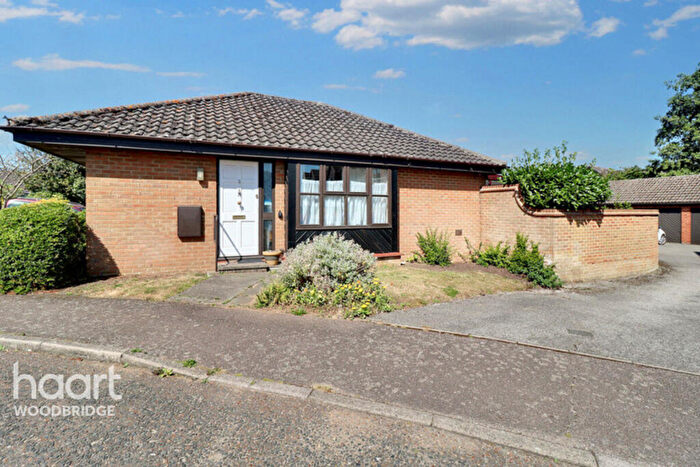
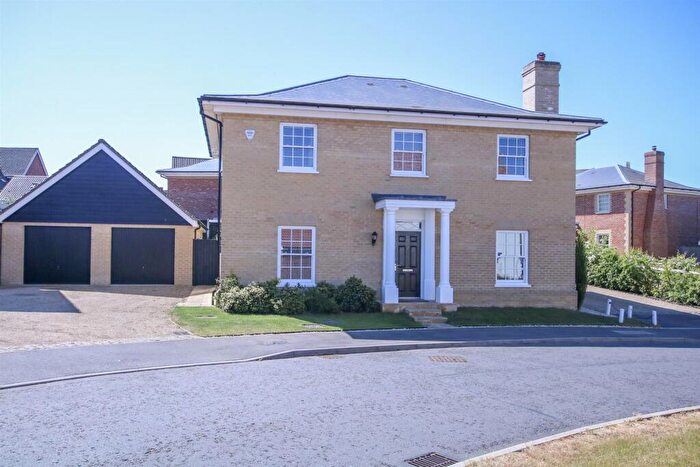
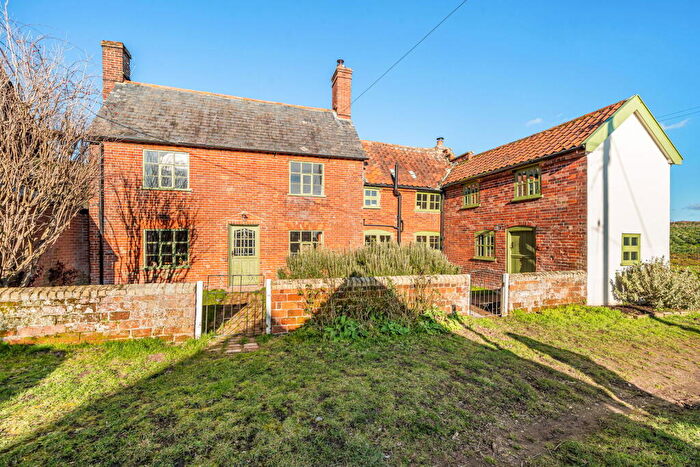
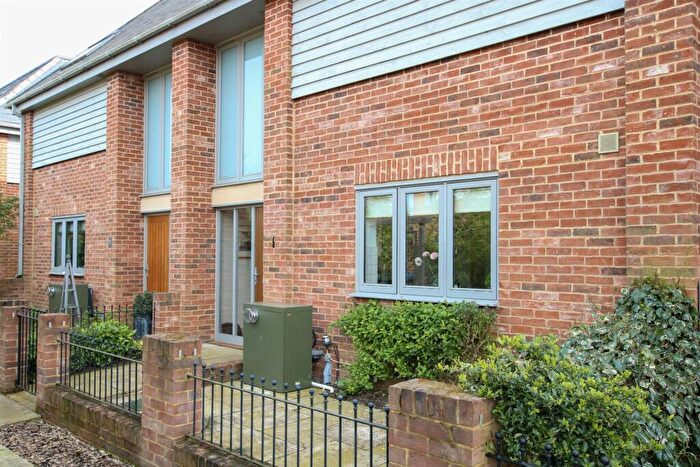
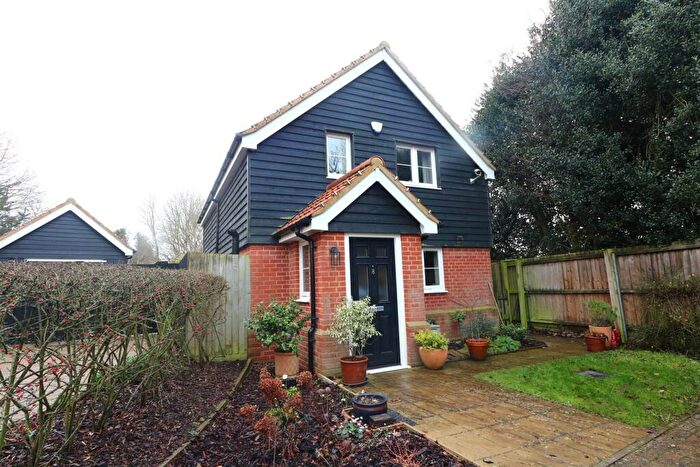
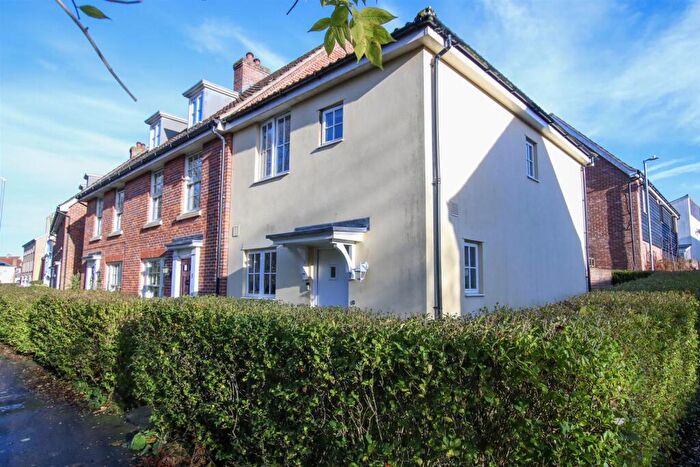
Properties for sale in Snape
Roads and Postcodes in Snape
Navigate through our locations to find the location of your next house in Snape, Saxmundham for sale or to rent.
| Streets | Postcodes |
|---|---|
| Aldeburgh Road | IP17 1NP IP17 1PD IP17 1PE IP17 1QH |
| Aldecar Lane | IP17 1HN |
| Alder Close | IP17 1QB |
| Ayden Way | IP17 1HG |
| Bay Tree Cottages | IP17 1HX |
| Benhall Green | IP17 1HL IP17 1HT IP17 1HU IP17 1US |
| Blyth Houses | IP17 1SY |
| Bridge Road | IP17 1SL |
| Bulls Hall Cottages | IP17 1NY |
| Chalfont Drive | IP17 1AQ |
| Chases Lane | IP17 1PJ |
| Church Common | IP17 1QL |
| Church Hill | IP17 1RS |
| Church Lane | IP17 1PT |
| Church Path | IP17 1PX IP17 1PY |
| Church Road | IP17 1PU IP17 1QG IP17 1SX IP17 1SZ |
| Churchill Cottages | IP17 1HJ |
| Coronation Row | IP17 1HH |
| Deadmans Lane | IP17 1JJ IP17 1JL |
| Donkey Lane | IP17 1PL |
| Drury Park | IP17 1TA |
| Farnham Barn | IP17 1LB |
| Farnham Road | IP17 1QW |
| Festival Close | IP17 1HQ |
| Forge Close | IP17 1JP |
| Friday Street | IP17 1JU IP17 1JX |
| Friston Hall Cottages | IP17 1NQ |
| Garrett Close | IP17 1RN |
| Grays Lane | IP17 1HZ |
| Great Glemham Road | IP17 1LJ IP17 1LL IP17 1LW |
| Gromford Lane | IP17 1RD IP17 1RE IP17 1RF IP17 1RG |
| Grove Road | IP17 1PP |
| Herons Way | IP17 1JN |
| Hillcrest | IP17 1NN |
| Hulver Lane | IP17 1QU |
| Kiln Lane | IP17 1HA |
| Low Barn Cottages | IP17 1LN |
| Low Road | IP17 1PW |
| Low Street | IP17 1JE IP17 1JF IP17 1JQ |
| Main Road | IP17 1HD IP17 1JY IP17 1LF |
| Meadow Walk | IP17 1JR |
| Mill Lane | IP17 1HF IP17 1PZ |
| Mill Road | IP17 1NW IP17 1PH |
| Mitford Road | IP17 1JA |
| Park Farm Cottages | IP17 1PA |
| Priory Road | IP17 1RZ IP17 1SA IP17 1SD IP17 1SF |
| Pryor Close | IP17 1RA |
| Red Lane | IP17 1HS |
| Sandy Lane | IP17 1HR IP17 1HW IP17 1RT IP17 1SE |
| Saxonfields | IP17 1QA |
| School Lane | IP17 1HE |
| Silverlace Green | IP17 1JH |
| Snape Watering | IP17 1QR |
| St Marys View | IP17 1GZ |
| Stanhope Close | IP17 1RH |
| Sternfield Road | IP17 1RR |
| The Glebes | IP17 1QF |
| The Hill | IP17 1RJ IP17 1SQ |
| The Street | IP17 1JZ IP17 1ND IP17 1NG IP17 1SG IP17 1SH IP17 1SJ |
| The Terrace | IP17 1SU |
| Wadd Lane | IP17 1QX IP17 1QY |
| Whin Cottages | IP17 1NR |
| IP17 1HY IP17 1LA IP17 1LE IP17 1LH IP17 1LT IP17 1LY IP17 1NJ IP17 1PB IP17 1RB IP17 1RY IP17 2BH |
Transport near Snape
- FAQ
- Price Paid By Year
- Property Type Price
Frequently asked questions about Snape
What is the average price for a property for sale in Snape?
The average price for a property for sale in Snape is £455,543. This amount is 18% higher than the average price in Saxmundham. There are 1,455 property listings for sale in Snape.
What streets have the most expensive properties for sale in Snape?
The streets with the most expensive properties for sale in Snape are Church Common at an average of £925,000, Priory Road at an average of £776,250 and Pryor Close at an average of £641,666.
What streets have the most affordable properties for sale in Snape?
The streets with the most affordable properties for sale in Snape are Meadow Walk at an average of £245,000, Festival Close at an average of £255,000 and Church Lane at an average of £266,000.
Which train stations are available in or near Snape?
Some of the train stations available in or near Snape are Saxmundham, Wickham Market and Darsham.
Property Price Paid in Snape by Year
The average sold property price by year was:
| Year | Average Sold Price | Price Change |
Sold Properties
|
|---|---|---|---|
| 2025 | £441,647 | 4% |
26 Properties |
| 2024 | £423,928 | -16% |
21 Properties |
| 2023 | £493,514 | -16% |
27 Properties |
| 2022 | £573,931 | 31% |
38 Properties |
| 2021 | £395,919 | 12% |
49 Properties |
| 2020 | £350,306 | -1% |
31 Properties |
| 2019 | £354,025 | -10% |
30 Properties |
| 2018 | £389,739 | 10% |
35 Properties |
| 2017 | £350,276 | -5% |
48 Properties |
| 2016 | £366,059 | 4% |
40 Properties |
| 2015 | £350,123 | 17% |
50 Properties |
| 2014 | £288,957 | -5% |
50 Properties |
| 2013 | £304,775 | 21% |
33 Properties |
| 2012 | £240,971 | -12% |
19 Properties |
| 2011 | £268,930 | 2% |
28 Properties |
| 2010 | £262,948 | 10% |
29 Properties |
| 2009 | £235,988 | -28% |
22 Properties |
| 2008 | £301,880 | 2% |
25 Properties |
| 2007 | £294,412 | -1% |
33 Properties |
| 2006 | £298,731 | 19% |
43 Properties |
| 2005 | £242,776 | 5% |
36 Properties |
| 2004 | £231,425 | 7% |
45 Properties |
| 2003 | £214,579 | 19% |
56 Properties |
| 2002 | £173,853 | 2% |
56 Properties |
| 2001 | £170,043 | 8% |
46 Properties |
| 2000 | £156,924 | 35% |
34 Properties |
| 1999 | £101,937 | 16% |
47 Properties |
| 1998 | £86,117 | 13% |
43 Properties |
| 1997 | £75,241 | 4% |
46 Properties |
| 1996 | £72,030 | 2% |
43 Properties |
| 1995 | £70,607 | - |
46 Properties |
Property Price per Property Type in Snape
Here you can find historic sold price data in order to help with your property search.
The average Property Paid Price for specific property types in the last three years are:
| Property Type | Average Sold Price | Sold Properties |
|---|---|---|
| Semi Detached House | £316,386.00 | 22 Semi Detached Houses |
| Detached House | £564,877.00 | 43 Detached Houses |
| Terraced House | £273,333.00 | 9 Terraced Houses |

