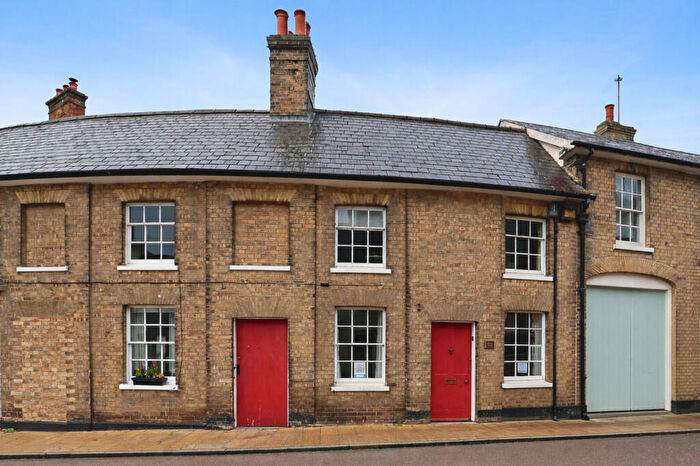
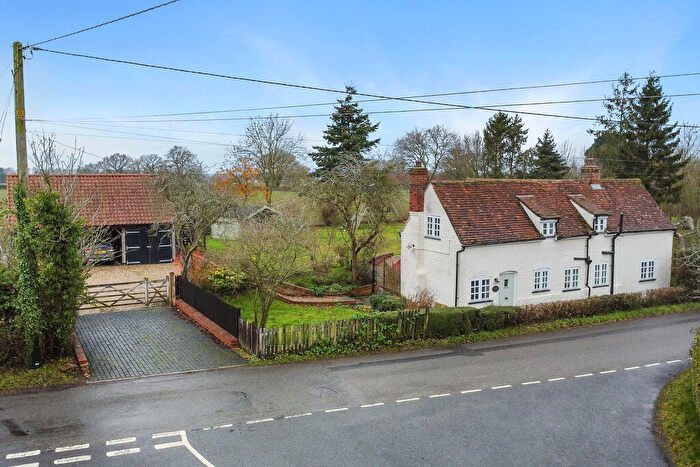
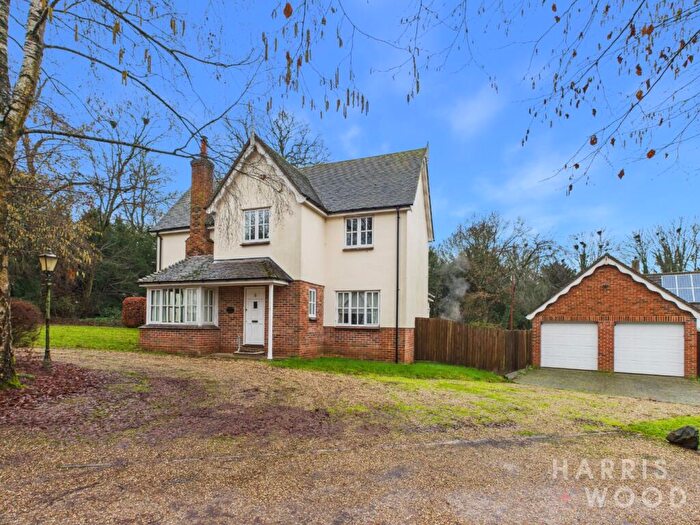
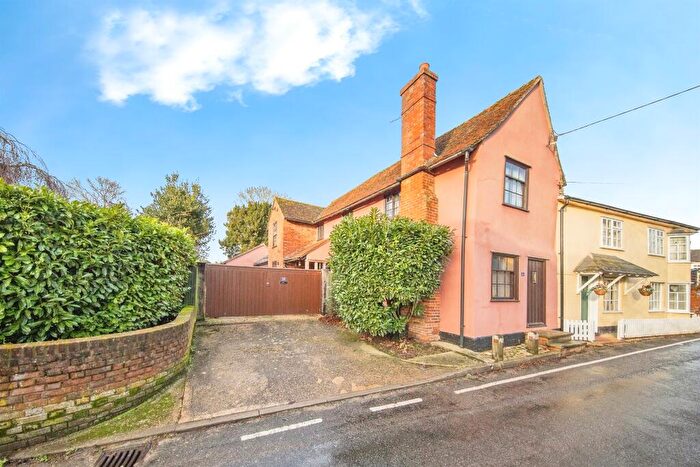
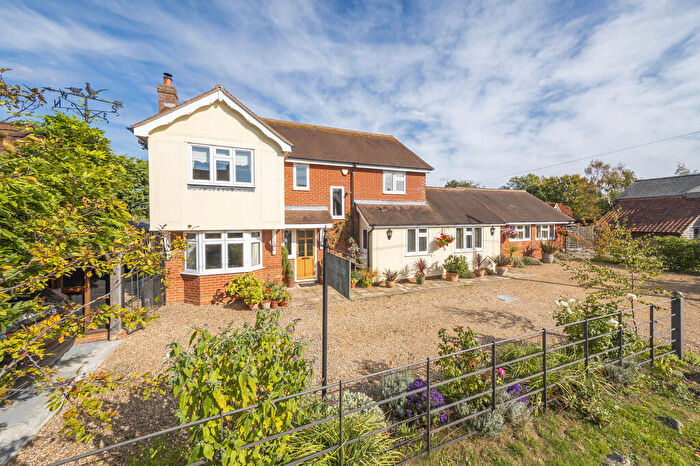
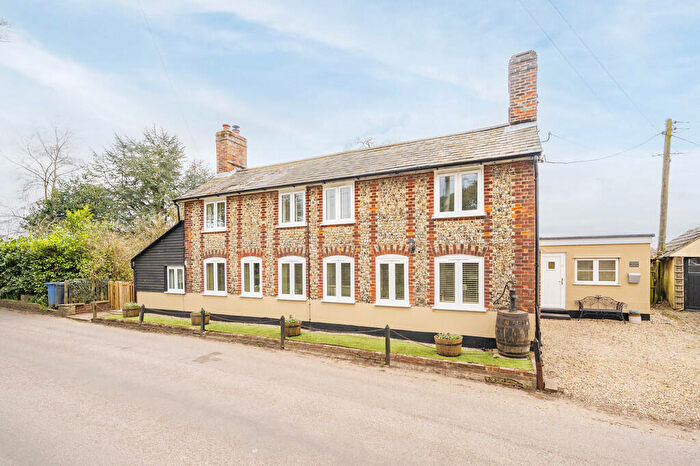
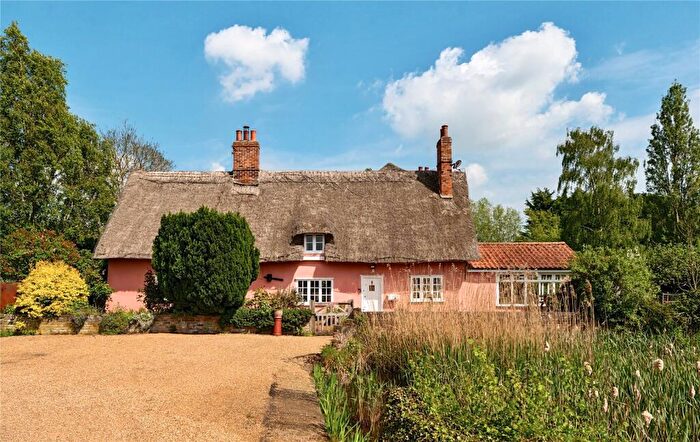
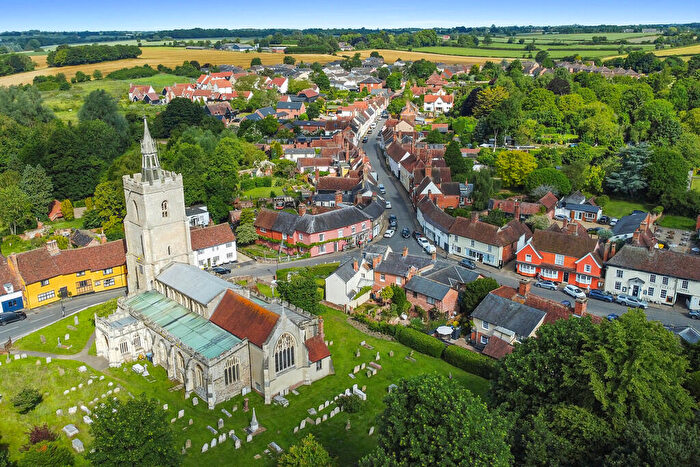
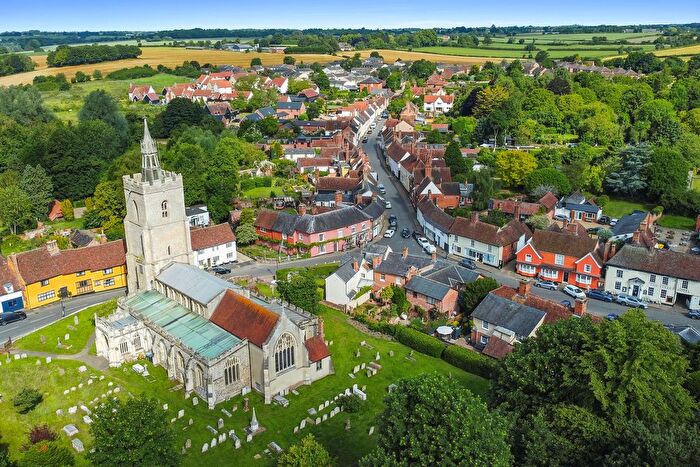
Houses for sale & to rent in Boxford, Sudbury
House Prices in Boxford
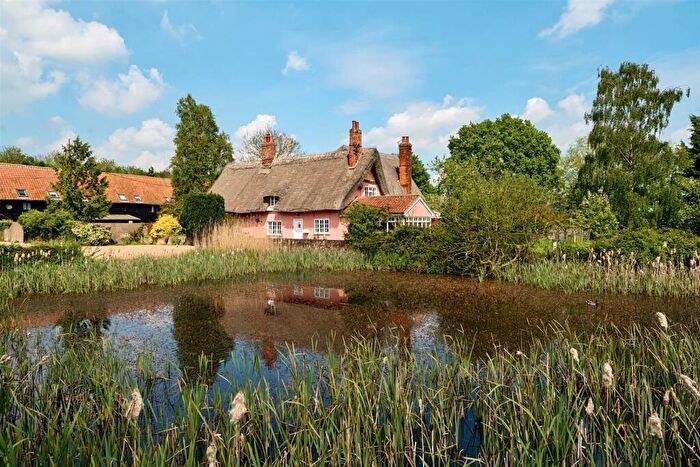
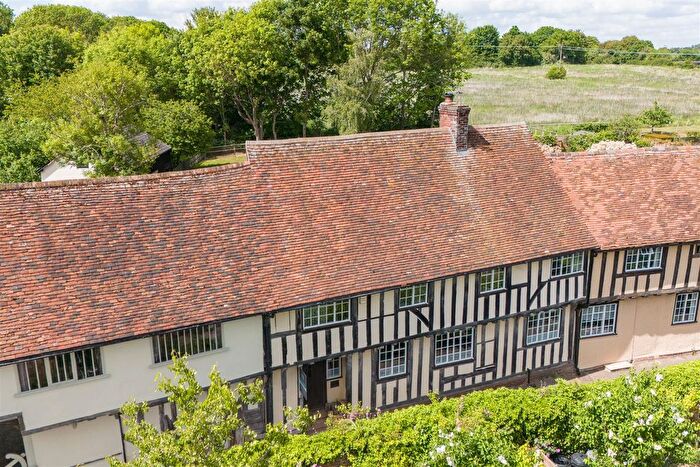
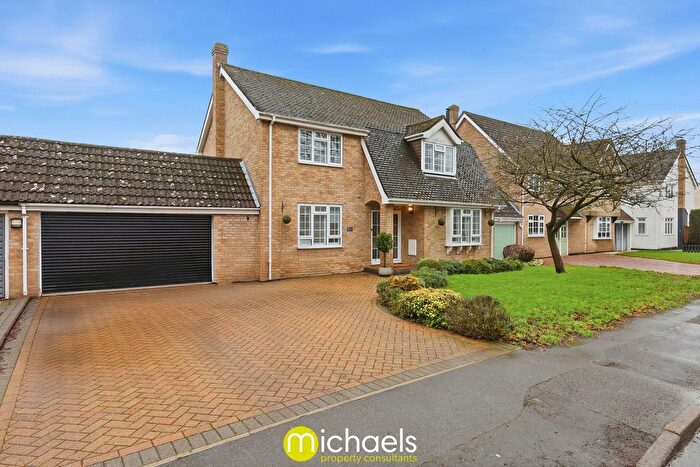
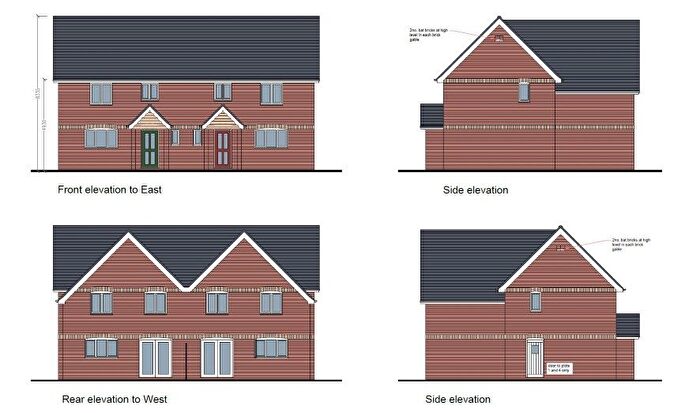
Properties in Boxford have an average house price of £460,644.00 and had 43 Property Transactions within the last 3 years¹.
Boxford is an area in Sudbury, Suffolk with 715 households², where the most expensive property was sold for £1,300,000.00.
Properties for sale in Boxford
Previously listed properties in Boxford
Roads and Postcodes in Boxford
Navigate through our locations to find the location of your next house in Boxford, Sudbury for sale or to rent.
| Streets | Postcodes |
|---|---|
| Ash Street | CO10 5HJ |
| Barfield Corner | CO10 5EB |
| Boxford Lane | CO10 5JU CO10 5JX |
| Brick Kiln Hill Cottages | CO10 5NT |
| Broad Street | CO10 5DX CO10 5EL |
| Brook Hall Road | CO10 5HS |
| Bulmer Lane | CO10 5EZ |
| Butchers Lane | CO10 5DZ CO10 5EA |
| Calais Street | CO10 5JA |
| Castlings Heath | CO10 5ES CO10 5EU |
| Cherry Ground Cottages | CO10 5JE |
| Church Street | CO10 5DU CO10 5EH CO10 5HD |
| Clubs Lane | CO10 5HN |
| Cox Hill | CO10 5HR CO10 5JG |
| Daisy Green | CO10 5EN |
| Daking Avenue | CO10 5QA |
| Ellis Street | CO10 5HH CO10 5HP |
| Fen Street | CO10 5HL |
| Groton Street | CO10 5EE |
| Gunary Close | CO10 5QB |
| Hadleigh Road | CO10 5JH |
| Holbrook Barn Road | CO10 5HU |
| Homefield | CO10 5PB |
| Horners Green | CO10 5HB |
| Howe Road | CO10 5HE |
| Marsh Road | CO10 5HT |
| Milden Hall Cottages | CO10 9NY |
| Mill Green | CO10 5PX CO10 5PY CO10 5PZ |
| Park Corner Road | CO10 5EG |
| Parliament Heath | CO10 5EP |
| Polstead Road | CO10 5JW |
| Priory Green | CO10 5PN CO10 5PP |
| Rectory Park | CO10 5JS |
| Round Maple | CO10 5PR CO10 5PS |
| Roylands Lane | CO10 5HZ |
| Rules Yard | CO10 5DW |
| Sandhill | CO10 5HX |
| School Green | CO10 5PJ |
| School Hill | CO10 5JT |
| Sherbourne Street | CO10 5PD CO10 5QE |
| Stone Street | CO10 5NR |
| Stone Street Road | CO10 5NP |
| Swan Street | CO10 5NZ CO10 5QD |
| Temple Bar | CO10 5PH |
| The Causeway | CO10 5JR |
| The Winthrops | CO10 5QG |
| Wash Lane | CO10 5JD |
| Willow Corner | CO10 5PG |
| CO10 5EJ CO10 5PL |
Transport near Boxford
- FAQ
- Price Paid By Year
- Property Type Price
Frequently asked questions about Boxford
What is the average price for a property for sale in Boxford?
The average price for a property for sale in Boxford is £460,644. This amount is 34% higher than the average price in Sudbury. There are 192 property listings for sale in Boxford.
What streets have the most expensive properties for sale in Boxford?
The streets with the most expensive properties for sale in Boxford are Church Street at an average of £923,750, Broad Street at an average of £825,000 and Priory Green at an average of £762,500.
What streets have the most affordable properties for sale in Boxford?
The streets with the most affordable properties for sale in Boxford are Gunary Close at an average of £235,000, Swan Street at an average of £247,442 and Ellis Street at an average of £295,500.
Which train stations are available in or near Boxford?
Some of the train stations available in or near Boxford are Sudbury, Bures and Chappel and Wakes Colne.
Property Price Paid in Boxford by Year
The average sold property price by year was:
| Year | Average Sold Price | Price Change |
Sold Properties
|
|---|---|---|---|
| 2025 | £394,521 | -21% |
10 Properties |
| 2024 | £478,000 | -1% |
18 Properties |
| 2023 | £483,900 | -7% |
15 Properties |
| 2022 | £515,966 | 6% |
15 Properties |
| 2021 | £484,404 | 13% |
40 Properties |
| 2020 | £420,450 | -5% |
30 Properties |
| 2019 | £443,026 | 1% |
19 Properties |
| 2018 | £439,827 | 18% |
30 Properties |
| 2017 | £359,699 | -11% |
26 Properties |
| 2016 | £398,687 | 16% |
32 Properties |
| 2015 | £333,479 | -8% |
24 Properties |
| 2014 | £360,875 | 19% |
32 Properties |
| 2013 | £291,023 | -17% |
21 Properties |
| 2012 | £341,875 | 2% |
20 Properties |
| 2011 | £335,903 | 10% |
30 Properties |
| 2010 | £303,988 | 1% |
25 Properties |
| 2009 | £300,463 | 10% |
15 Properties |
| 2008 | £270,261 | -24% |
18 Properties |
| 2007 | £334,638 | 4% |
29 Properties |
| 2006 | £321,800 | 3% |
47 Properties |
| 2005 | £313,546 | 22% |
32 Properties |
| 2004 | £244,825 | -9% |
30 Properties |
| 2003 | £266,804 | -7% |
33 Properties |
| 2002 | £284,691 | 33% |
42 Properties |
| 2001 | £190,851 | 13% |
27 Properties |
| 2000 | £165,842 | 27% |
29 Properties |
| 1999 | £121,675 | -6% |
20 Properties |
| 1998 | £129,330 | 16% |
25 Properties |
| 1997 | £108,504 | 10% |
46 Properties |
| 1996 | £97,229 | -7% |
25 Properties |
| 1995 | £103,551 | - |
34 Properties |
Property Price per Property Type in Boxford
Here you can find historic sold price data in order to help with your property search.
The average Property Paid Price for specific property types in the last three years are:
| Property Type | Average Sold Price | Sold Properties |
|---|---|---|
| Semi Detached House | £301,150.00 | 10 Semi Detached Houses |
| Detached House | £613,476.00 | 21 Detached Houses |
| Terraced House | £343,121.00 | 10 Terraced Houses |
| Flat | £241,000.00 | 2 Flats |

