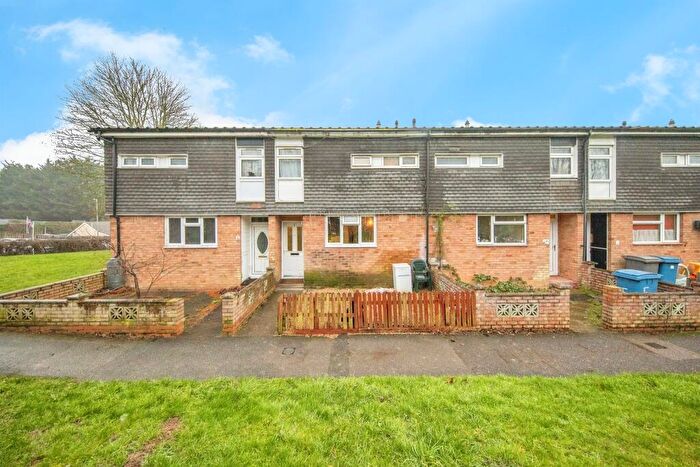
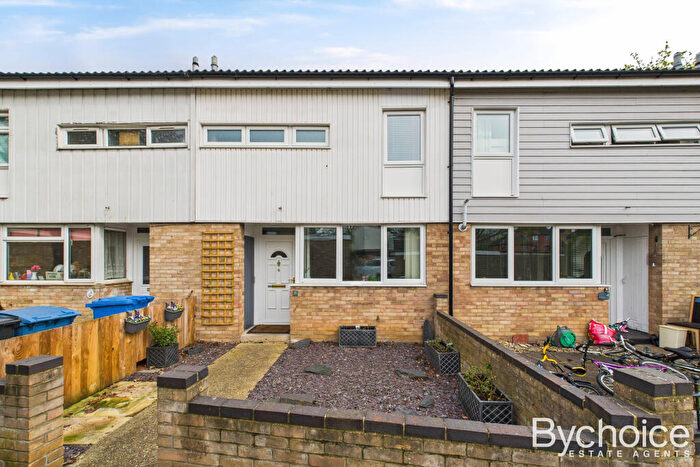
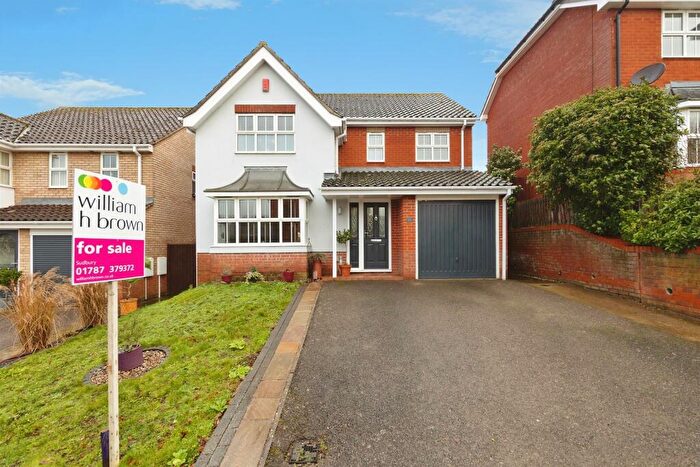
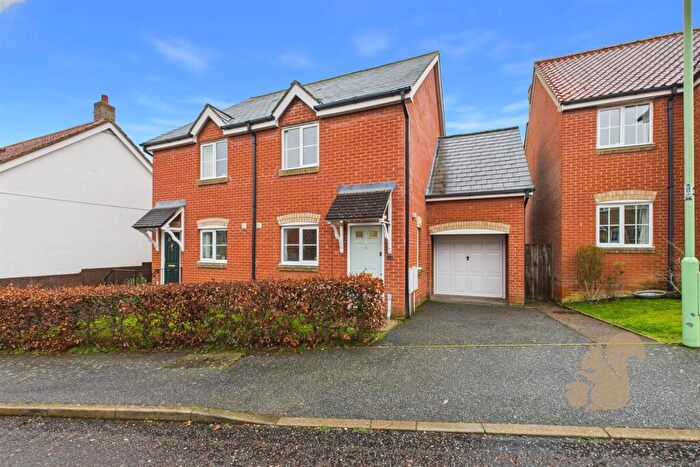
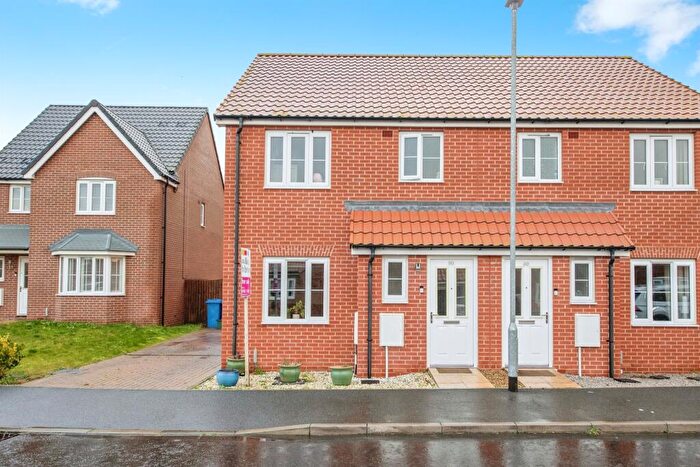
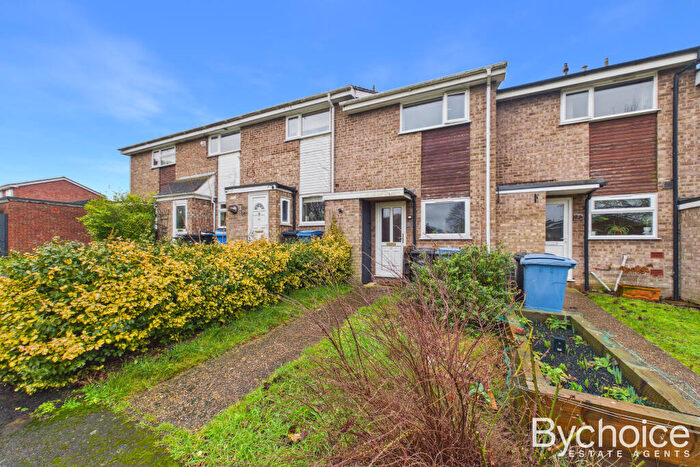
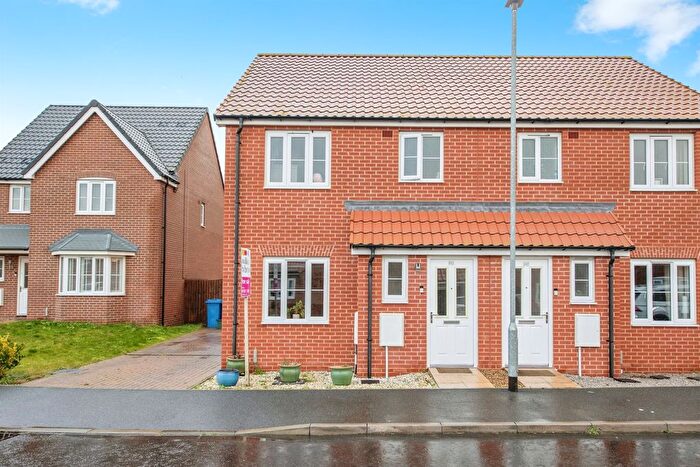
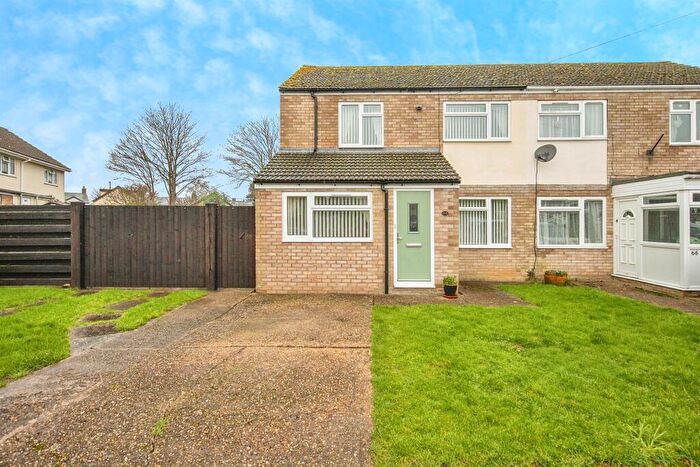
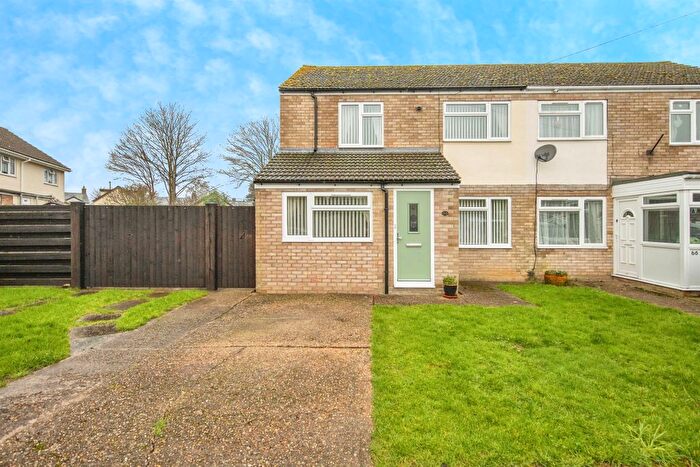
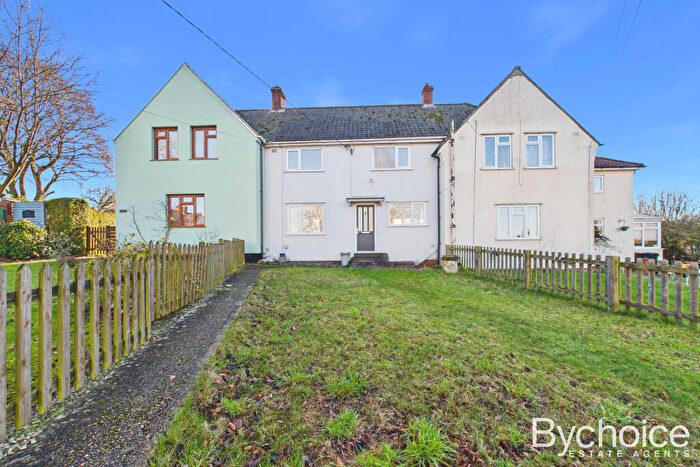
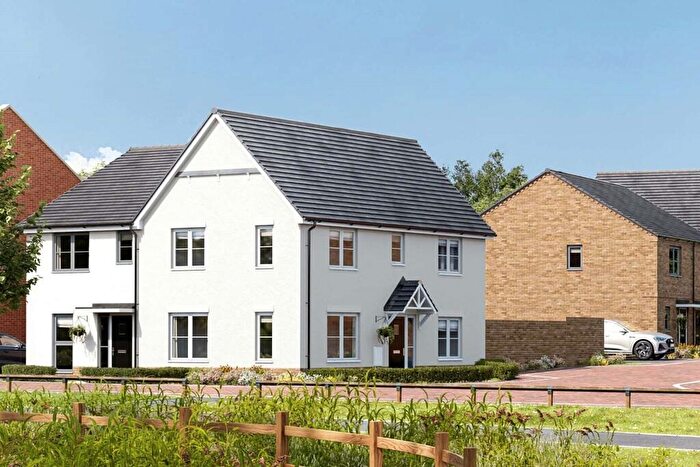
Houses for sale & to rent in Sudbury, Suffolk
House Prices in Sudbury
Properties in Sudbury have an average house price of £342,621.00 and had 1,862 Property Transactions within the last 3 years.¹
Sudbury is an area in Suffolk with 19,285 households², where the most expensive property was sold for £2,770,000.00.
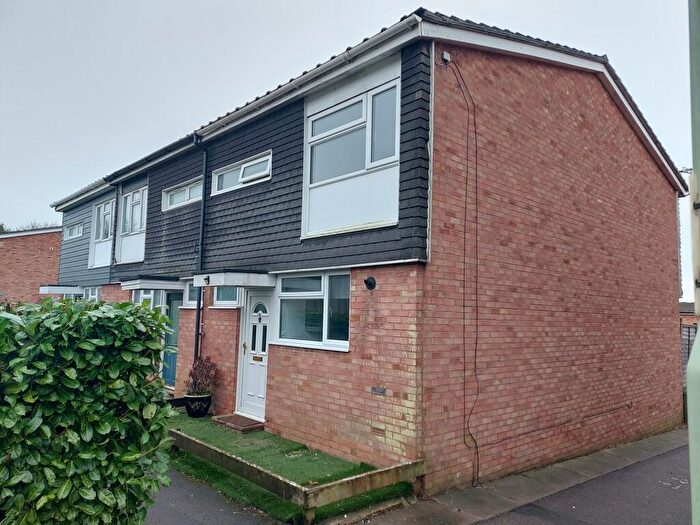
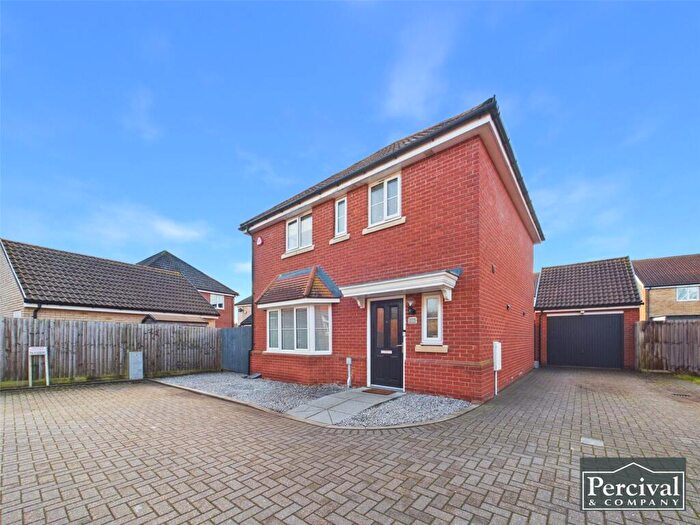
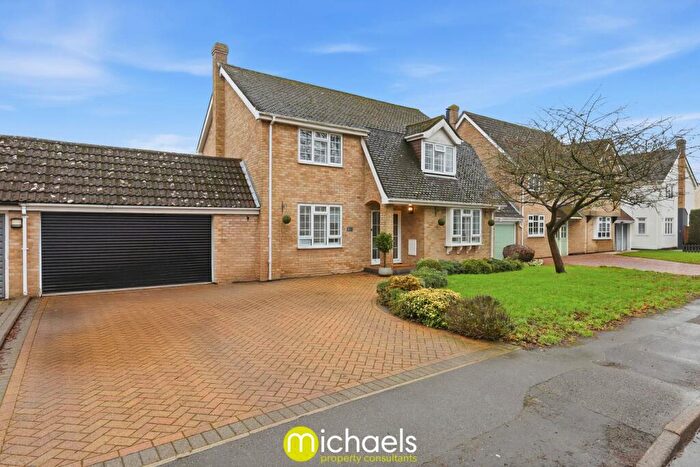
Properties for sale in Sudbury
Neighbourhoods in Sudbury
Navigate through our locations to find the location of your next house in Sudbury, Suffolk for sale or to rent.
- Boxford
- Bures St Mary
- Cavendish
- Chadacre
- Clare
- Glemsford And Stanstead
- Great Cornard North
- Great Cornard South
- Hundon
- Lavenham
- Leavenheath
- Long Melford
- Lower Brett
- North Cosford
- Sudbury East
- Sudbury North
- Sudbury South
- Waldingfield
- Great Cornard
- Assington
- Sudbury South East
- Sudbury North West
- Sudbury North East
- Sudbury South West
- Box Vale
- Bures St Mary & Nayland
- Clare, Hundon & Kedington
- Whepstead & Wickhambrook
- North West Cosford
Transport in Sudbury
Please see below transportation links in this area:
- FAQ
- Price Paid By Year
- Property Type Price
Frequently asked questions about Sudbury
What is the average price for a property for sale in Sudbury?
The average price for a property for sale in Sudbury is £342,621. This amount is 7% higher than the average price in Suffolk. There are more than 10,000 property listings for sale in Sudbury.
What locations have the most expensive properties for sale in Sudbury?
The locations with the most expensive properties for sale in Sudbury are North Cosford at an average of £749,071, Leavenheath at an average of £667,550 and Box Vale at an average of £525,000.
What locations have the most affordable properties for sale in Sudbury?
The locations with the most affordable properties for sale in Sudbury are Sudbury South West at an average of £213,045, Sudbury East at an average of £257,958 and Sudbury South at an average of £267,391.
Which train stations are available in or near Sudbury?
Some of the train stations available in or near Sudbury are Sudbury, Bures and Chappel and Wakes Colne.
Property Price Paid in Sudbury by Year
The average sold property price by year was:
| Year | Average Sold Price | Price Change |
Sold Properties
|
|---|---|---|---|
| 2025 | £336,971 | 2% |
610 Properties |
| 2024 | £330,847 | -9% |
661 Properties |
| 2023 | £361,622 | 2% |
591 Properties |
| 2022 | £354,220 | 5% |
797 Properties |
| 2021 | £337,111 | 5% |
1,132 Properties |
| 2020 | £320,715 | 8% |
780 Properties |
| 2019 | £295,283 | -1% |
877 Properties |
| 2018 | £298,179 | 4% |
884 Properties |
| 2017 | £286,047 | 4% |
919 Properties |
| 2016 | £273,868 | 7% |
889 Properties |
| 2015 | £254,741 | 6% |
882 Properties |
| 2014 | £240,571 | 11% |
915 Properties |
| 2013 | £213,791 | -1% |
784 Properties |
| 2012 | £216,502 | -4% |
685 Properties |
| 2011 | £226,066 | - |
665 Properties |
| 2010 | £225,987 | 12% |
689 Properties |
| 2009 | £197,859 | -1% |
708 Properties |
| 2008 | £199,119 | -10% |
624 Properties |
| 2007 | £219,885 | 2% |
1,094 Properties |
| 2006 | £214,570 | 5% |
1,180 Properties |
| 2005 | £202,964 | 9% |
851 Properties |
| 2004 | £184,347 | 10% |
927 Properties |
| 2003 | £165,195 | 10% |
926 Properties |
| 2002 | £148,607 | 24% |
1,024 Properties |
| 2001 | £113,304 | 12% |
996 Properties |
| 2000 | £99,662 | 15% |
941 Properties |
| 1999 | £85,067 | 9% |
1,082 Properties |
| 1998 | £77,333 | 4% |
926 Properties |
| 1997 | £74,110 | 8% |
1,045 Properties |
| 1996 | £68,097 | 3% |
946 Properties |
| 1995 | £66,393 | - |
670 Properties |
Property Price per Property Type in Sudbury
Here you can find historic sold price data in order to help with your property search.
The average Property Paid Price for specific property types in the last three years are:
| Property Type | Average Sold Price | Sold Properties |
|---|---|---|
| Semi Detached House | £307,925.00 | 496 Semi Detached Houses |
| Terraced House | £264,318.00 | 576 Terraced Houses |
| Detached House | £476,161.00 | 647 Detached Houses |
| Flat | £174,175.00 | 143 Flats |

