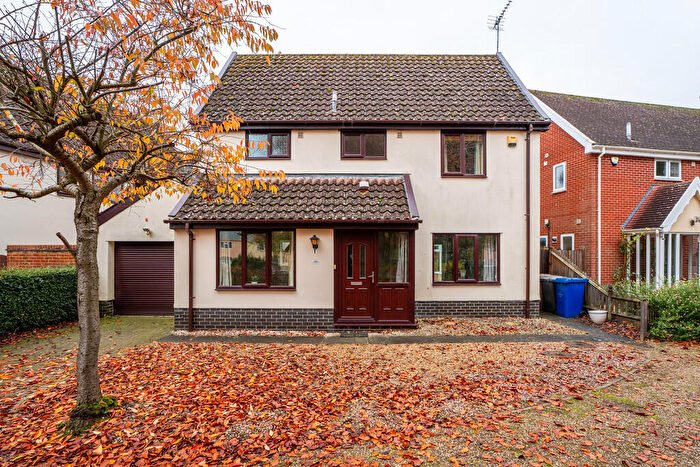
Houses for sale & to rent in Clare, Sudbury
House Prices in Clare
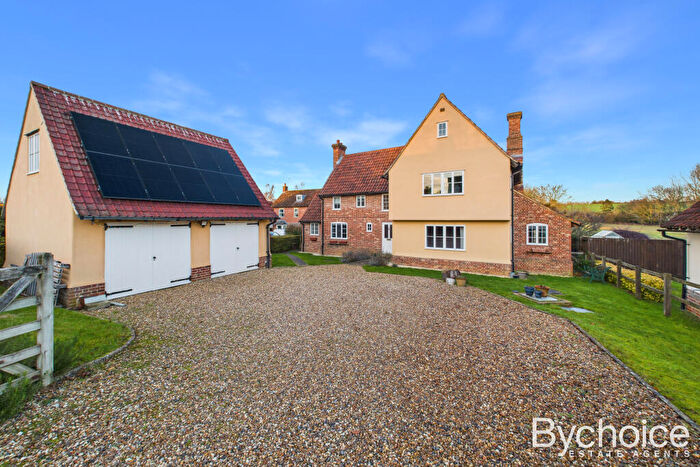
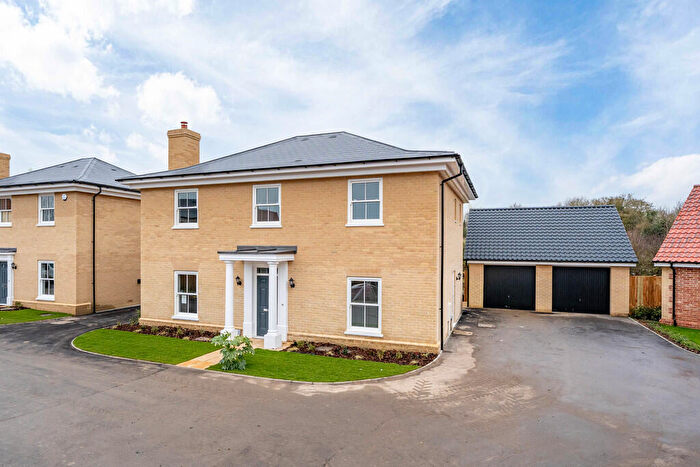
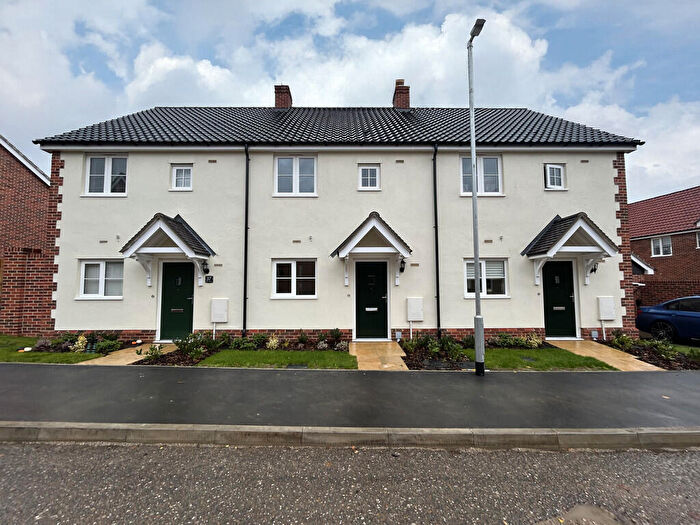
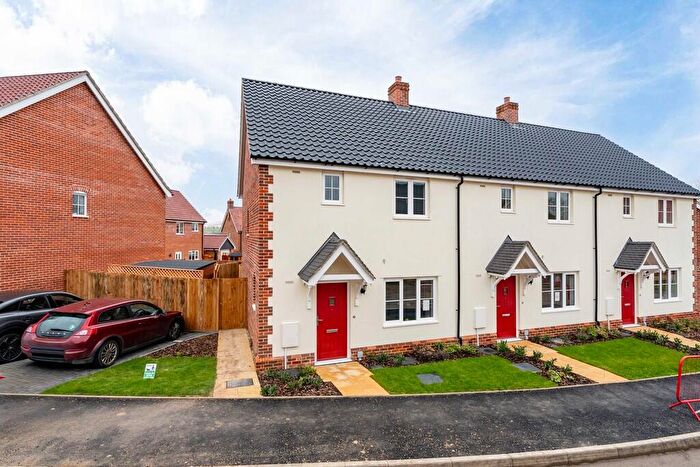
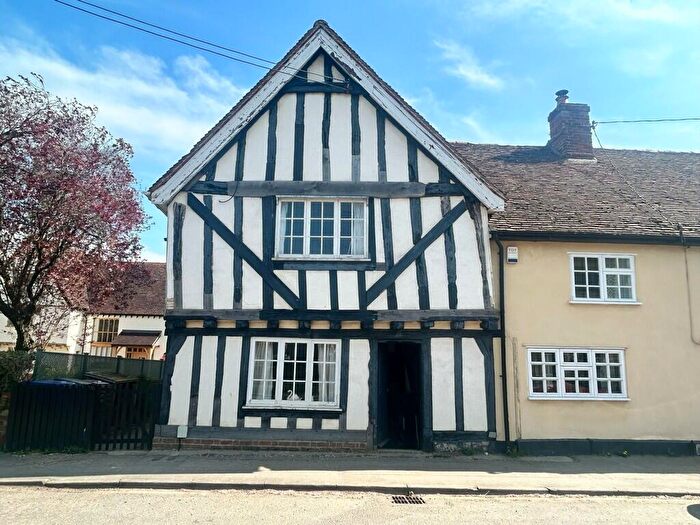
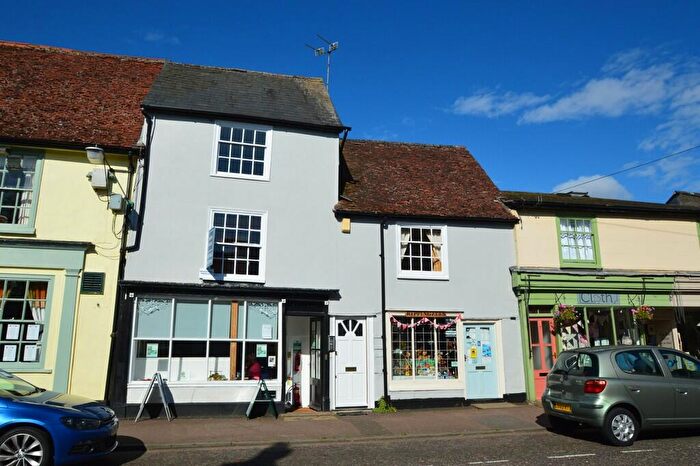
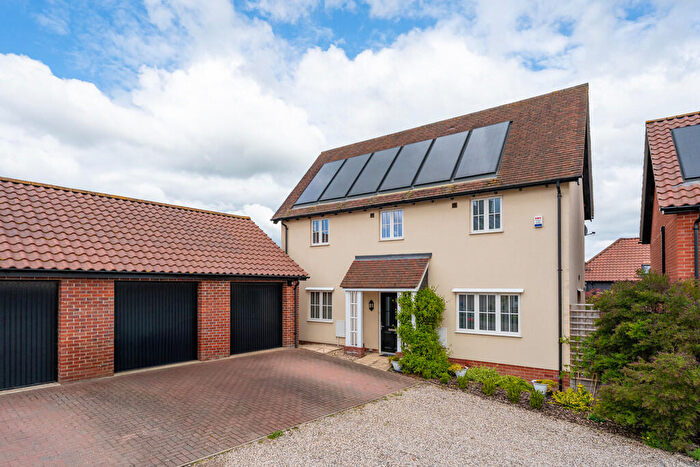
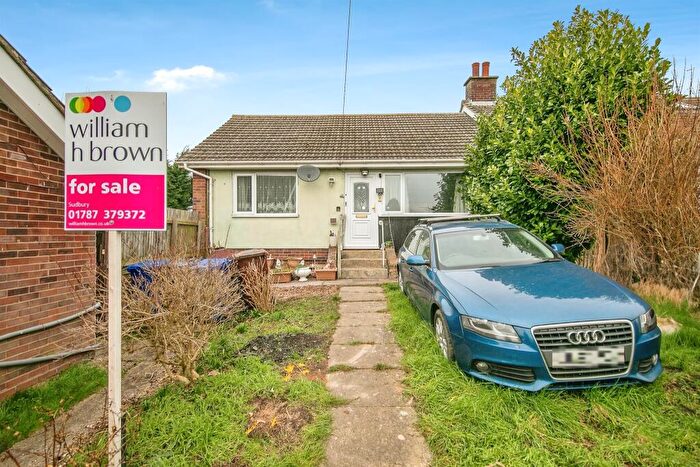
Properties in Clare have an average house price of £380,594.00 and had 105 Property Transactions within the last 3 years¹.
Clare is an area in Sudbury, Suffolk with 913 households², where the most expensive property was sold for £1,175,000.00.
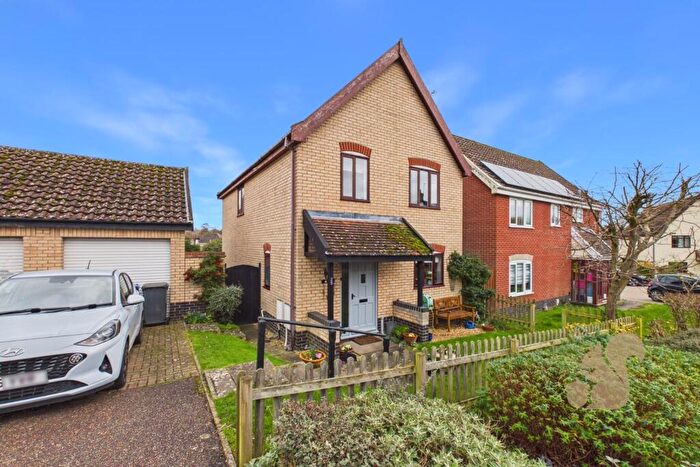
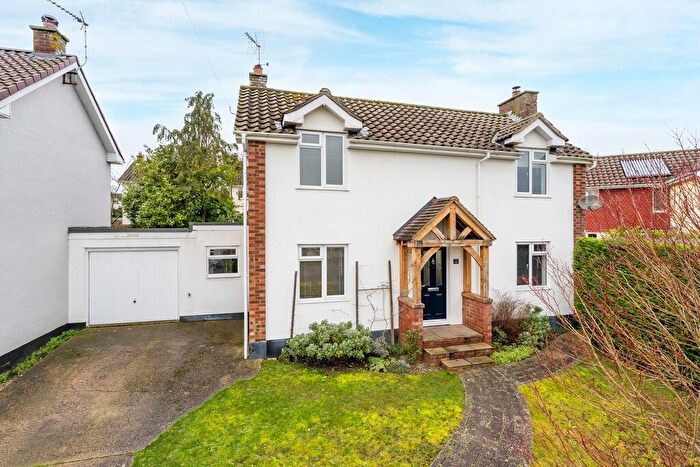
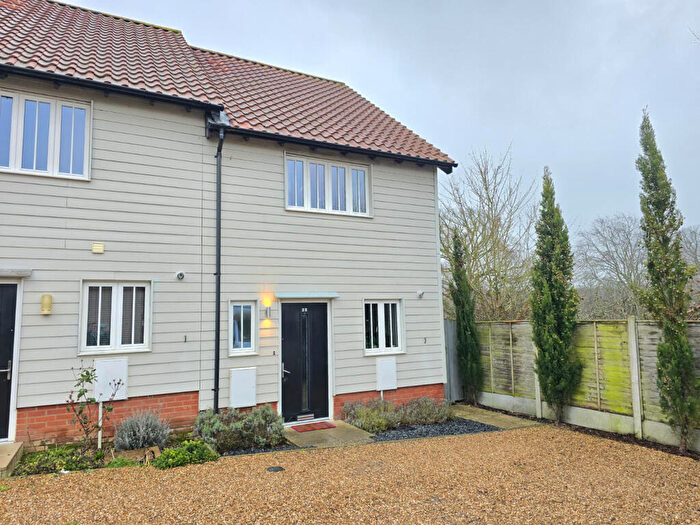
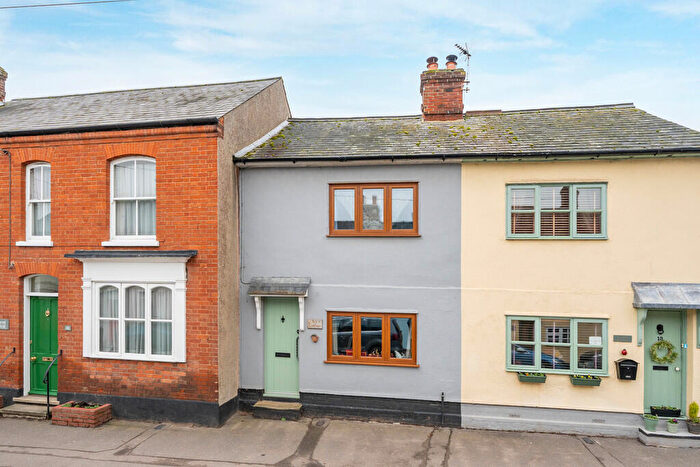
Properties for sale in Clare
Previously listed properties in Clare
Roads and Postcodes in Clare
Navigate through our locations to find the location of your next house in Clare, Sudbury for sale or to rent.
| Streets | Postcodes |
|---|---|
| Acre Walk | CO10 8RG |
| Ashen Road | CO10 8NX |
| Bailey Lane | CO10 8PP |
| Barehams Yard | CO10 8PS |
| Bloomfield Court | CO10 8NL |
| Boat House Mews | CO10 8NG |
| Bridewell Street | CO10 8QD |
| Broadway | CO10 8PN |
| Callis Street | CO10 8PX |
| Cavendish Road | CO10 8PE CO10 8PH CO10 8PJ |
| Chilton Street | CO10 8QS |
| Church Lane | CO10 8PB |
| Church Street | CO10 8PD |
| Clarence Road | CO10 8QN |
| Common Street | CO10 8QB |
| Daneum Holt | CO10 8HE |
| De Burgh Place | CO10 8QL |
| Erbury Place | CO10 8PZ |
| Gilbert Road | CO10 8QW |
| Gloucester Place | CO10 8QR |
| Gosford Close | CO10 8PT |
| Hermitage Close | CO10 8PU |
| Hermitage Meadow | CO10 8QQ |
| Hertford Road | CO10 8QH CO10 8QJ |
| High Street | CO10 8NY |
| Highfield | CO10 8PG CO10 8PQ |
| Hill Terrace | CO10 8PL |
| Lutus Close | CO10 8HB |
| Malting Lane | CO10 8NW |
| March Place | CO10 8RH |
| Market Hill | CO10 8NN |
| Mortimer Place | CO10 8QP |
| Nethergate Street | CO10 8NP |
| Pashlers Alley | CO10 8NF |
| Poslingford Corner | CO10 8QT |
| Riverbank Close | CO10 8PR |
| Sheepgate Lane | CO10 8RQ |
| Snow Hill | CO10 8QE CO10 8QF |
| Station Road | CO10 8NJ |
| Stoke Road | CO10 8HG CO10 8HH CO10 8NS |
| Stour Vale | CO10 8NT |
| The Granary | CO10 8LL |
| Well Lane | CO10 8NH |
| Wentford View | CO10 8QG |
| Westfield | CO10 8NU |
Transport near Clare
-
Sudbury Station
-
Bures Station
-
Dullingham Station
-
Chappel and Wakes Colne Station
-
Newmarket Station
-
Bury St.Edmunds Station
-
Kennett Station
-
Braintree Station
-
Braintree Freeport Station
- FAQ
- Price Paid By Year
- Property Type Price
Frequently asked questions about Clare
What is the average price for a property for sale in Clare?
The average price for a property for sale in Clare is £380,594. This amount is 11% higher than the average price in Sudbury. There are 200 property listings for sale in Clare.
What streets have the most expensive properties for sale in Clare?
The streets with the most expensive properties for sale in Clare are Chilton Street at an average of £743,333, Callis Street at an average of £690,000 and Hermitage Meadow at an average of £652,500.
What streets have the most affordable properties for sale in Clare?
The streets with the most affordable properties for sale in Clare are High Street at an average of £170,000, Bailey Lane at an average of £236,666 and Westfield at an average of £270,071.
Which train stations are available in or near Clare?
Some of the train stations available in or near Clare are Sudbury, Bures and Dullingham.
Property Price Paid in Clare by Year
The average sold property price by year was:
| Year | Average Sold Price | Price Change |
Sold Properties
|
|---|---|---|---|
| 2025 | £405,619 | 8% |
33 Properties |
| 2024 | £374,513 | 3% |
38 Properties |
| 2023 | £363,102 | -30% |
34 Properties |
| 2022 | £471,085 | 30% |
41 Properties |
| 2021 | £331,788 | -6% |
45 Properties |
| 2020 | £351,416 | 10% |
30 Properties |
| 2019 | £316,351 | -17% |
28 Properties |
| 2018 | £371,081 | 14% |
35 Properties |
| 2017 | £320,202 | -6% |
43 Properties |
| 2016 | £340,005 | 8% |
37 Properties |
| 2015 | £313,823 | -3% |
36 Properties |
| 2014 | £324,093 | 23% |
47 Properties |
| 2013 | £250,490 | -15% |
36 Properties |
| 2012 | £288,158 | 7% |
25 Properties |
| 2011 | £266,818 | -0,2% |
33 Properties |
| 2010 | £267,463 | -4% |
41 Properties |
| 2009 | £279,162 | 19% |
30 Properties |
| 2008 | £227,500 | -28% |
26 Properties |
| 2007 | £292,140 | 5% |
57 Properties |
| 2006 | £278,240 | -1% |
66 Properties |
| 2005 | £280,191 | 20% |
40 Properties |
| 2004 | £223,889 | 8% |
56 Properties |
| 2003 | £206,545 | 12% |
36 Properties |
| 2002 | £182,320 | 14% |
37 Properties |
| 2001 | £156,852 | 19% |
33 Properties |
| 2000 | £126,602 | 20% |
40 Properties |
| 1999 | £100,890 | -3% |
42 Properties |
| 1998 | £104,395 | 1% |
49 Properties |
| 1997 | £103,513 | 18% |
44 Properties |
| 1996 | £84,878 | 12% |
53 Properties |
| 1995 | £74,296 | - |
29 Properties |
Property Price per Property Type in Clare
Here you can find historic sold price data in order to help with your property search.
The average Property Paid Price for specific property types in the last three years are:
| Property Type | Average Sold Price | Sold Properties |
|---|---|---|
| Semi Detached House | £332,333.00 | 27 Semi Detached Houses |
| Detached House | £489,219.00 | 43 Detached Houses |
| Terraced House | £296,451.00 | 31 Terraced Houses |
| Flat | £190,750.00 | 4 Flats |

