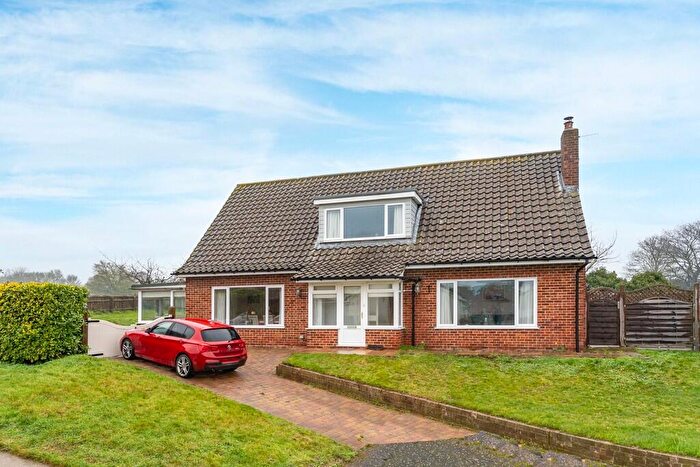
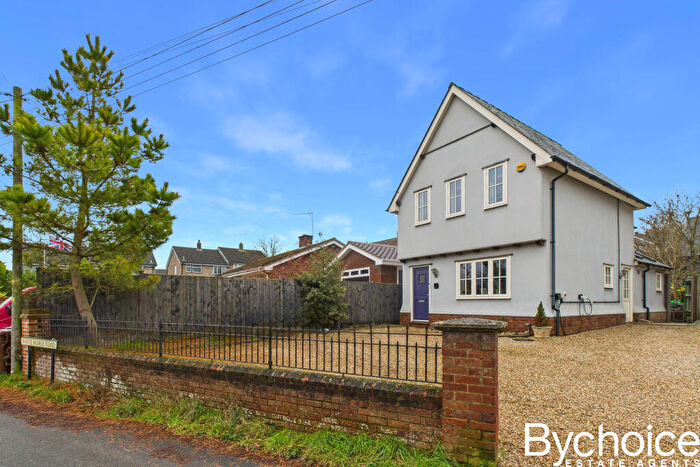
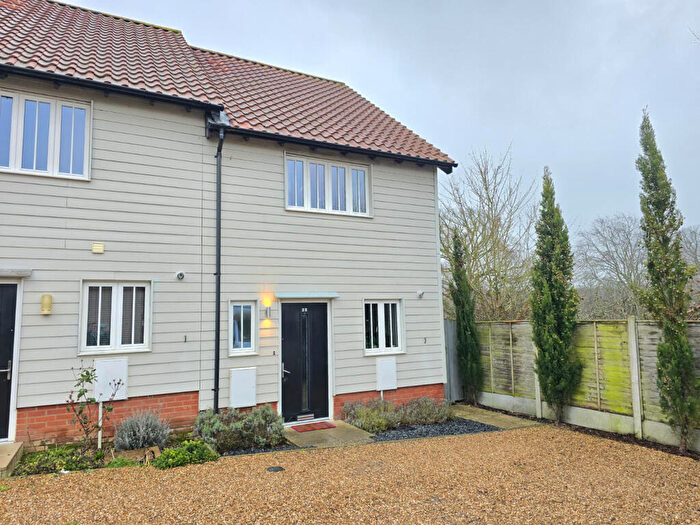
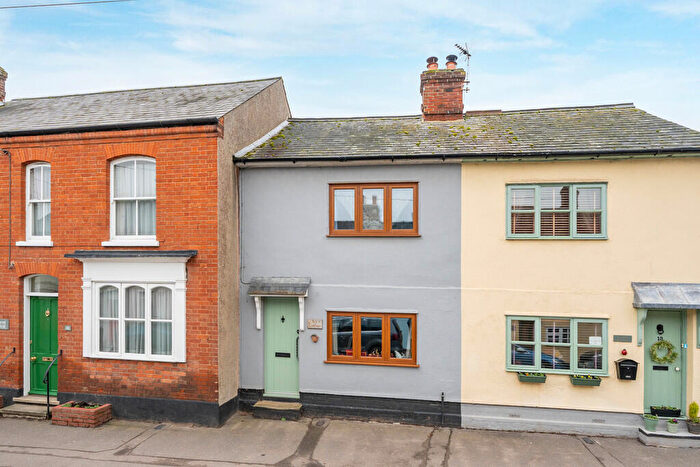
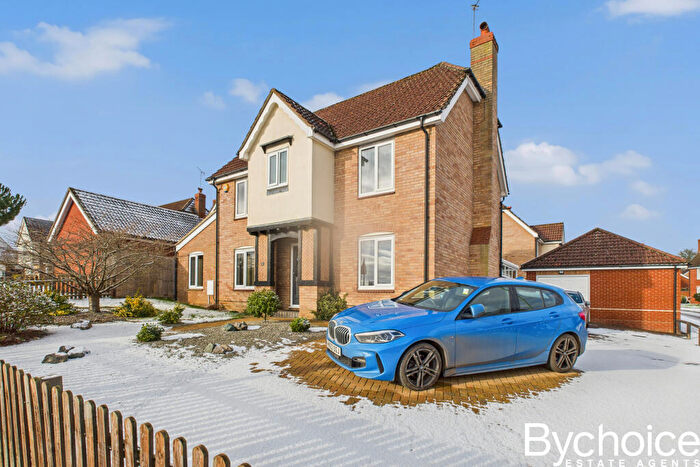
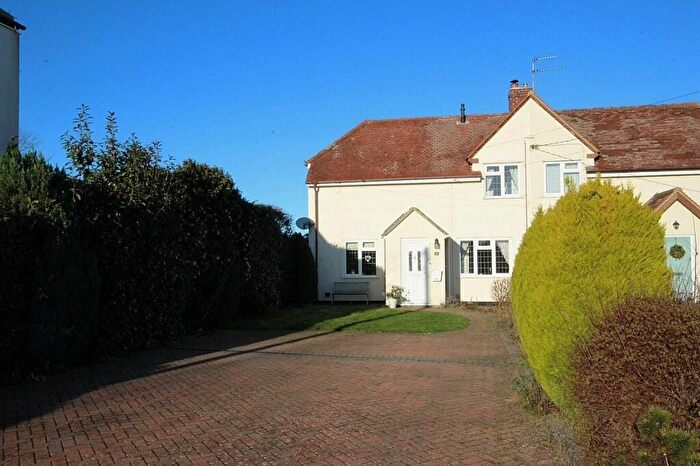
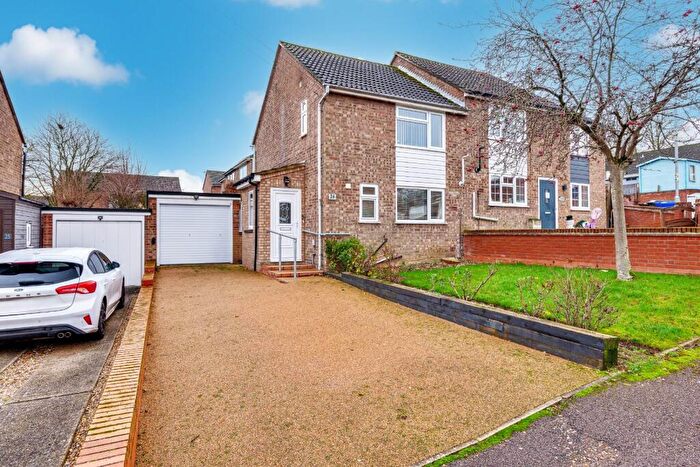
Houses for sale & to rent in Hundon, Sudbury
House Prices in Hundon
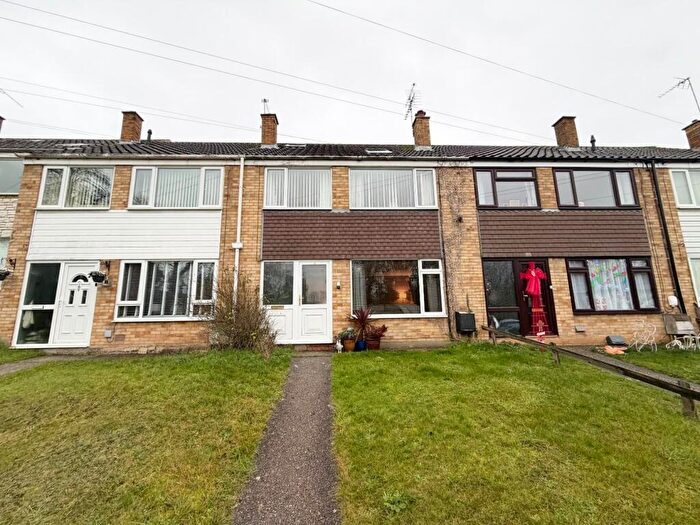
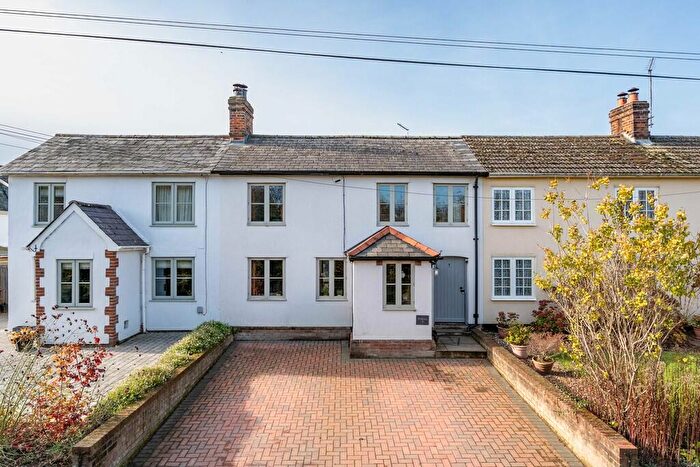
Properties in Hundon have an average house price of £441,229.00 and had 74 Property Transactions within the last 3 years¹.
Hundon is an area in Sudbury, Suffolk with 716 households², where the most expensive property was sold for £1,100,000.00.
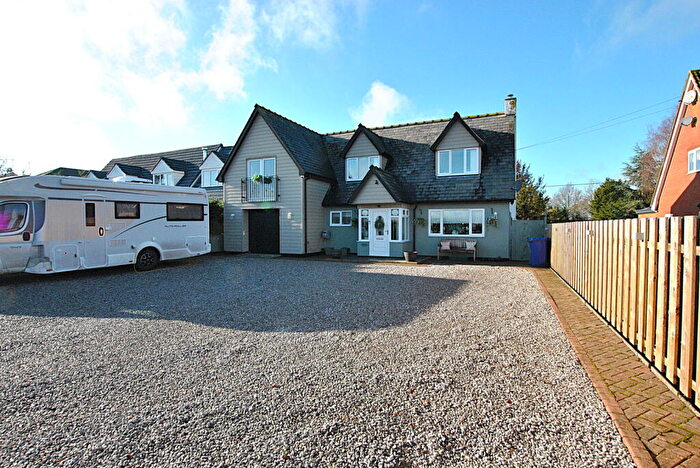
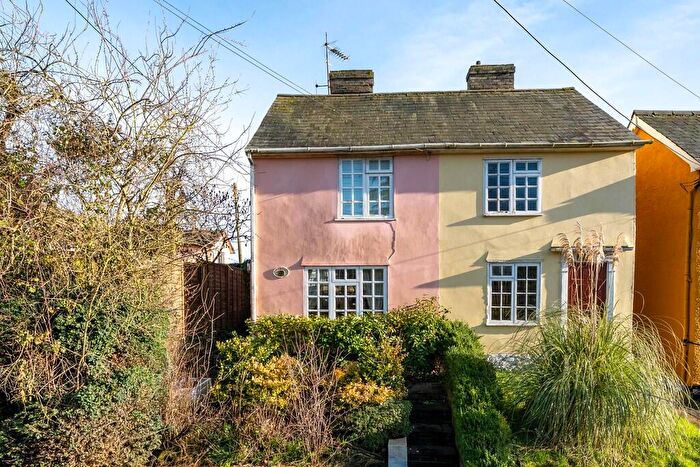
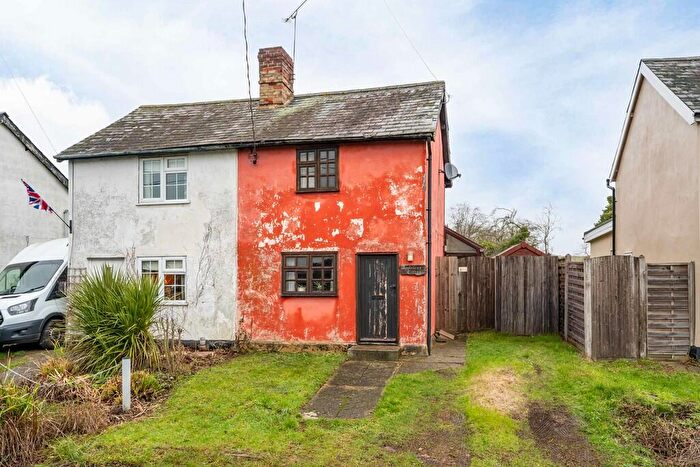
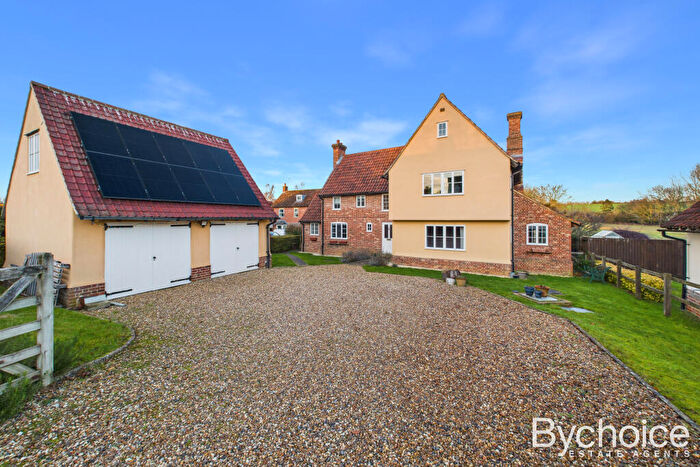
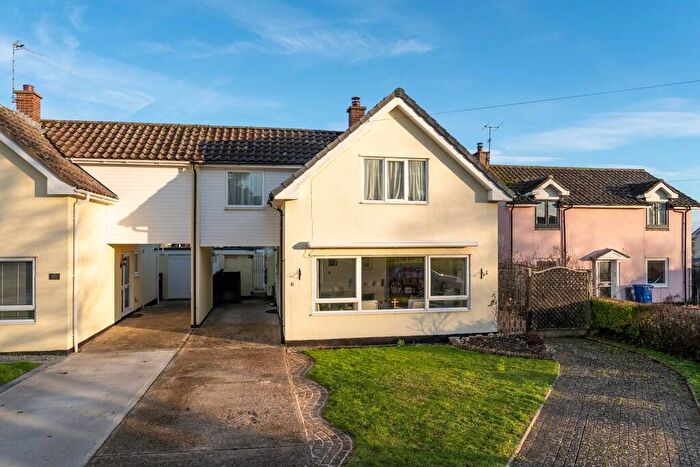
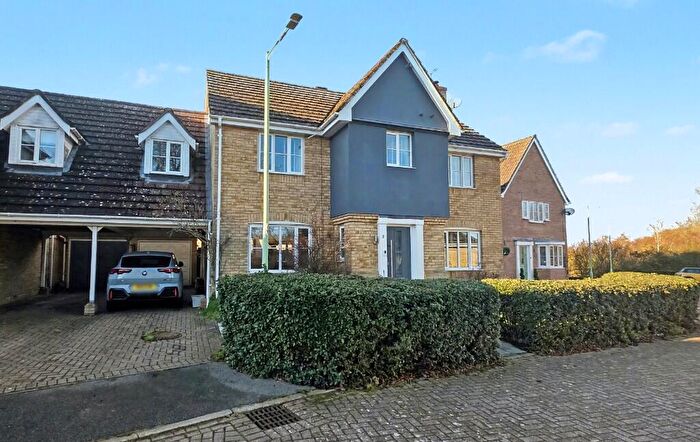
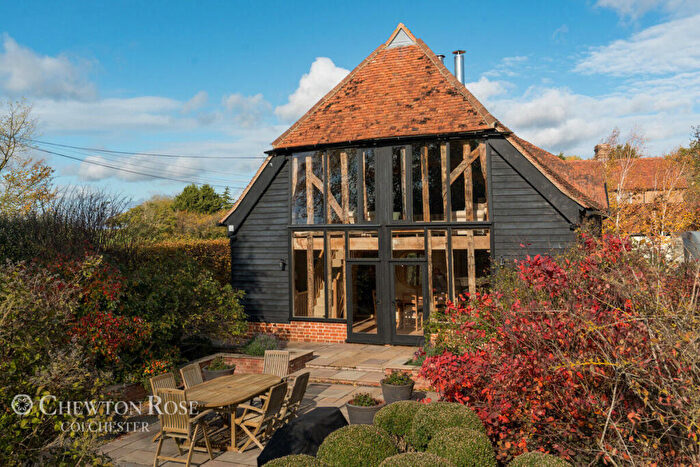
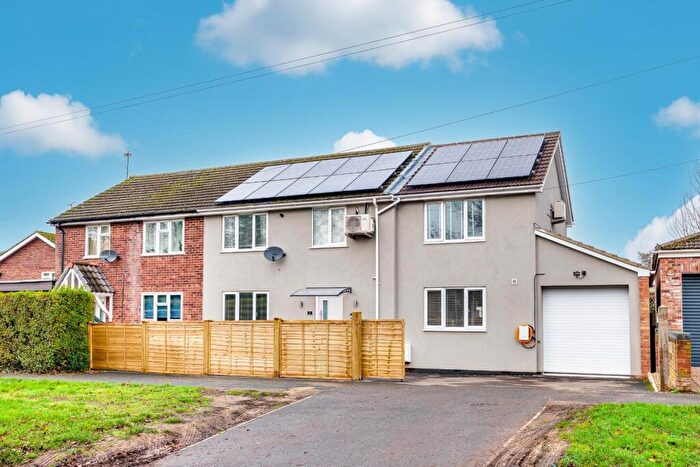
Properties for sale in Hundon
Roads and Postcodes in Hundon
Navigate through our locations to find the location of your next house in Hundon, Sudbury for sale or to rent.
| Streets | Postcodes |
|---|---|
| Armstrong Close | CO10 8HD |
| Ashen Lane | CO10 8JA |
| Barnadiston Road | CO10 8EL |
| Boyton End | CO10 8TA CO10 8TB CO10 8TD |
| Brockley Green | CO10 8DT |
| Brook Close | CO10 8SD |
| Chapel Street | CO10 8HS CO10 8HT |
| Chimney Street | CO10 8DX |
| Church Park | CO10 8JB |
| Church Street | CO10 8ER CO10 8EW |
| Church Terrace | CO10 8UJ |
| Church View | CO10 8UH |
| Clare Road | CO10 8DH CO10 8DL CO10 8DN |
| Clock Hall Lane | CO10 8BG |
| Farmerie Road | CO10 8HA |
| Folley Road | CO10 8EY |
| Galley Road | CO10 8SA |
| Hall Road | CO10 8ET |
| Lower Green | CO10 8HN |
| Lower North Street | CO10 8EA CO10 8EB |
| Lower Road | CO10 8DZ |
| Mill Lane | CO10 8EP |
| Mill Road | CO10 8EG CO10 8EH |
| Mount Pleasant | CO10 8DW |
| North Street | CO10 8ED CO10 8EE |
| Rogeron Close | CO10 8SB |
| School Green | CO10 8HW |
| Steeplechase | CO10 8EN |
| Stour Vale | CO10 8UB |
| Stradishall Road | CO10 8EU CO10 8EX |
| The Nesters | CO10 8RL |
| The Street | CO10 8HP CO10 8HR |
| Upper Green | CO10 8HL |
| Upper North Street | CO10 8EF |
| Valley Wash | CO10 8EJ |
| Windmill Rise | CO10 8EQ |
| Wixoe | CO10 8UD CO10 8UE CO10 8UF |
| CO10 8DR CO10 8DY CO10 8HJ CO10 8HU |
Transport near Hundon
-
Sudbury Station
-
Dullingham Station
-
Newmarket Station
-
Kennett Station
-
Bures Station
-
Bury St.Edmunds Station
-
Great Chesterford Station
- FAQ
- Price Paid By Year
- Property Type Price
Frequently asked questions about Hundon
What is the average price for a property for sale in Hundon?
The average price for a property for sale in Hundon is £441,229. This amount is 29% higher than the average price in Sudbury. There are 543 property listings for sale in Hundon.
What streets have the most expensive properties for sale in Hundon?
The streets with the most expensive properties for sale in Hundon are Wixoe at an average of £905,000, Brockley Green at an average of £770,000 and Boyton End at an average of £715,000.
What streets have the most affordable properties for sale in Hundon?
The streets with the most affordable properties for sale in Hundon are Lower North Street at an average of £225,000, Windmill Rise at an average of £295,416 and Clare Road at an average of £297,500.
Which train stations are available in or near Hundon?
Some of the train stations available in or near Hundon are Sudbury, Dullingham and Newmarket.
Property Price Paid in Hundon by Year
The average sold property price by year was:
| Year | Average Sold Price | Price Change |
Sold Properties
|
|---|---|---|---|
| 2025 | £412,666 | 6% |
21 Properties |
| 2024 | £389,250 | -34% |
28 Properties |
| 2023 | £523,438 | -2% |
25 Properties |
| 2022 | £532,633 | 19% |
28 Properties |
| 2021 | £432,310 | 10% |
31 Properties |
| 2020 | £388,075 | 8% |
33 Properties |
| 2019 | £358,531 | -24% |
27 Properties |
| 2018 | £445,961 | 26% |
32 Properties |
| 2017 | £331,424 | 10% |
27 Properties |
| 2016 | £299,705 | -3% |
27 Properties |
| 2015 | £308,666 | -3% |
36 Properties |
| 2014 | £318,757 | 6% |
32 Properties |
| 2013 | £299,889 | 22% |
41 Properties |
| 2012 | £235,358 | -31% |
25 Properties |
| 2011 | £309,001 | -12% |
18 Properties |
| 2010 | £346,714 | 34% |
24 Properties |
| 2009 | £229,182 | -13% |
17 Properties |
| 2008 | £259,911 | -17% |
17 Properties |
| 2007 | £303,496 | -4% |
44 Properties |
| 2006 | £316,376 | 14% |
30 Properties |
| 2005 | £272,284 | 13% |
26 Properties |
| 2004 | £235,528 | -6% |
33 Properties |
| 2003 | £248,989 | 16% |
34 Properties |
| 2002 | £208,615 | 19% |
32 Properties |
| 2001 | £168,013 | 8% |
39 Properties |
| 2000 | £155,018 | 32% |
27 Properties |
| 1999 | £105,301 | 4% |
36 Properties |
| 1998 | £100,934 | 7% |
47 Properties |
| 1997 | £93,857 | -21% |
35 Properties |
| 1996 | £113,997 | 34% |
39 Properties |
| 1995 | £75,593 | - |
24 Properties |
Property Price per Property Type in Hundon
Here you can find historic sold price data in order to help with your property search.
The average Property Paid Price for specific property types in the last three years are:
| Property Type | Average Sold Price | Sold Properties |
|---|---|---|
| Semi Detached House | £333,562.00 | 24 Semi Detached Houses |
| Detached House | £551,153.00 | 39 Detached Houses |
| Terraced House | £286,404.00 | 11 Terraced Houses |

