
Houses for sale in Chichester Central, Chichester
House Prices in Chichester Central
Properties in Chichester Central have an average house price of £652k and had 4 Property Transactions within the last 3 years¹.
Chichester Central is an area in Chichester, Surrey with 227 households², where the most expensive property was sold for £1.03M.
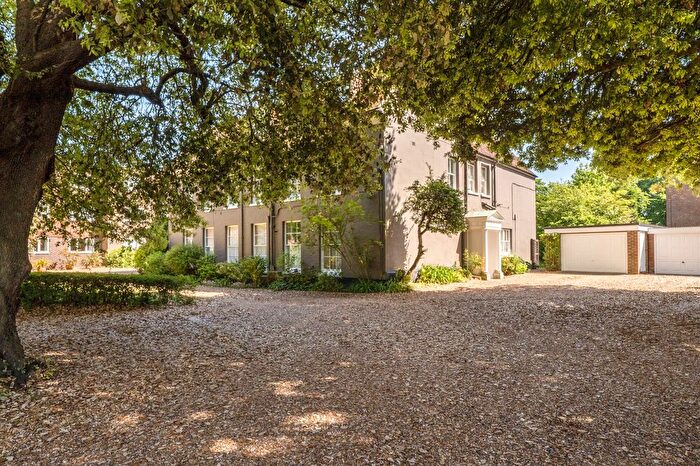
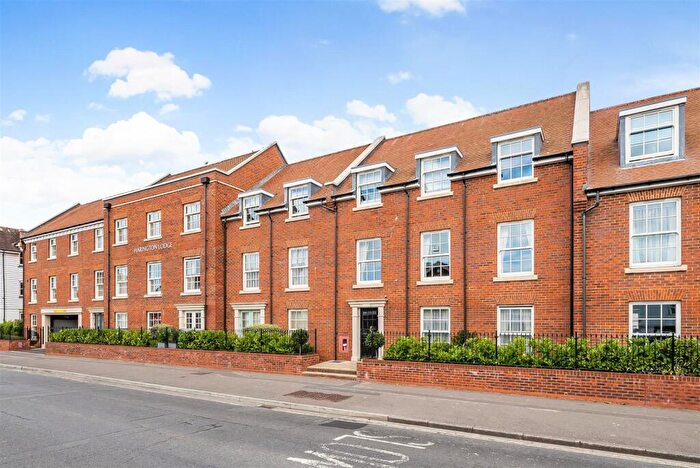
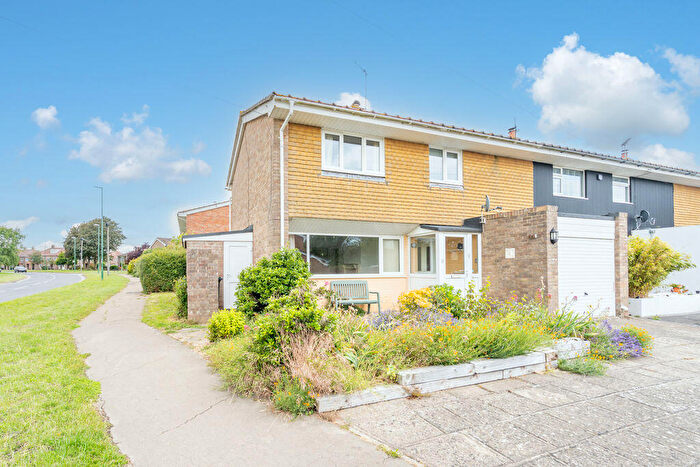
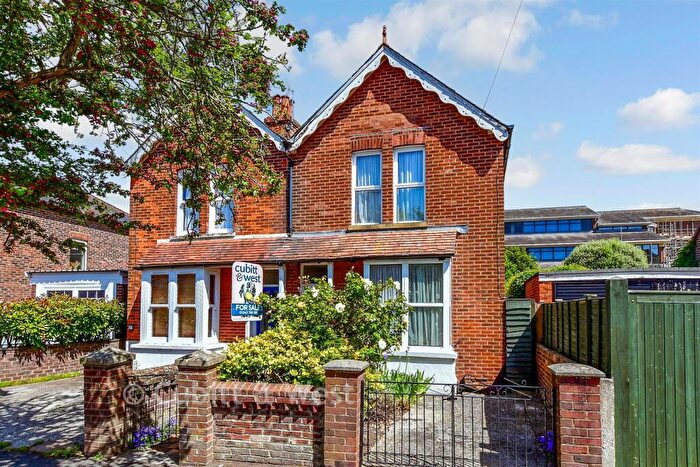
Properties for sale in Chichester Central
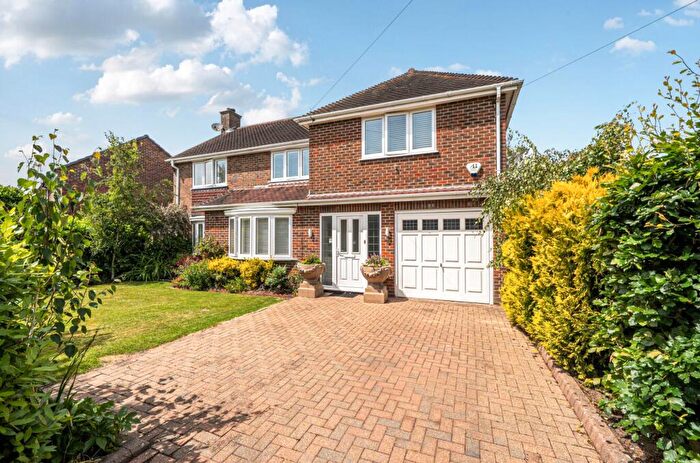


![]()
If you are looking to sell your house, let it out, or receive a property valuation, an expert can help you.
Click the button below to get started.


Roads and Postcodes in Chichester Central
Navigate through our locations to find the location of your next house in Chichester Central, Chichester for sale or to rent.
Property price trends in Chichester Central
According to the latest Land Registry data, the average home in Chichester Central sold for £679,166 in 2024. That figure comes from 56 sales logged over the past 27 years.
Prices have fallen back over the last three years. Compared with 2021, when the typical sale came in around £904,000, that's a fall of roughly 24.9%.
Looking back five years, average prices are up about 13.8% since 2018, a gain of around £82,476 in cash terms.
Zoom out to the past decade for the fuller picture. Back in 2012, homes here averaged £282,500, so the typical sold price has climbed about 140.4% since then, roughly 7.6% a year.
Frequently asked questions about Chichester Central
What is the average price for a property for sale in Chichester Central?
The average price for a property for sale in Chichester Central is £651,875. This amount is 35% higher than the average price in Chichester. There are 1,956 property listings for sale in Chichester Central.
What streets have the most expensive properties for sale in Chichester Central?
The streets with the most expensive properties for sale in Chichester Central are East Street at an average of £1,025,000 and The Woolstaplers at an average of £647,500.
What streets have the most affordable properties for sale in Chichester Central?
The street with the most affordable properties for sale in Chichester Central is Priory Row at an average of £287,500.
Which train stations are available in or near Chichester Central?
Some of the train stations available in or near Chichester Central are Chichester, Fishbourne and Bosham.
Property Price Paid in Chichester Central by Year
The average sold property price by year was:
| Year | Average Sold Price | Price Change |
Sold Properties
|
|---|---|---|---|
| 2024 | £679,166 | 16% |
3 Properties |
| 2023 | £570,000 | -72% |
1 Property |
| 2022 | £978,000 | 8% |
5 Properties |
| 2021 | £904,000 | -179% |
5 Properties |
| 2020 | £2,525,000 | 76% |
1 Property |
| 2018 | £596,690 | 17% |
21 Properties |
| 2017 | £497,500 | 53% |
10 Properties |
| 2016 | £234,247 | -21% |
1 Property |
| 2012 | £282,500 | 51% |
1 Property |
| 2004 | £138,749 | -959% |
2 Properties |
Property Price per Property Type in Chichester Central
Here you can find historic sold price data in order to help with your property search.
The average Property Paid Price for specific property types in the last three years are:
| Property Type | Average Sold Price | Sold Properties |
|---|---|---|
| Flat | £527,500.00 | 3 Flats |
| Terraced House | £1,025,000.00 | 1 Terraced House |
