
Houses for sale in Chichester South, Chichester
House Prices in Chichester South
Properties in Chichester South have an average house price of £379k and had 335 Property Transactions within the last 3 years¹.
Chichester South is an area in Chichester, Surrey with 3,340 households², where the most expensive property was sold for £1.86M.
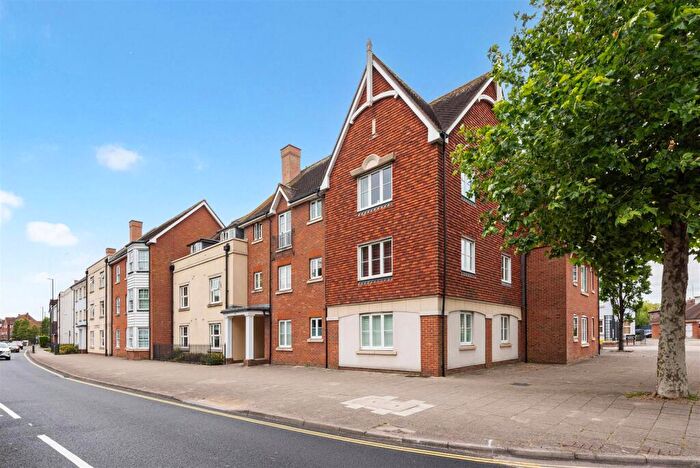
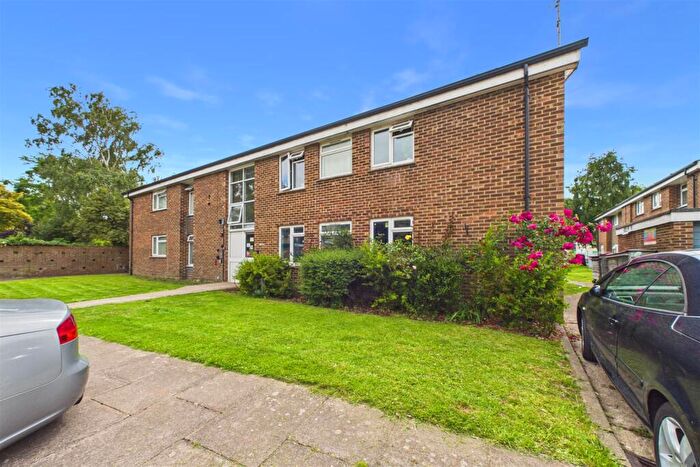
Properties for sale in Chichester South
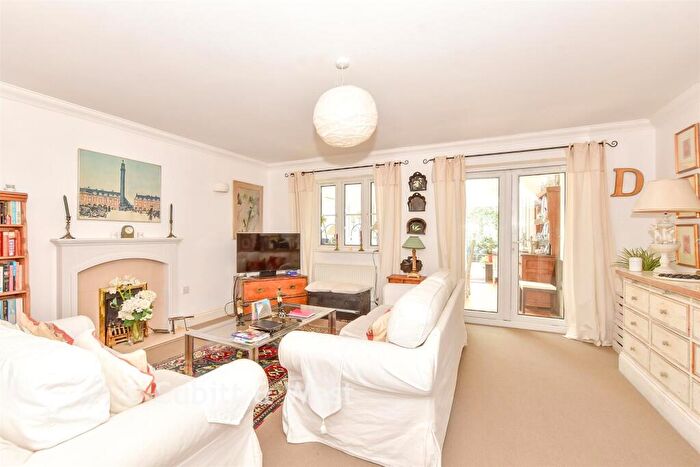

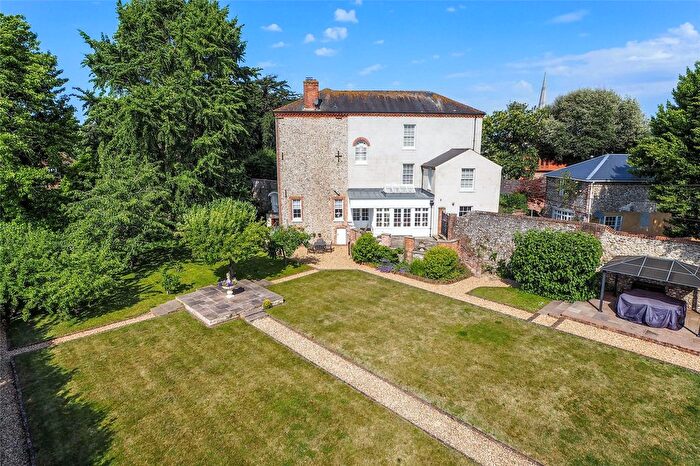
![]()
If you are looking to sell your house, let it out, or receive a property valuation, an expert can help you.
Click the button below to get started.


Roads and Postcodes in Chichester South
Navigate through our locations to find the location of your next house in Chichester South, Chichester for sale or to rent.
Property price trends in Chichester South
According to the latest Land Registry data, the average home in Chichester South sold for £278,909 in 2026. That figure comes from 4,958 sales logged over the past 31 years.
Prices have fallen back over the last three years. Compared with 2023, when the typical sale came in around £397,386, that's a fall of roughly 29.8%.
Looking back five years, average prices are down about 24.7% since 2021, a drop of around £91,653 in cash terms.
Zoom out to the past decade for the fuller picture. Back in 2016, homes here averaged £329,884, so the typical sold price has fallen about 15.5% since then, around 1.7% a year lower. Stretch the view to fifteen years and that annual pace edges up closer to 0.2%.
Frequently asked questions about Chichester South
What is the average price for a property for sale in Chichester South?
The average price for a property for sale in Chichester South is £379,398. This amount is 21% lower than the average price in Chichester. There are 1,998 property listings for sale in Chichester South.
What streets have the most expensive properties for sale in Chichester South?
The streets with the most expensive properties for sale in Chichester South are North Pallant at an average of £1,237,500, Laburnum Grove at an average of £1,100,000 and St Johns Street at an average of £906,916.
What streets have the most affordable properties for sale in Chichester South?
The streets with the most affordable properties for sale in Chichester South are Phoenix Close at an average of £130,000, Chequers Place at an average of £165,000 and Southgate at an average of £170,000.
Which train stations are available in or near Chichester South?
Some of the train stations available in or near Chichester South are Chichester, Fishbourne and Bosham.
Property Price Paid in Chichester South by Year
The average sold property price by year was:
| Year | Average Sold Price | Price Change |
Sold Properties
|
|---|---|---|---|
| 2026 | £278,909 | -44% |
11 Properties |
| 2025 | £401,948 | 12% |
95 Properties |
| 2024 | £354,772 | -12% |
121 Properties |
| 2023 | £397,386 | 1% |
108 Properties |
| 2022 | £392,881 | 6% |
148 Properties |
| 2021 | £370,562 | 10% |
163 Properties |
| 2020 | £334,460 | -3% |
120 Properties |
| 2019 | £345,952 | 2% |
133 Properties |
| 2018 | £340,263 | -17% |
146 Properties |
| 2017 | £398,910 | 17% |
141 Properties |
Property Price per Property Type in Chichester South
Here you can find historic sold price data in order to help with your property search.
The average Property Paid Price for specific property types in the last three years are:
| Property Type | Average Sold Price | Sold Properties |
|---|---|---|
| Flat | £247,817.00 | 117 Flats |
| Semi Detached House | £410,548.00 | 66 Semi Detached Houses |
| Detached House | £655,727.00 | 33 Detached Houses |
| Terraced House | £414,860.00 | 119 Terraced Houses |
