
Houses for sale in Funtington, Chichester
House Prices in Funtington
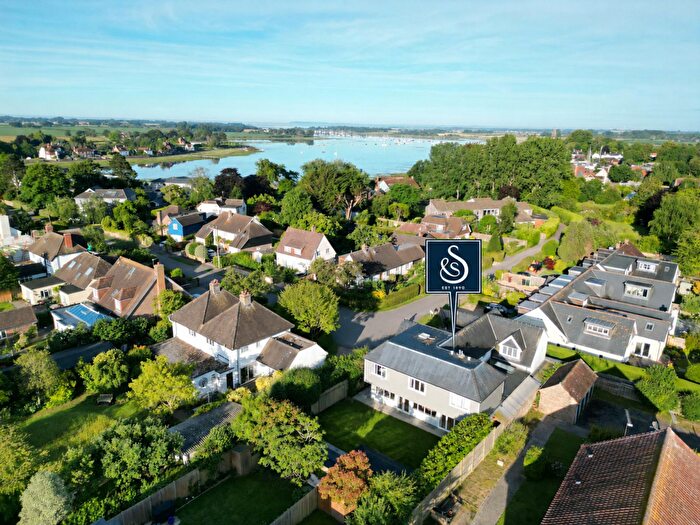
Properties in Funtington have an average house price of £849k and had 63 Property Transactions within the last 3 years¹.
Funtington is an area in Chichester, Surrey with 852 households², where the most expensive property was sold for £2.35M.
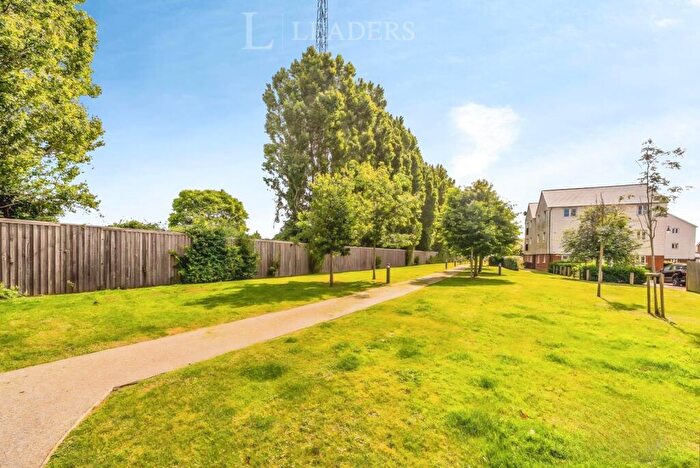
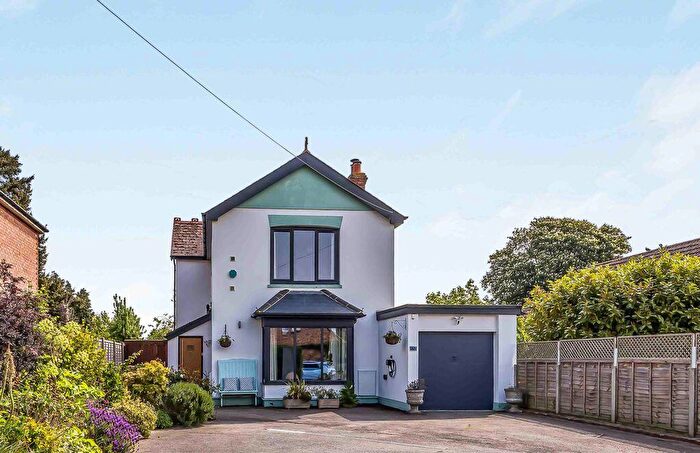
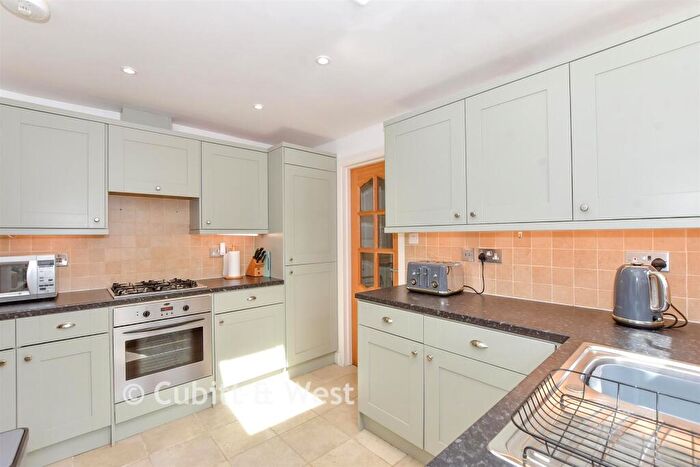
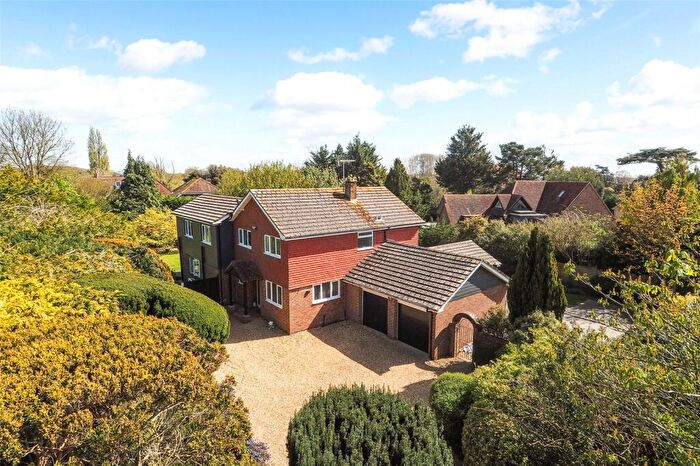
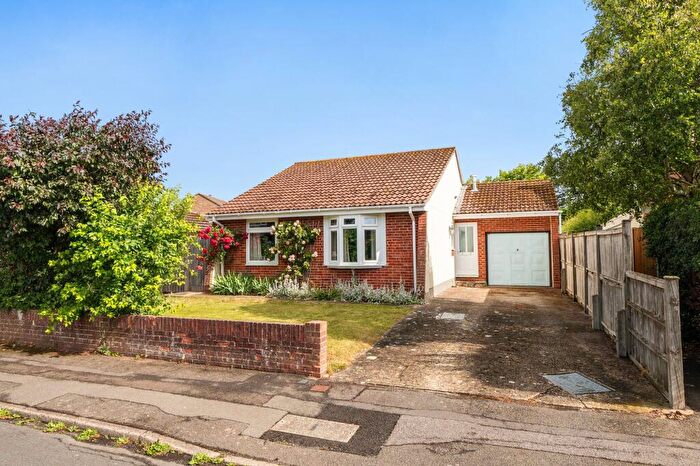
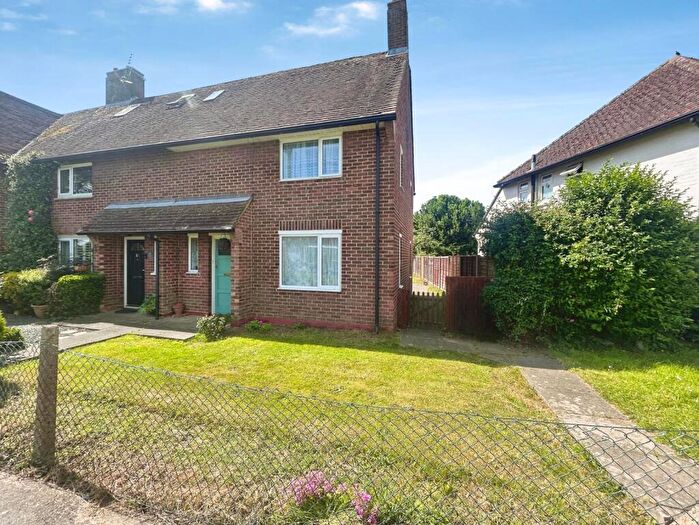
Properties for sale in Funtington
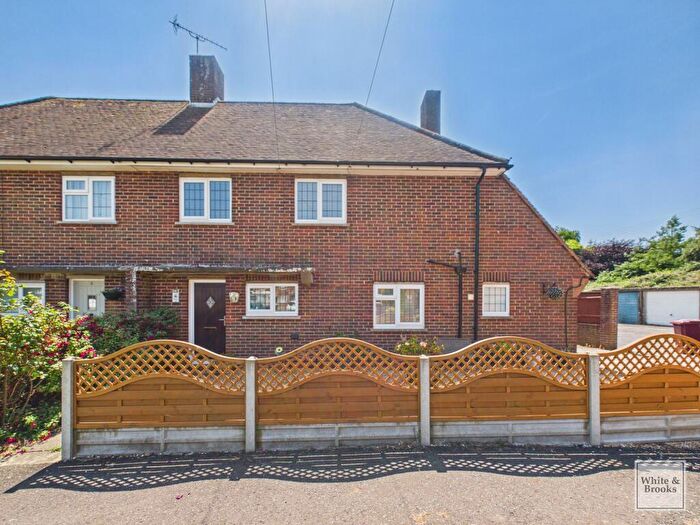
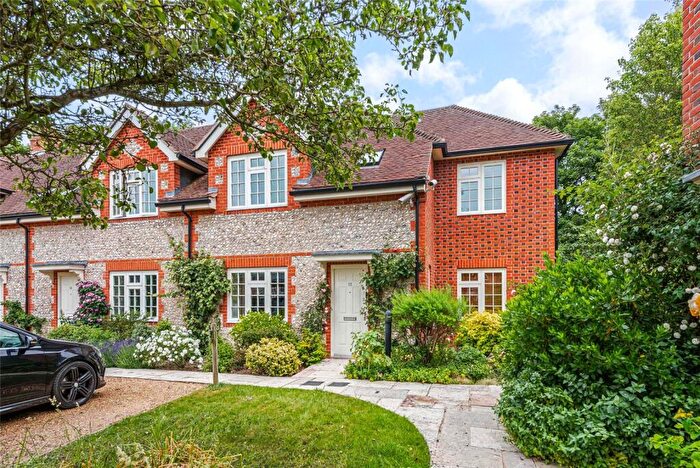
![]()
If you are looking to sell your house, let it out, or receive a property valuation, an expert can help you.
Click the button below to get started.
Roads and Postcodes in Funtington
Navigate through our locations to find the location of your next house in Funtington, Chichester for sale or to rent.
| Streets | Postcodes |
|---|---|
| Admirals Walk | PO18 9LB |
| Broadsole Cottages | PO18 9AR |
| Brooklands Cottages | PO18 9EE |
| Chapel Lane | PO18 9AW |
| Cheesemans Lane | PO18 8UE |
| Chilgrove | PO18 9NH |
| Church Lane | PO18 9LH PO18 9LQ |
| Clay Lane | PO18 8AB PO18 8DJ |
| Common Road | PO18 9LL |
| Compton Road | PO18 9QA |
| Cooks Lane | PO18 9EF |
| Down Street | PO18 8DP PO18 8DS |
| Downs Road | PO18 9BH PO18 9BL PO18 9BN PO18 9BP PO18 9BQ PO18 9LS |
| Dukes Meadow | PO18 9LU |
| Five Acres Close | PO18 9LX |
| Forestry Cottages | PO18 9JN |
| Funtington Hall Cottages | PO18 9LJ |
| Funtington Road | PO18 9AP |
| Greenfield Lane | PO18 8FB |
| Haresfoot Close | PO18 9LP |
| Heather Close | PO18 8DR |
| Laxton Meadow | PO18 9LD |
| Lordington Court | PO18 9DB |
| Lye Common | PO18 9EH |
| Lye Lane | PO18 9BD PO18 9BG |
| Lynch Down | PO18 9LR |
| Main Road | PO18 9AU |
| Malthouse Lane | PO18 8DZ |
| Milberry Lane | PO18 9JJ |
| Mill Road | PO18 8DA PO18 8DG PO18 8DT PO18 8DU PO18 8EA |
| Mitchmere Cottages | PO18 9JW |
| Newbarn Lane | PO18 9DU |
| Newells Lane | PO18 8DD |
| Nore Down Way | PO18 9EP |
| Pond Cottages | PO18 9EW PO18 9HE |
| Ratham Lane | PO18 8DL |
| Salthill Park | PO19 3PS |
| Salthill Road | PO19 3PY |
| Sandy Lane | PO18 9AT |
| School Dell | PO18 8EB |
| School Lane | PO18 9EZ |
| Southbrook Road | PO18 8DH PO18 8DN PO18 8DQ |
| Stoke Road | PO18 9BX |
| The Bridle Lane | PO18 8UG |
| The Gardens | PO18 8DX |
| The Square | PO18 9HA |
| Watery Lane | PO18 9LE PO18 9LF |
| West Ashling Road | PO18 8UD PO18 8UF |
| Weston Lane | PO18 9LT |
| Wildham Lane | PO18 9JF |
| PO18 8DY PO18 9AL PO18 9AS PO18 9AX PO18 9DH PO18 9DL PO18 9DN PO18 9DR PO18 9DT PO18 9DZ PO18 9EA PO18 9ED PO18 9EJ PO18 9EN PO18 9EQ PO18 9ES PO18 9EU PO18 9EX PO18 9HD PO18 9HF PO18 9JB PO18 9JE PO18 9JQ PO18 9JT PO18 9LA PO18 9LG PO18 9LN PO18 9LW |
Property price trends in Funtington
According to the latest Land Registry data, the average home in Funtington sold for £390,000 in 2026. That figure comes from 906 sales logged over the past 31 years.
Prices have fallen back over the last three years. Compared with 2023, when the typical sale came in around £799,093, that's a fall of roughly 51.2%.
Looking back five years, average prices are down about 52.7% since 2021, a drop of around £435,125 in cash terms.
Zoom out to the past decade for the fuller picture. Back in 2016, homes here averaged £597,709, so the typical sold price has fallen about 34.8% since then, around 4.2% a year lower. Stretch the view to fifteen years and that annual pace holds at about -4.3%.
Frequently asked questions about Funtington
What is the average price for a property for sale in Funtington?
The average price for a property for sale in Funtington is £849,093. This amount is 76% higher than the average price in Chichester. There are 2,533 property listings for sale in Funtington.
What streets have the most expensive properties for sale in Funtington?
The streets with the most expensive properties for sale in Funtington are Milberry Lane at an average of £1,594,000, Downs Road at an average of £1,331,833 and Cooks Lane at an average of £1,252,500.
What streets have the most affordable properties for sale in Funtington?
The streets with the most affordable properties for sale in Funtington are Heather Close at an average of £335,500, Broadsole Cottages at an average of £394,000 and School Lane at an average of £550,000.
Which train stations are available in or near Funtington?
Some of the train stations available in or near Funtington are Nutbourne, Bosham and Southbourne.
Property Price Paid in Funtington by Year
The average sold property price by year was:
| Year | Average Sold Price | Price Change |
Sold Properties
|
|---|---|---|---|
| 2026 | £390,000 | -98% |
1 Property |
| 2025 | £772,456 | -37% |
23 Properties |
| 2024 | £1,059,828 | 25% |
16 Properties |
| 2023 | £799,093 | -36% |
23 Properties |
| 2022 | £1,088,588 | 24% |
25 Properties |
| 2021 | £825,125 | 19% |
50 Properties |
| 2020 | £671,266 | -5% |
28 Properties |
| 2019 | £702,170 | -3% |
17 Properties |
| 2018 | £722,503 | 11% |
31 Properties |
| 2017 | £642,851 | 7% |
27 Properties |
Property Price per Property Type in Funtington
Here you can find historic sold price data in order to help with your property search.
The average Property Paid Price for specific property types in the last three years are:
| Property Type | Average Sold Price | Sold Properties |
|---|---|---|
| Semi Detached House | £598,041.00 | 12 Semi Detached Houses |
| Detached House | £1,053,740.00 | 35 Detached Houses |
| Terraced House | £627,500.00 | 13 Terraced Houses |
| Flat | £426,000.00 | 3 Flats |
