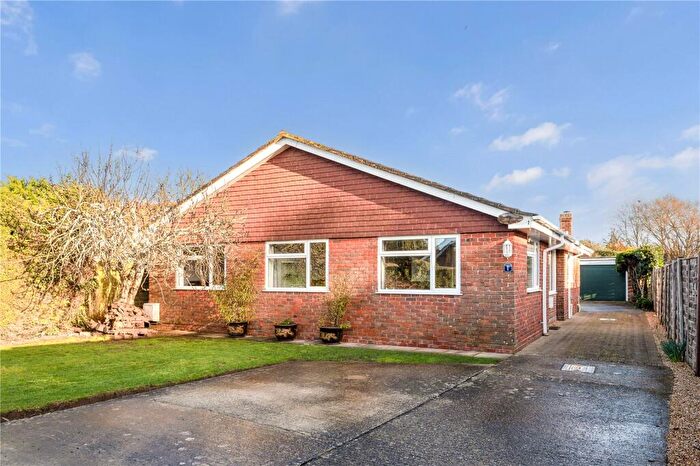
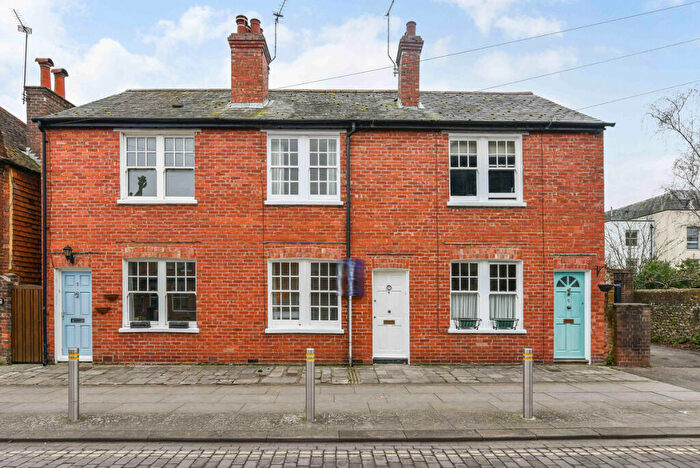
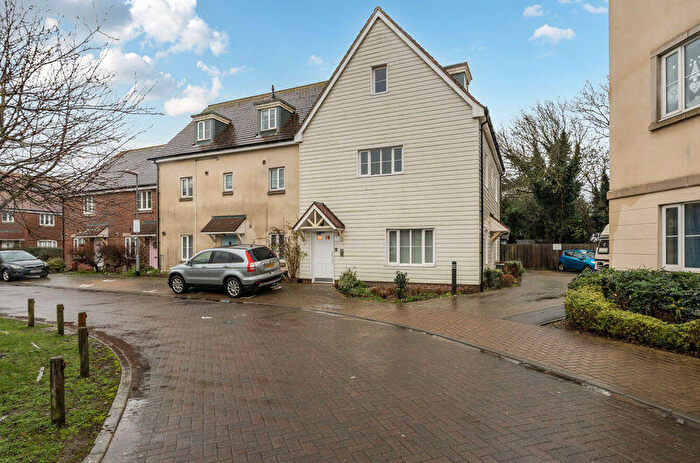
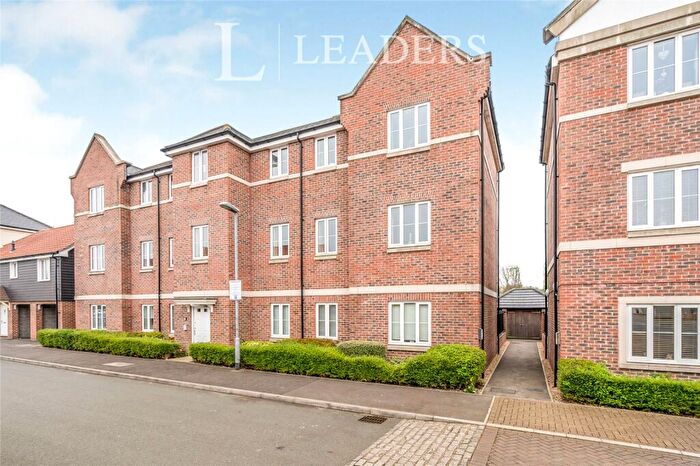
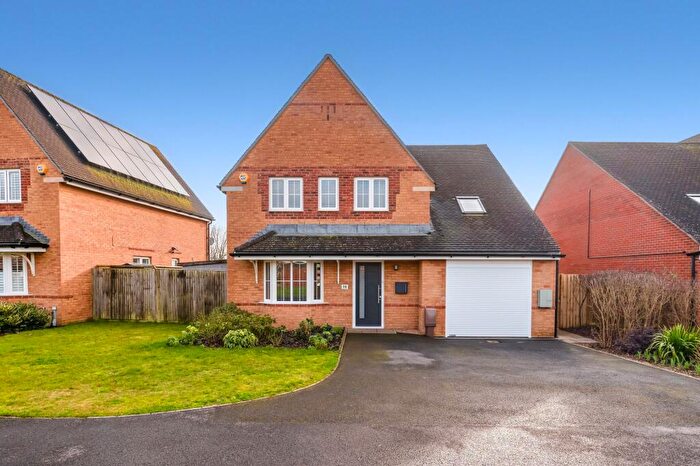
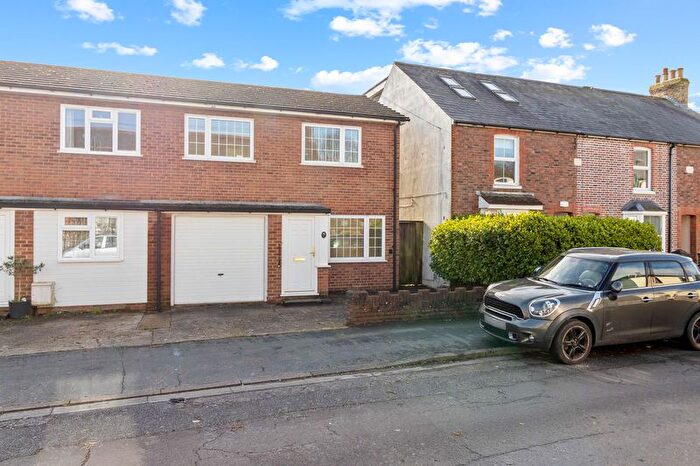
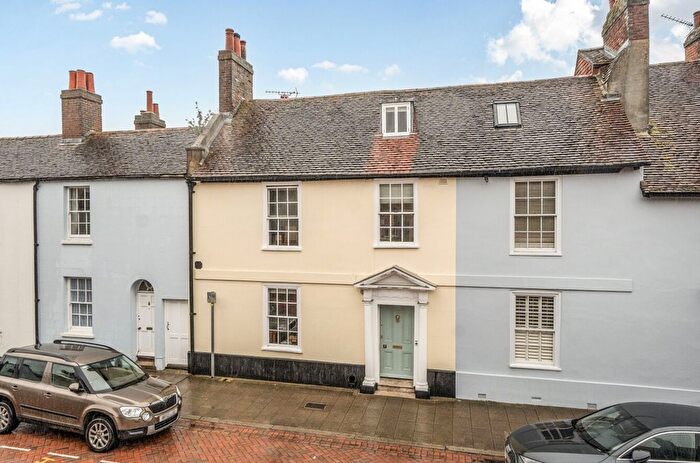
Houses for sale & to rent in Sidlesham, Chichester
House Prices in Sidlesham
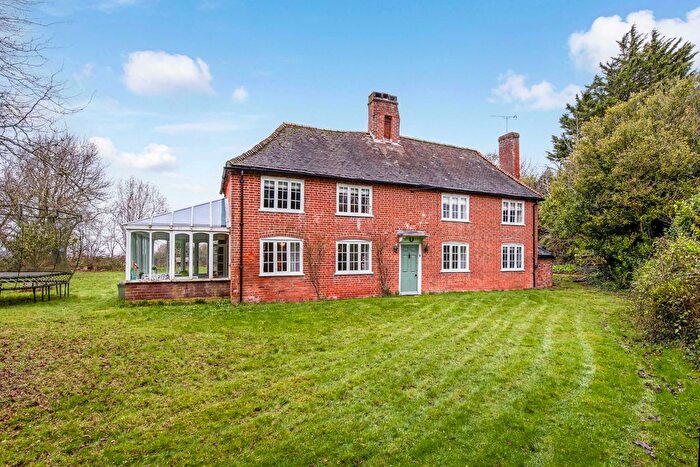
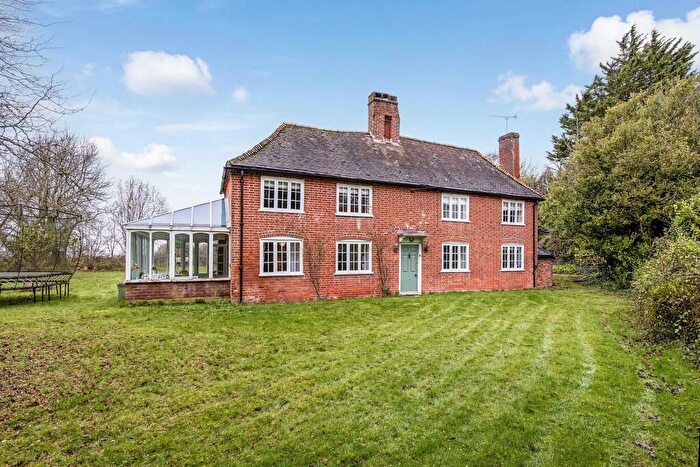
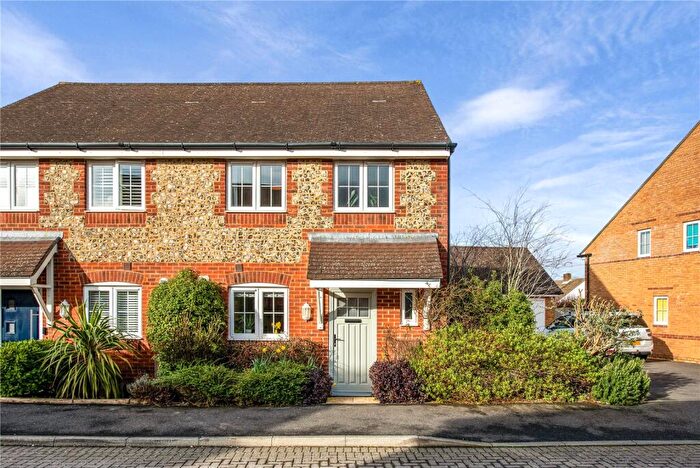
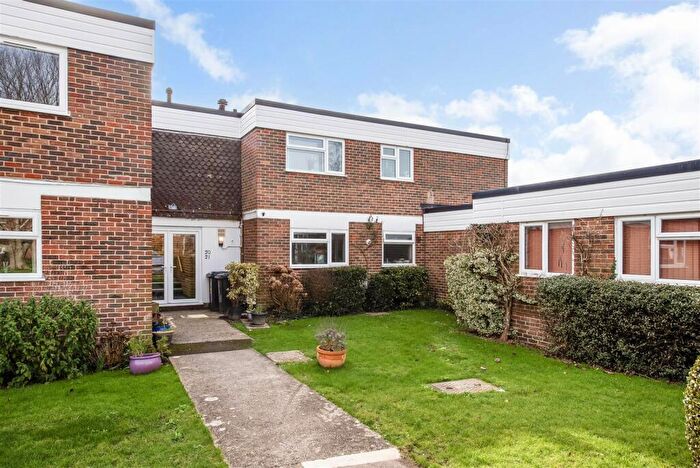
Properties in Sidlesham have an average house price of £485,816.00 and had 71 Property Transactions within the last 3 years¹.
Sidlesham is an area in Chichester, Surrey with 933 households², where the most expensive property was sold for £1,000,000.00.
Properties for sale in Sidlesham
Roads and Postcodes in Sidlesham
Navigate through our locations to find the location of your next house in Sidlesham, Chichester for sale or to rent.
| Streets | Postcodes |
|---|---|
| Blackman Way | PO20 1NZ |
| Boxham Lane | PO20 7QF |
| Bremere Lane | PO20 7BN |
| Brimfast Lane | PO20 7PZ |
| Chalder Lane | PO20 7RJ PO20 7RN |
| Chalk Lane | PO20 7LW |
| Chichester Road | PO20 7PY |
| Church Farm Lane | PO20 7RE |
| Church Lane | PO20 1AJ PO20 7RH |
| Cow Lane | PO20 7LN |
| Easton Lane | PO20 7NU |
| Fairthorn Cottages | PO20 1NT |
| Fletchers Lane | PO20 7QG |
| Foxbridge Drive | PO20 1NQ |
| Green Lane | PO20 7NP |
| Ham Road | PO20 7NS PO20 7NX PO20 7NY |
| Heath Close | PO20 1PL |
| High Trees | PO20 1PG |
| Highleigh Road | PO20 7NN PO20 7NR PO20 7NW PO20 7QP |
| Hunston Road | PO20 1NP |
| Jestico's Close | PO20 1AF |
| Jury Lane | PO20 7PX |
| Keynor Lane | PO20 7NG PO20 7NL |
| Little Boultons | PO20 1AP |
| Lockgate Road | PO20 7QE PO20 7QH PO20 7QQ |
| Manhood Lane | PO20 7LT |
| May Close | PO20 7RR |
| Mayfield Place | PO20 1NS |
| Meadow Close | PO20 1PB |
| Mill Lane | PO20 7LU PO20 7LX PO20 7LZ PO20 7NA PO20 7NB |
| Nansen Cottages | PO20 1NU |
| New Cottages | PO20 1NX |
| Orchard Side | PO20 1PQ |
| Rookery Lane | PO20 7ND |
| Rotten Row | PO20 7QS |
| Selsey Road | PO20 1AS PO20 1AU PO20 1AW PO20 7LR PO20 7LS PO20 7NE PO20 7NF PO20 7QU PO20 7QX PO20 7QZ PO20 7RD |
| Sidlesham Common | PO20 7QA |
| Southover Way | PO20 1NY |
| St Leodegars Way | PO20 1PE PO20 1PF |
| Street End Lane | PO20 7RG |
| Street End Road | PO20 7QD |
| The Chestnuts | PO20 1AN |
| The Row | PO20 7LY |
| Tramway Close | PO20 1BD |
| Uphill Way | PO20 1PH PO20 1QF |
| Westlands Road | PO20 1PJ |
| Wilfs Copse | PO20 1AH |
| PO20 1AX PO20 1NR PO20 1PD |
Transport near Sidlesham
- FAQ
- Price Paid By Year
- Property Type Price
Frequently asked questions about Sidlesham
What is the average price for a property for sale in Sidlesham?
The average price for a property for sale in Sidlesham is £485,816. This amount is 0.16% higher than the average price in Chichester. There are 6,051 property listings for sale in Sidlesham.
What streets have the most expensive properties for sale in Sidlesham?
The streets with the most expensive properties for sale in Sidlesham are Bremere Lane at an average of £1,000,000, Highleigh Road at an average of £884,375 and Rotten Row at an average of £862,500.
What streets have the most affordable properties for sale in Sidlesham?
The streets with the most affordable properties for sale in Sidlesham are Uphill Way at an average of £237,333, Orchard Side at an average of £320,000 and May Close at an average of £323,500.
Which train stations are available in or near Sidlesham?
Some of the train stations available in or near Sidlesham are Chichester, Fishbourne and Bosham.
Property Price Paid in Sidlesham by Year
The average sold property price by year was:
| Year | Average Sold Price | Price Change |
Sold Properties
|
|---|---|---|---|
| 2025 | £536,452 | -4% |
21 Properties |
| 2024 | £556,560 | 33% |
25 Properties |
| 2023 | £372,540 | -59% |
25 Properties |
| 2022 | £593,145 | 14% |
23 Properties |
| 2021 | £510,996 | 1% |
43 Properties |
| 2020 | £505,659 | 27% |
37 Properties |
| 2019 | £370,204 | -12% |
24 Properties |
| 2018 | £414,889 | -16% |
33 Properties |
| 2017 | £481,304 | 22% |
23 Properties |
| 2016 | £373,724 | 1% |
31 Properties |
| 2015 | £368,372 | -2% |
44 Properties |
| 2014 | £373,975 | 12% |
35 Properties |
| 2013 | £329,013 | -20% |
29 Properties |
| 2012 | £393,185 | 19% |
32 Properties |
| 2011 | £316,842 | -37% |
32 Properties |
| 2010 | £435,587 | 38% |
30 Properties |
| 2009 | £268,333 | 6% |
21 Properties |
| 2008 | £253,087 | -19% |
31 Properties |
| 2007 | £302,106 | 4% |
43 Properties |
| 2006 | £289,782 | -10% |
44 Properties |
| 2005 | £317,463 | -15% |
29 Properties |
| 2004 | £364,133 | 27% |
55 Properties |
| 2003 | £264,470 | 21% |
44 Properties |
| 2002 | £209,665 | -10% |
41 Properties |
| 2001 | £230,758 | 21% |
68 Properties |
| 2000 | £182,337 | 29% |
44 Properties |
| 1999 | £129,633 | -19% |
35 Properties |
| 1998 | £154,448 | 33% |
38 Properties |
| 1997 | £104,123 | -29% |
33 Properties |
| 1996 | £133,806 | 25% |
29 Properties |
| 1995 | £99,869 | - |
21 Properties |
Property Price per Property Type in Sidlesham
Here you can find historic sold price data in order to help with your property search.
The average Property Paid Price for specific property types in the last three years are:
| Property Type | Average Sold Price | Sold Properties |
|---|---|---|
| Semi Detached House | £408,944.00 | 18 Semi Detached Houses |
| Detached House | £635,683.00 | 30 Detached Houses |
| Terraced House | £369,975.00 | 20 Terraced Houses |
| Flat | £220,666.00 | 3 Flats |

