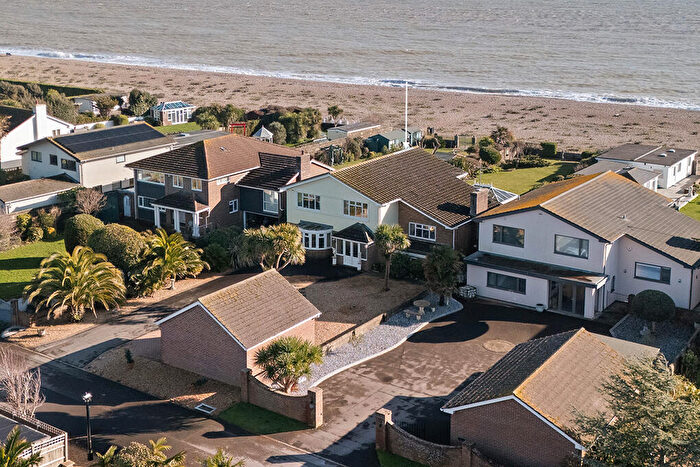
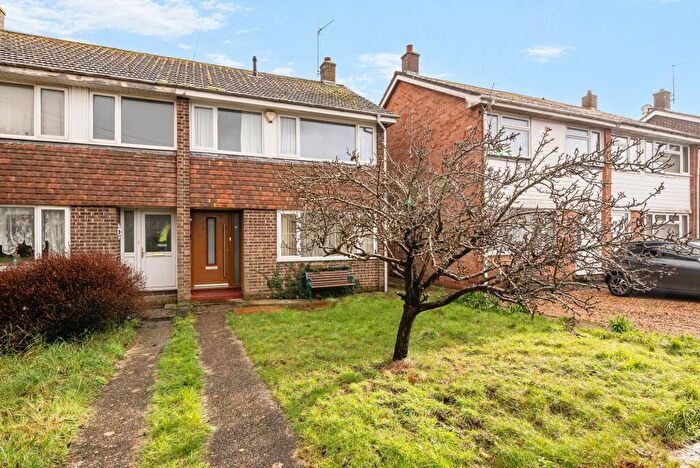
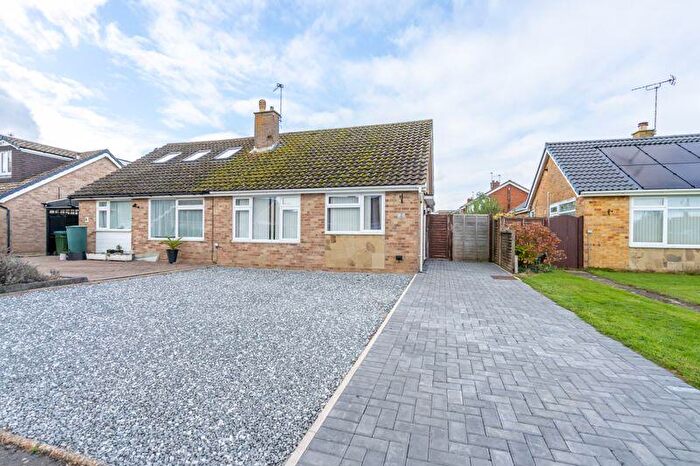
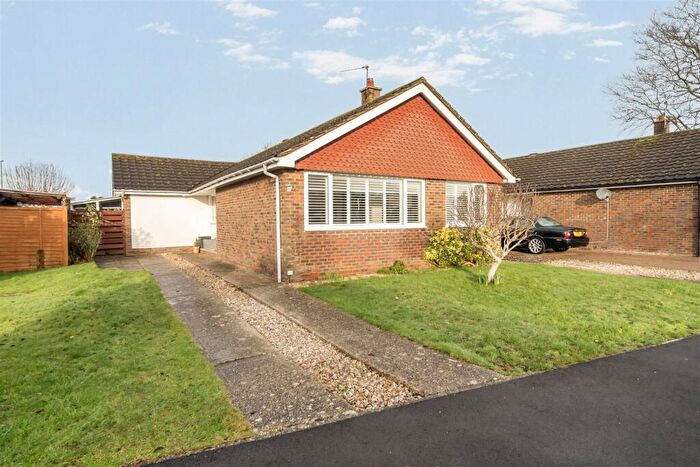
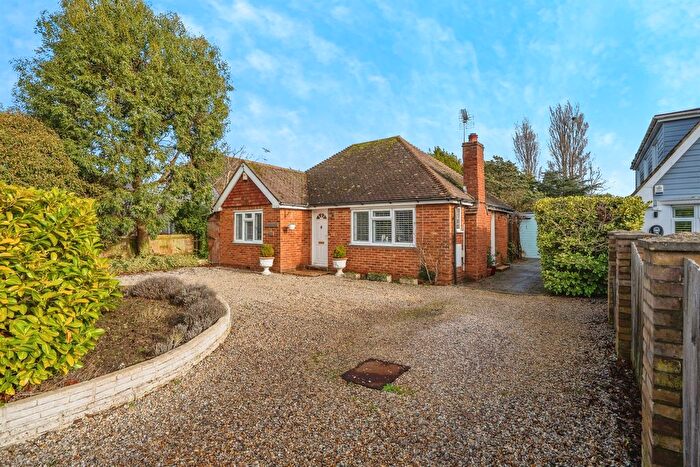
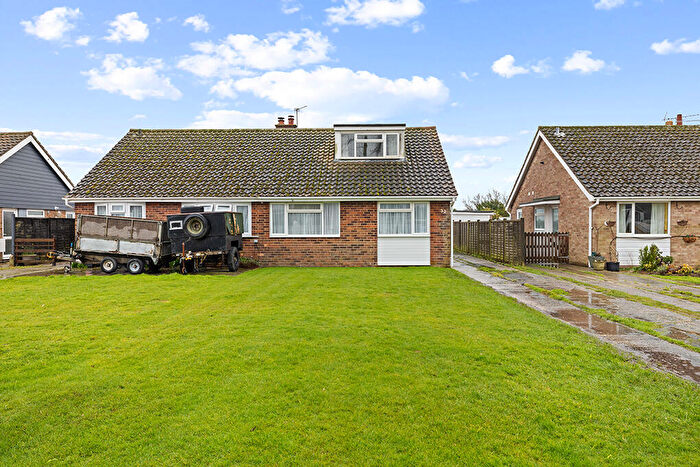
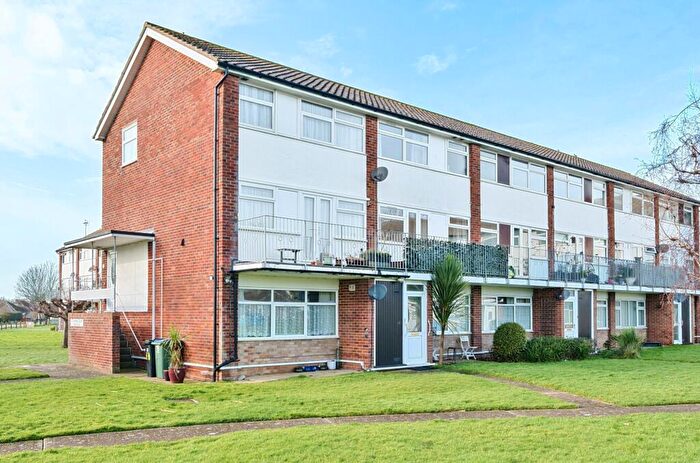
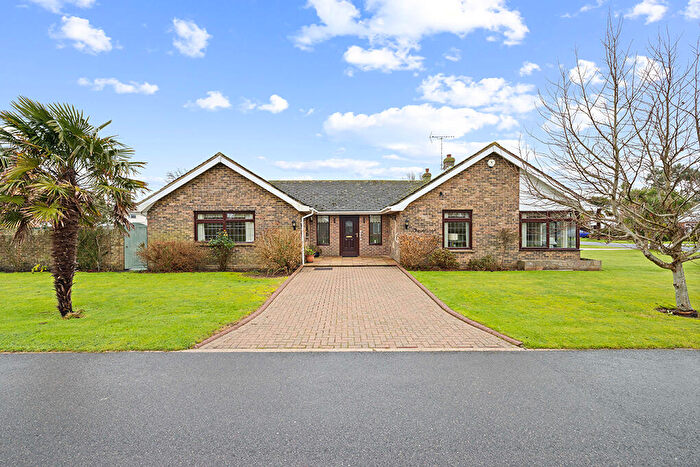
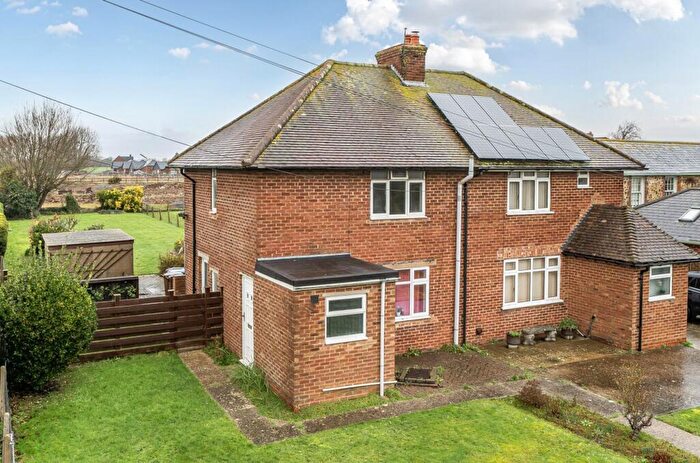
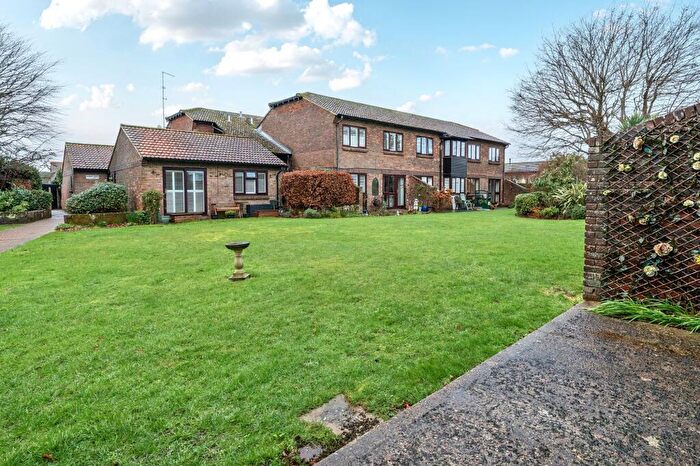
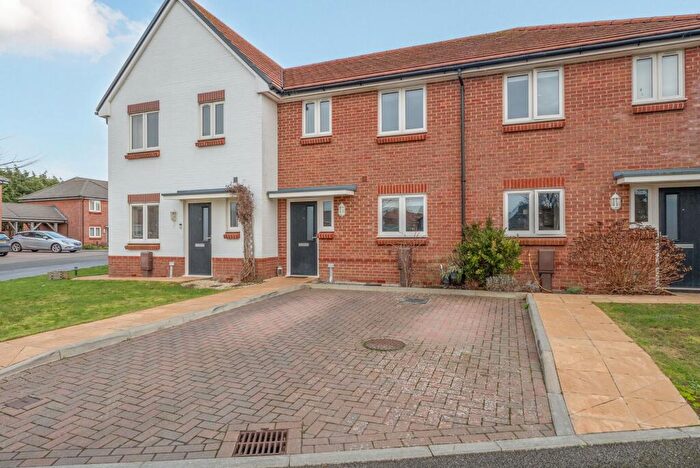
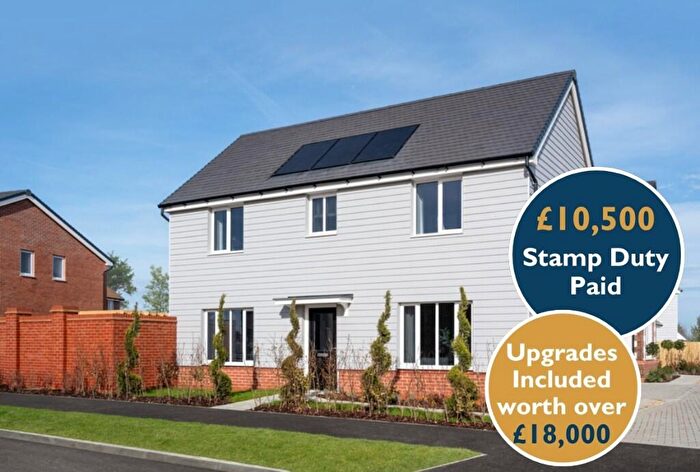
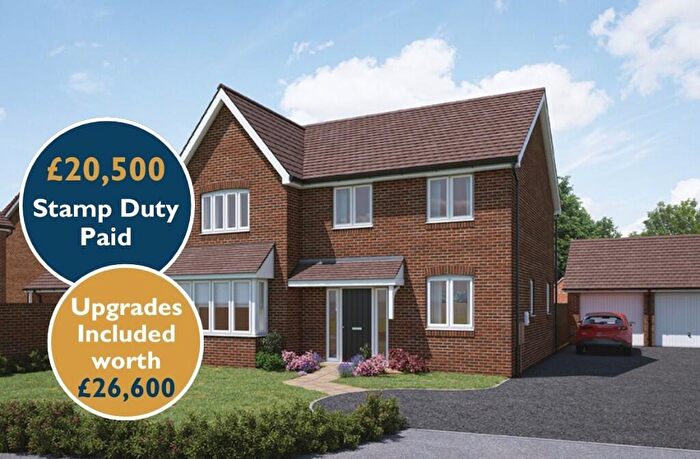
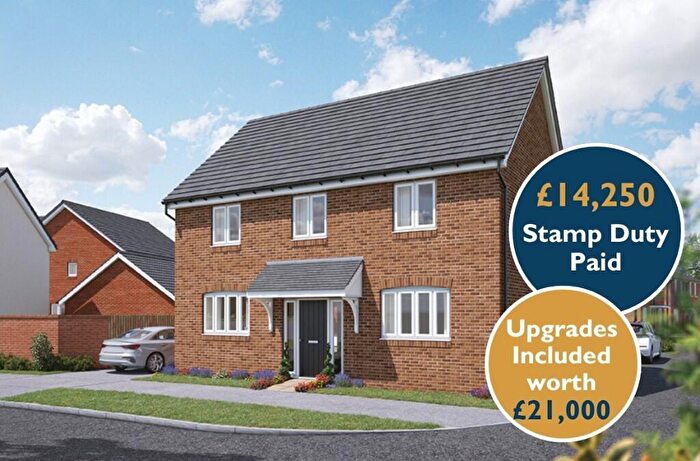
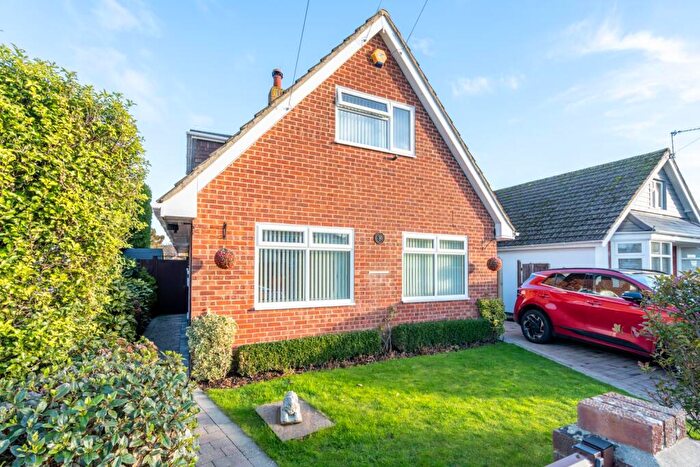
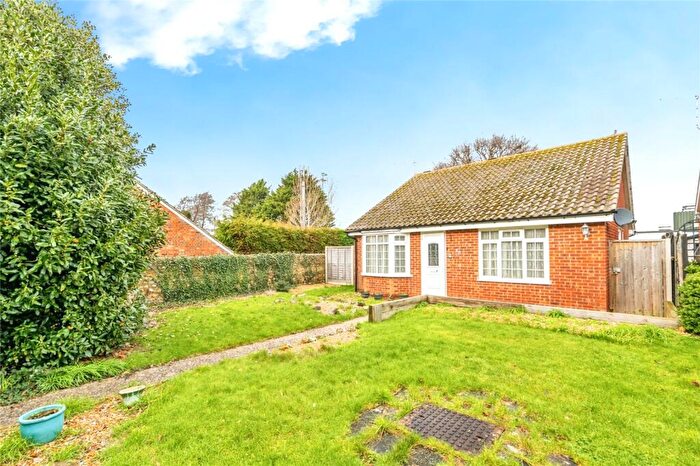
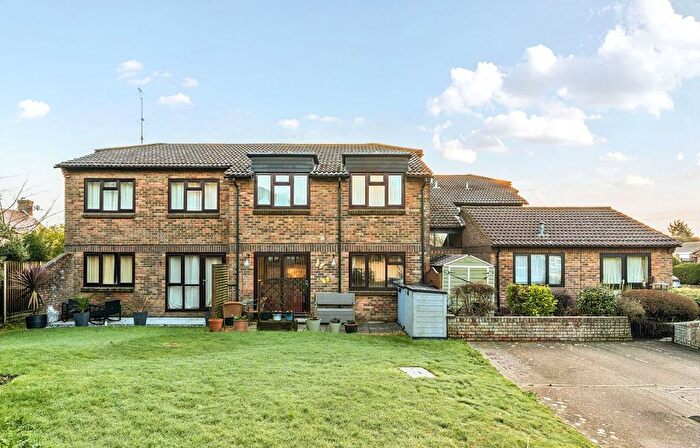
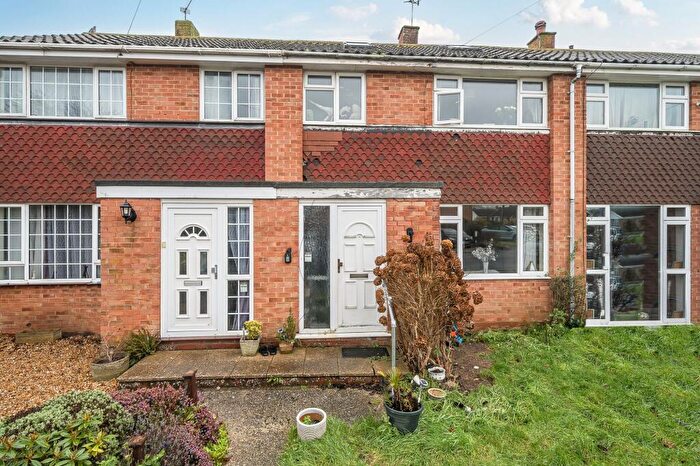
Houses for sale & to rent in Pagham, Bognor Regis
House Prices in Pagham
Properties in Pagham have an average house price of £402,187.00 and had 8 Property Transactions within the last 3 years¹.
Pagham is an area in Bognor Regis, West Sussex with 268 households², where the most expensive property was sold for £525,000.00.
Properties for sale in Pagham
Roads and Postcodes in Pagham
Navigate through our locations to find the location of your next house in Pagham, Bognor Regis for sale or to rent.
| Streets | Postcodes |
|---|---|
| Barley Close | PO21 3UQ |
| Barton Close | PO21 4FH |
| Beach Road | PO21 4SX |
| Beech Close | PO21 3FA |
| Bramble Close | PO21 3FB |
| Briar Close | PO21 3FD |
| Church Lane | PO21 4NR |
| Conifer Way | PO21 3NQ |
| East Front Road | PO21 4SL |
| Farmer Close | PO21 4FB |
| Honeysuckle Drive | PO21 3PT |
| Jennings Close | PO21 4FE |
| Lagoon Road | PO21 4TH |
| Laurel Drive | PO21 3ND |
| Millfarm Drive | PO21 3NG PO21 3UE |
| Millview Close | PO21 3UF |
| Oaktree Close | PO21 3PN PO21 3PW |
| Old Barn Close | PO21 3UG |
| Pagham Road | PO21 3PZ |
| Platinum Gardens | PO21 3GB |
| Radmall Close | PO21 4BF |
| Rose Green Road | PO21 3EG |
| Spinnaker View | PO21 3FL |
| The Causeway | PO21 4PD |
| The Parade | PO21 4TL |
| Water Meadows Way | PO21 4FD |
| Woodfield Close | PO21 4AQ |
Transport near Pagham
-
Bognor Regis Station
-
Chichester Station
-
Fishbourne Station
-
Barnham Station
-
Bosham Station
-
Ford Station
-
Nutbourne Station
-
Littlehampton Station
-
Southbourne Station
-
Arundel Station
- FAQ
- Price Paid By Year
- Property Type Price
Frequently asked questions about Pagham
What is the average price for a property for sale in Pagham?
The average price for a property for sale in Pagham is £402,187. This amount is 16% higher than the average price in Bognor Regis. There are 991 property listings for sale in Pagham.
What streets have the most expensive properties for sale in Pagham?
The street with the most expensive properties for sale in Pagham is Spinnaker View at an average of £410,357.
What streets have the most affordable properties for sale in Pagham?
The street with the most affordable properties for sale in Pagham is Woodfield Close at an average of £345,000.
Which train stations are available in or near Pagham?
Some of the train stations available in or near Pagham are Bognor Regis, Chichester and Fishbourne.
Property Price Paid in Pagham by Year
The average sold property price by year was:
| Year | Average Sold Price | Price Change |
Sold Properties
|
|---|---|---|---|
| 2025 | £417,500 | 17% |
2 Properties |
| 2024 | £345,833 | -30% |
3 Properties |
| 2023 | £448,333 | 40% |
3 Properties |
| 2022 | £267,197 | -14% |
4 Properties |
| 2021 | £304,961 | -3% |
4 Properties |
| 2020 | £315,000 | 2% |
2 Properties |
| 2019 | £309,885 | -20% |
27 Properties |
| 2018 | £370,750 | - |
2 Properties |
Property Price per Property Type in Pagham
Here you can find historic sold price data in order to help with your property search.
The average Property Paid Price for specific property types in the last three years are:
| Property Type | Average Sold Price | Sold Properties |
|---|---|---|
| Terraced House | £339,375.00 | 4 Terraced Houses |
| Semi Detached House | £345,000.00 | 1 Semi Detached House |
| Detached House | £505,000.00 | 3 Detached Houses |

