
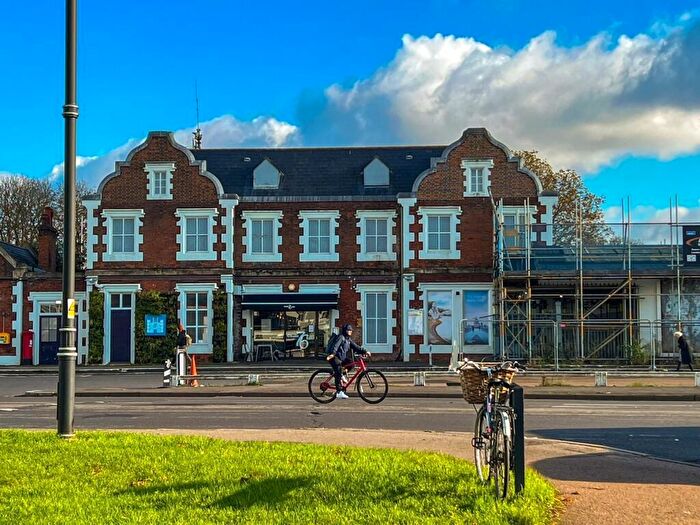
Houses for sale & to rent in Molesey East, East Molesey
House Prices in Molesey East
Properties in Molesey East have an average house price of £929k and had 276 Property Transactions within the last 3 years¹.
Molesey East is an area in East Molesey, Surrey with 2,628 households², where the most expensive property was sold for £4.2M.
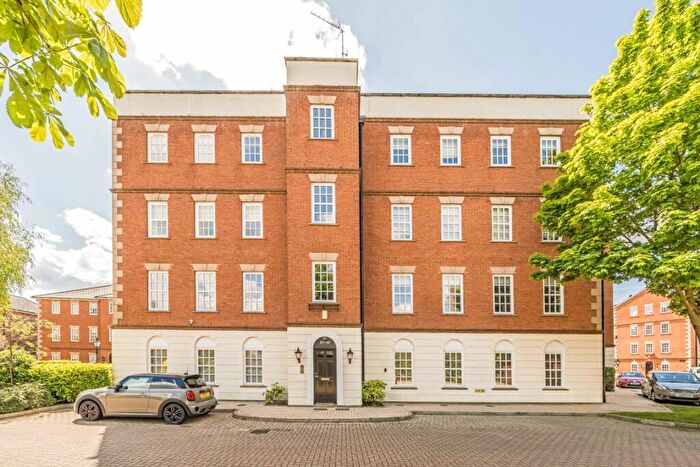
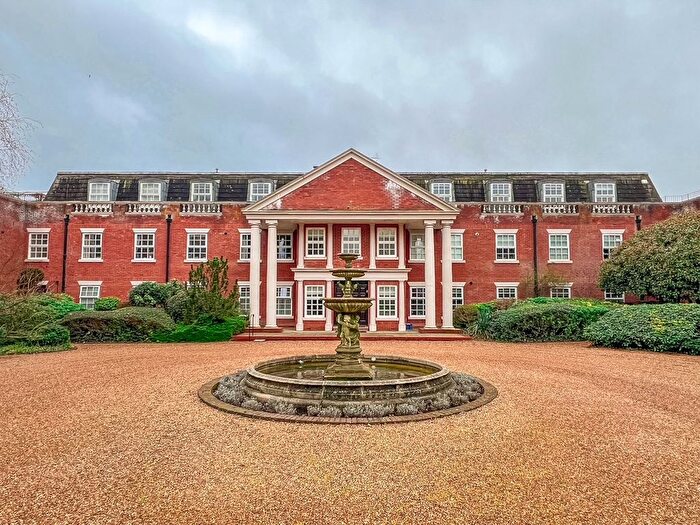
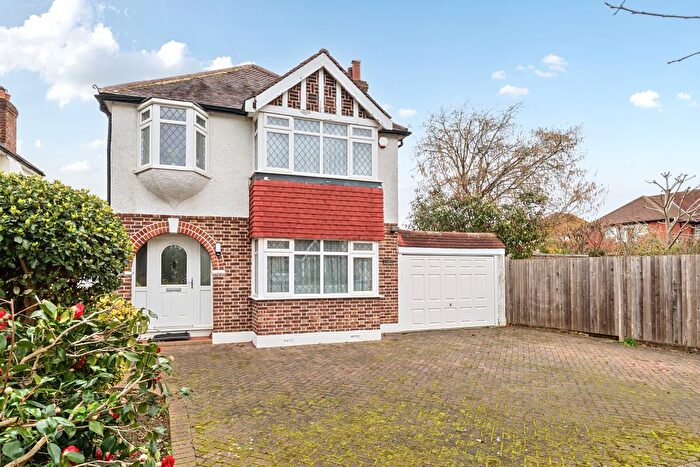
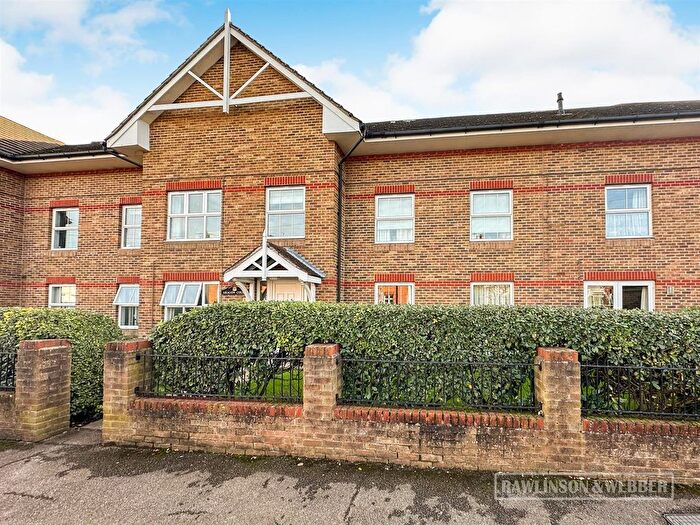
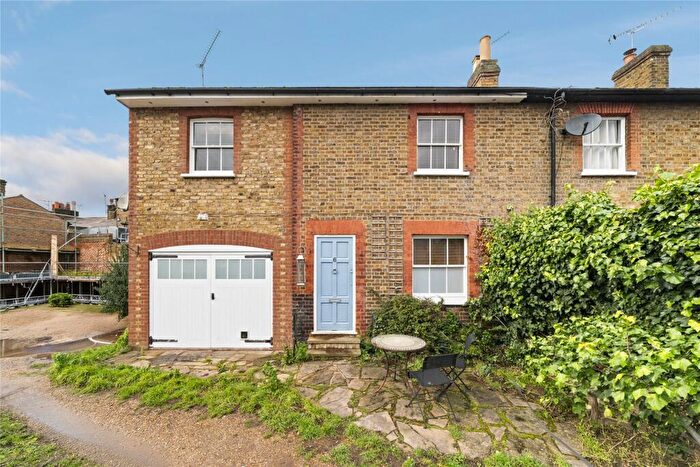
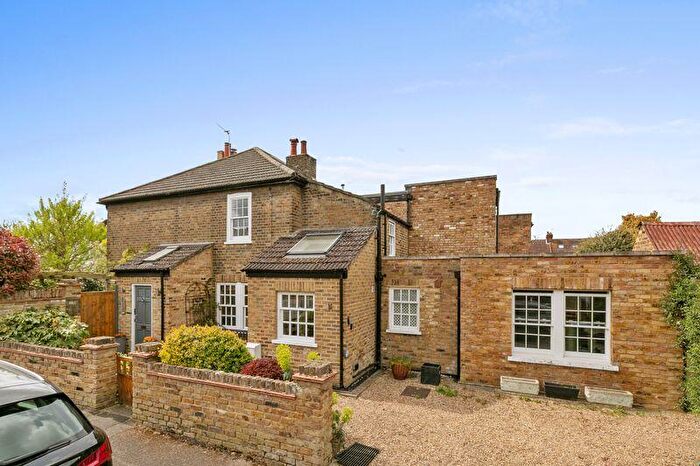
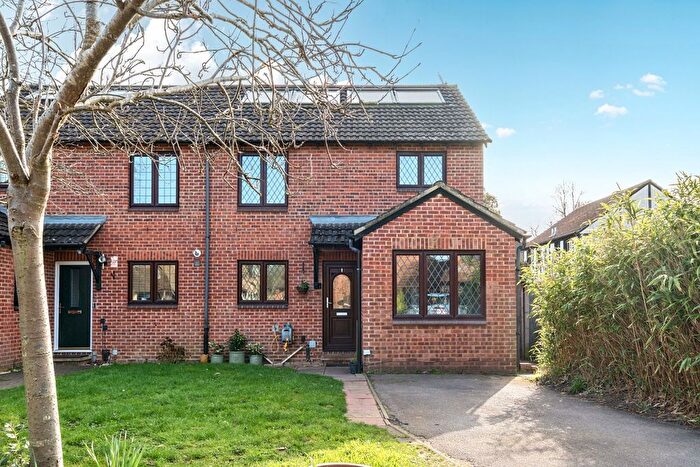
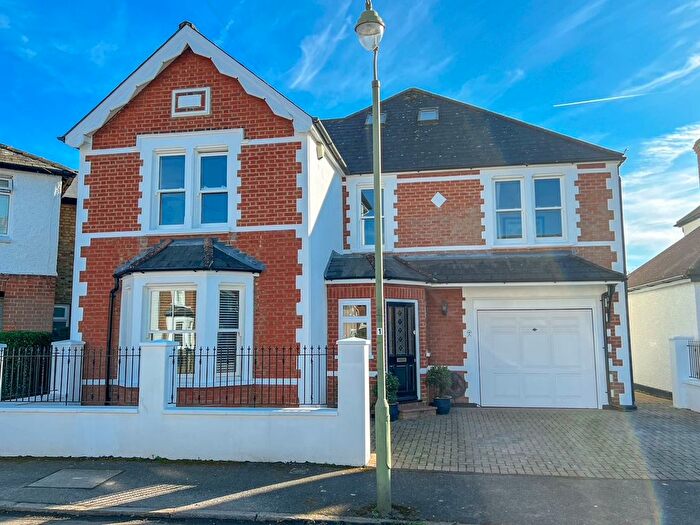
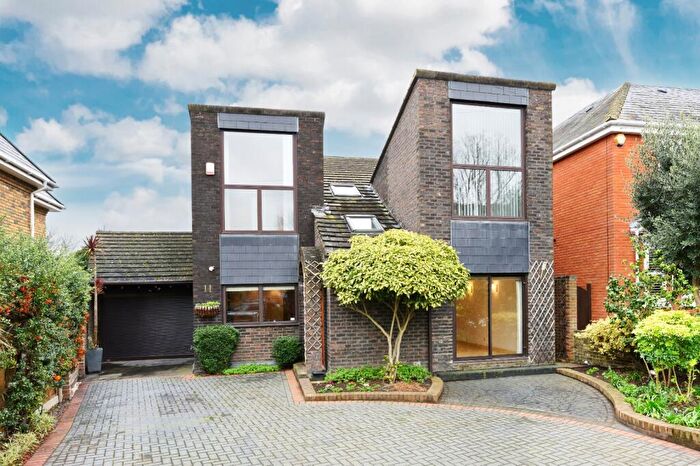
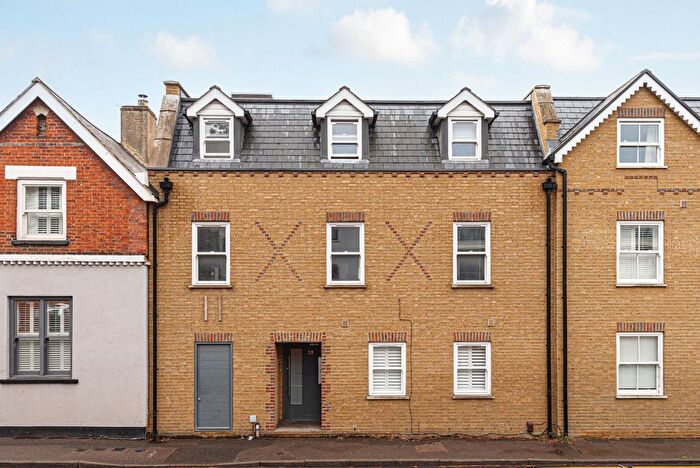
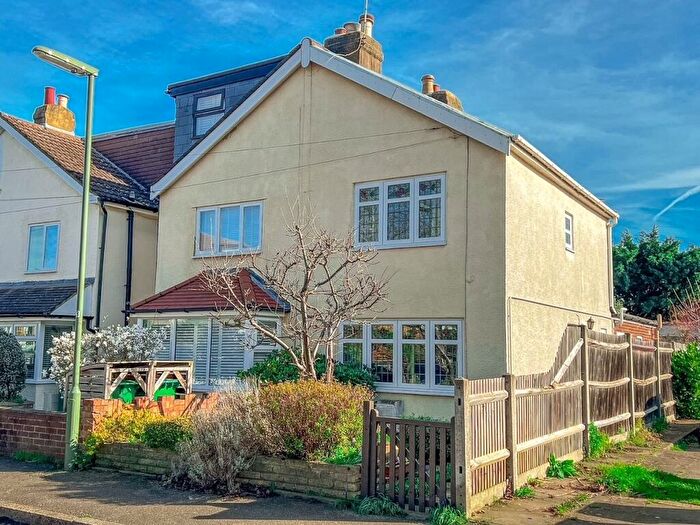
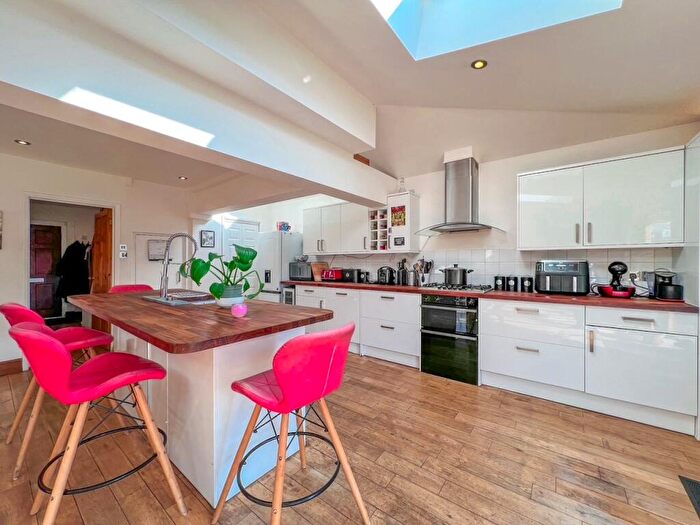
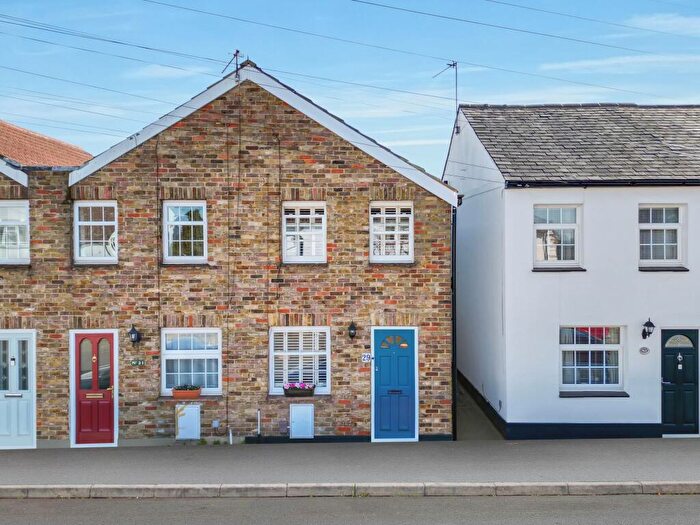
Properties for sale in Molesey East
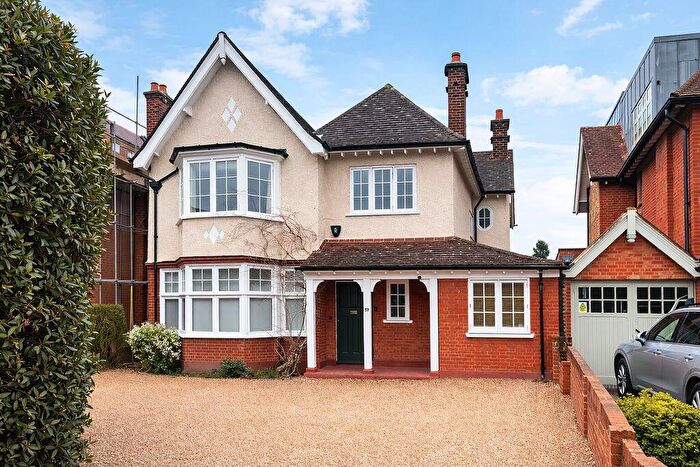
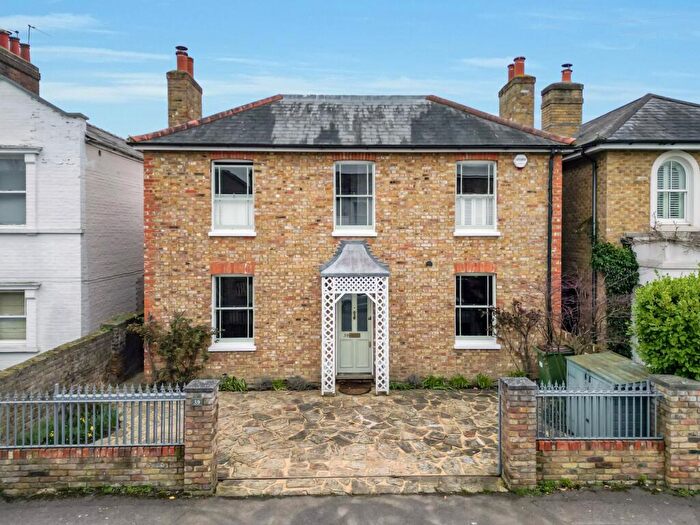

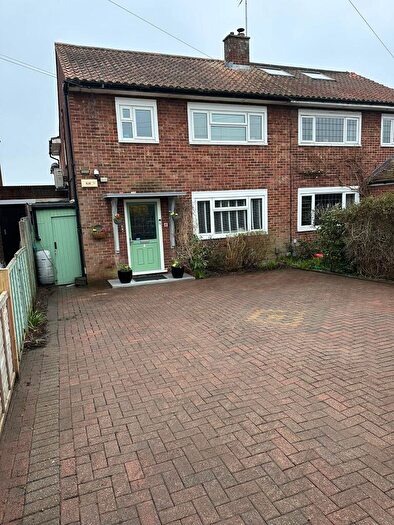
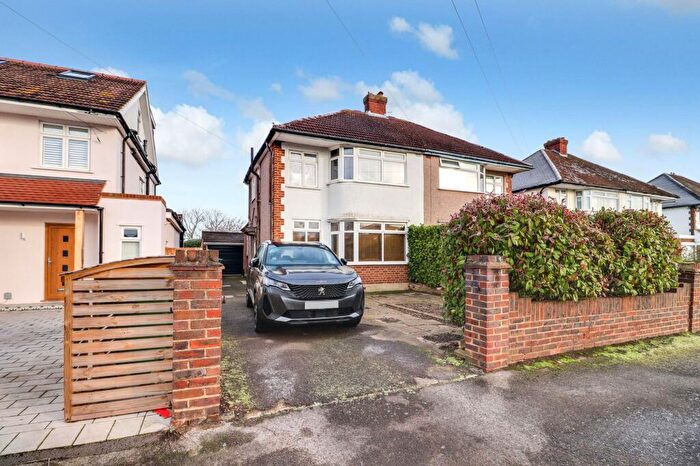
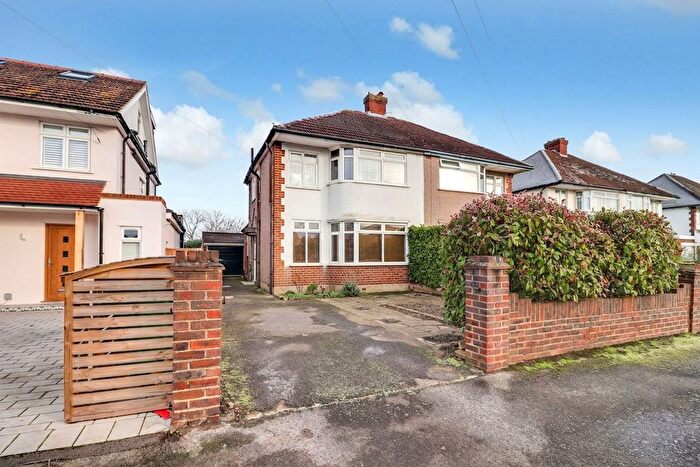
![]()
If you are looking to sell your house, let it out, or receive a property valuation, an expert can help you.
Click the button below to get started.


Roads and Postcodes in Molesey East
Navigate through our locations to find the location of your next house in Molesey East, East Molesey for sale or to rent.
| Streets | Postcodes |
|---|---|
| Alders Grove | KT8 0AB |
| Arnison Road | KT8 9JF KT8 9JJ KT8 9JP KT8 9JR |
| Barge Walk | KT8 9AJ KT8 9AW |
| Beauchamp Road | KT8 0PA |
| Bell Road | KT8 0SS |
| Bridge Gardens | KT8 9HU |
| Bridge Road | KT8 9EP KT8 9ER KT8 9EU KT8 9HA KT8 9HF KT8 9HH KT8 9HL KT8 9HN KT8 9HQ KT8 9HS KT8 9HT KT8 9HW KT8 9HX KT8 9HY |
| Broadfields | KT8 0BW |
| Cedar Close | KT8 9HR |
| Cedar Road | KT8 9HP |
| Challoners Close | KT8 0DW |
| Church Road | KT8 9DR KT8 9DS |
| Clinton Avenue | KT8 0HS |
| Creek Cottages | KT8 9BG |
| Creek Road | KT8 9BE |
| Dennis Road | KT8 9ED KT8 9EE |
| Ember Farm Avenue | KT8 0BJ |
| Ember Farm Way | KT8 0BH KT8 0BL |
| Ember Lane | KT8 0BS KT8 0BU |
| Esher Road | KT8 0AA KT8 0AD KT8 0AG KT8 0AH KT8 0AQ |
| Feltham Avenue | KT8 9BJ KT8 9BL KT8 9BT |
| Gladstone Place | KT8 9LZ |
| Graburn Way | KT8 9AL |
| Grove Road | KT8 9JS |
| Hampton Court Avenue | KT8 0BG KT8 0BQ |
| Hampton Court Crescent | KT8 9BA |
| Hampton Court Parade | KT8 9HE |
| Hampton Court Way | KT8 9AA KT8 9AD KT8 9AE |
| Hansler Grove | KT8 9JN KT8 9FF KT8 9FG |
| Hardys Mews | KT8 9BQ |
| Harrow Gardens | KT8 9GL |
| Hever Place | KT8 9FB |
| Hurst Lane | KT8 9EA KT8 9DX |
| Hurst Road | KT8 9AF KT8 9AG KT8 9AQ KT8 9AH KT8 9AY |
| Kent Road | KT8 9JZ |
| Kings Chase | KT8 9DG KT8 9DH KT8 9DQ |
| Manor Road | KT8 9JU KT8 9JX KT8 9JY |
| Matham Road | KT8 0BE KT8 0SU KT8 0SX |
| Molember Road | KT8 9NF KT8 9NH KT8 9NJ |
| Molesey Park Close | KT8 0NN |
| Molesey Park Road | KT8 0DB KT8 0JU KT8 0JX |
| Oarsman Place | KT8 9HJ |
| Orchard Lane | KT8 0BN |
| Palace Road | KT8 9DJ KT8 9DL KT8 9DN KT8 9DU KT8 9DW |
| Park Mews | KT8 9LD |
| Park Road | KT8 9LE |
| Parsons Mead | KT8 9DT |
| Pavilion Place | KT8 9FE |
| Pemberton Road | KT8 9LG KT8 9LH KT8 9LP KT8 9LJ KT8 9LW |
| Pemberton Terrace | KT8 0HR |
| Queens Reach | KT8 9DE |
| River Bank | KT8 9BH KT8 9JE |
| Riverside Avenue | KT8 0AE |
| Sandra Close | KT8 0AY |
| School Road | KT8 0DN |
| Seymour Close | KT8 0JY |
| Seymour Road | KT8 0PB KT8 0PF |
| Southfields | KT8 0BP |
| Spencer Road | KT8 0SP KT8 0SR KT8 0BD |
| St Johns Road | KT8 9JH |
| St Marys Road | KT8 0ST |
| Summer Avenue | KT8 9LU |
| Summer Gardens | KT8 9LT |
| Summer Road | KT8 9LR KT8 9LS KT8 9LX |
| The Riverside | KT8 9BF |
| The Wilderness | KT8 0JT |
| Vine Road | KT8 9JT KT8 9LA KT8 9LF KT8 9LB |
| Walton Road | KT8 0AF KT8 0DE KT8 0DF KT8 0DG KT8 0DH KT8 0DL KT8 0DP KT8 0DQ KT8 0DR KT8 0DS KT8 0DT KT8 0DU KT8 0GZ KT8 0HP KT8 0DX |
| Wolsey Road | KT8 9EL KT8 9EN KT8 9EW KT8 9EF |
Transport near Molesey East
-
 Hampton Court Station
 -
Thames Ditton Station
-
Hampton Station
-
Esher Station
-
Teddington Station
-
Hinchley Wood Station
-
Hampton Wick Station
-
Surbiton Station
-
Fulwell Station
-
Kingston Station
- FAQ
- Price Paid By Year
- Property Type Price
Frequently asked questions about Molesey East
What is the average price for a property for sale in Molesey East?
The average price for a property for sale in Molesey East is £929,138. This amount is 0.09% lower than the average price in East Molesey. There are 1,584 property listings for sale in Molesey East.
What streets have the most expensive properties for sale in Molesey East?
The streets with the most expensive properties for sale in Molesey East are Vine Road at an average of £2,021,428, Seymour Road at an average of £1,952,812 and Manor Road at an average of £1,885,000.
What streets have the most affordable properties for sale in Molesey East?
The streets with the most affordable properties for sale in Molesey East are Hampton Court Parade at an average of £304,500, Walton Road at an average of £367,878 and Bridge Road at an average of £432,642.
Which train stations are available in or near Molesey East?
Some of the train stations available in or near Molesey East are Hampton Court, Thames Ditton and Hampton.
Property Price Paid in Molesey East by Year
The average sold property price by year was:
| Year | Average Sold Price | Price Change |
Sold Properties
|
|---|---|---|---|
| 2025 | £967,062 | -0,2% |
72 Properties |
| 2024 | £969,462 | 12% |
110 Properties |
| 2023 | £852,901 | -17% |
94 Properties |
| 2022 | £996,366 | 6% |
130 Properties |
| 2021 | £938,627 | 5% |
188 Properties |
| 2020 | £892,180 | 4% |
112 Properties |
| 2019 | £857,841 | 9% |
110 Properties |
| 2018 | £783,805 | -6% |
113 Properties |
| 2017 | £828,334 | -1% |
109 Properties |
| 2016 | £834,069 | 10% |
130 Properties |
| 2015 | £748,085 | -8% |
140 Properties |
| 2014 | £805,068 | 9% |
140 Properties |
| 2013 | £733,383 | 18% |
154 Properties |
| 2012 | £602,536 | 1% |
135 Properties |
| 2011 | £597,557 | 11% |
104 Properties |
| 2010 | £533,001 | 12% |
122 Properties |
| 2009 | £470,195 | -22% |
105 Properties |
| 2008 | £571,968 | 1% |
96 Properties |
| 2007 | £567,652 | 22% |
178 Properties |
| 2006 | £444,265 | 10% |
229 Properties |
| 2005 | £401,071 | 2% |
174 Properties |
| 2004 | £391,344 | 12% |
174 Properties |
| 2003 | £344,437 | 4% |
153 Properties |
| 2002 | £332,207 | -0,1% |
196 Properties |
| 2001 | £332,691 | 15% |
150 Properties |
| 2000 | £281,497 | 16% |
160 Properties |
| 1999 | £236,504 | 15% |
222 Properties |
| 1998 | £200,711 | 14% |
178 Properties |
| 1997 | £172,996 | -4% |
192 Properties |
| 1996 | £179,059 | -13% |
217 Properties |
| 1995 | £201,839 | - |
150 Properties |
Property Price per Property Type in Molesey East
Here you can find historic sold price data in order to help with your property search.
The average Property Paid Price for specific property types in the last three years are:
| Property Type | Average Sold Price | Sold Properties |
|---|---|---|
| Semi Detached House | £951,885.00 | 66 Semi Detached Houses |
| Detached House | £1,689,760.00 | 69 Detached Houses |
| Terraced House | £679,223.00 | 49 Terraced Houses |
| Flat | £475,458.00 | 92 Flats |