
Houses for sale & to rent in Molesey East, West Molesey
House Prices in Molesey East
Properties in Molesey East have an average house price of £291k and had 6 Property Transactions within the last 3 years¹.
Molesey East is an area in West Molesey, Surrey with 74 households², where the most expensive property was sold for £550k.
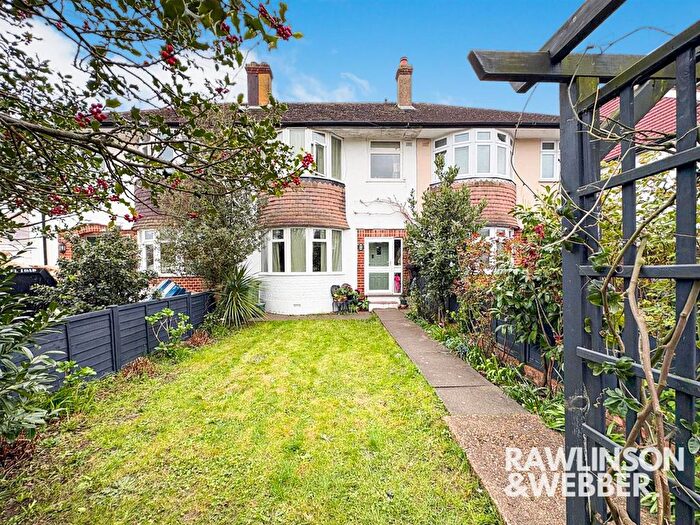
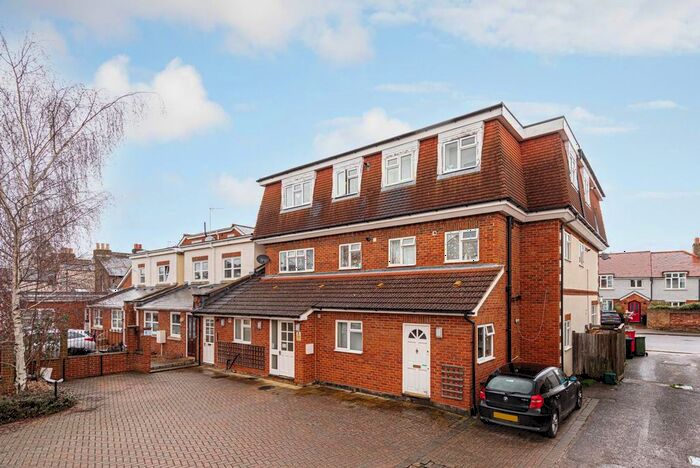
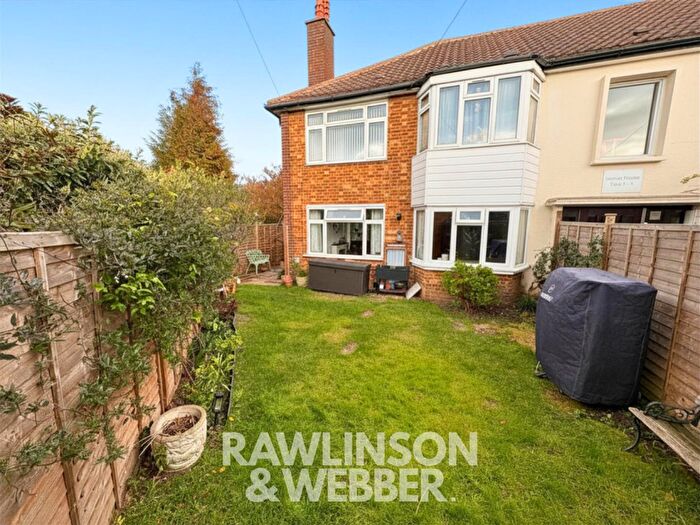
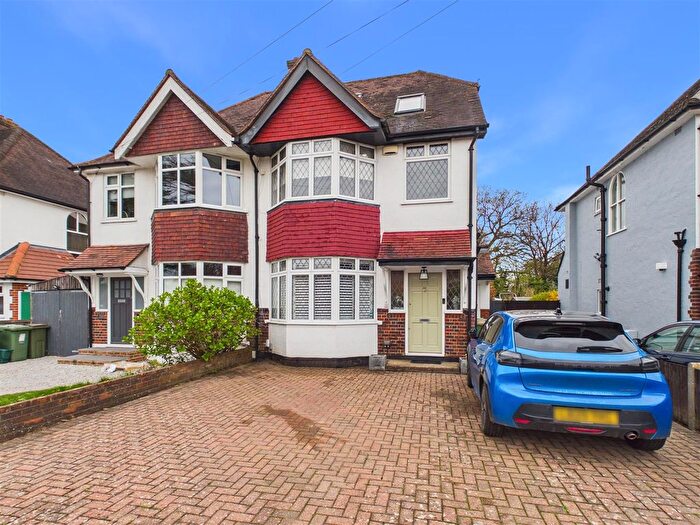
Properties for sale in Molesey East
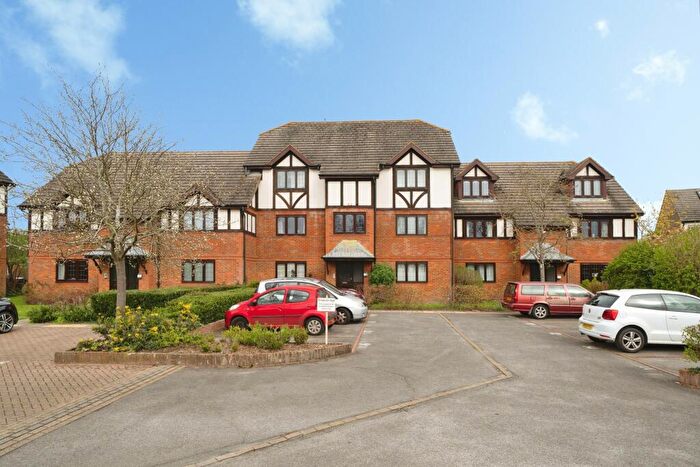


![]()
If you are looking to sell your house, let it out, or receive a property valuation, an expert can help you.
Click the button below to get started.

Roads and Postcodes in Molesey East
Navigate through our locations to find the location of your next house in Molesey East, West Molesey for sale or to rent.
| Streets | Postcodes |
|---|---|
| Abbey Walk | KT8 2JH KT8 2JL |
| Avern Gardens | KT8 2JS |
| Hidden Close | KT8 2BB |
| Hurst Road | KT8 1SE |
| Lavender Court | KT8 1NY |
| Spring Gardens | KT8 2JJ |
| Walton Road | KT8 2HT |
Transport near Molesey East
-
 Hampton Station
 -
Hampton Court Station
-
Thames Ditton Station
-
Esher Station
-
Teddington Station
-
Hersham Station
-
Fulwell Station
-
Hinchley Wood Station
-
Kempton Park Station
-
Hampton Wick Station
- FAQ
- Price Paid By Year
- Property Type Price
Frequently asked questions about Molesey East
What is the average price for a property for sale in Molesey East?
The average price for a property for sale in Molesey East is £291,250. This amount is 43% lower than the average price in West Molesey. There are 2,196 property listings for sale in Molesey East.
What streets have the most expensive properties for sale in Molesey East?
The streets with the most expensive properties for sale in Molesey East are Walton Road at an average of £422,500 and Hidden Close at an average of £375,000.
What streets have the most affordable properties for sale in Molesey East?
The street with the most affordable properties for sale in Molesey East is Abbey Walk at an average of £175,833.
Which train stations are available in or near Molesey East?
Some of the train stations available in or near Molesey East are Hampton, Hampton Court and Thames Ditton.
Property Price Paid in Molesey East by Year
The average sold property price by year was:
| Year | Average Sold Price | Price Change |
Sold Properties
|
|---|---|---|---|
| 2025 | £263,333 | -109% |
3 Properties |
| 2024 | £550,000 | 63% |
1 Property |
| 2023 | £203,750 | -16% |
2 Properties |
| 2022 | £236,166 | -97% |
3 Properties |
| 2021 | £464,333 | 45% |
3 Properties |
| 2020 | £254,000 | 36% |
2 Properties |
| 2019 | £161,500 | -60% |
2 Properties |
| 2018 | £258,975 | -35% |
2 Properties |
| 2017 | £350,000 | 6% |
2 Properties |
| 2016 | £330,200 | 25% |
5 Properties |
| 2015 | £248,666 | -19% |
3 Properties |
| 2014 | £294,891 | -8% |
6 Properties |
| 2013 | £318,390 | 34% |
5 Properties |
| 2012 | £210,000 | -95% |
1 Property |
| 2011 | £410,000 | -82% |
2 Properties |
| 2010 | £746,250 | 76% |
2 Properties |
| 2008 | £177,500 | 6% |
2 Properties |
| 2007 | £166,487 | -1% |
4 Properties |
| 2006 | £167,333 | 1% |
3 Properties |
| 2004 | £166,000 | -1% |
2 Properties |
| 2003 | £167,500 | -43% |
2 Properties |
| 2002 | £238,750 | 69% |
4 Properties |
| 2001 | £74,000 | -28% |
2 Properties |
| 2000 | £95,000 | 14% |
2 Properties |
| 1999 | £82,090 | 27% |
5 Properties |
| 1998 | £59,997 | -33% |
2 Properties |
| 1996 | £79,500 | 9% |
3 Properties |
| 1995 | £72,500 | - |
1 Property |
Property Price per Property Type in Molesey East
Here you can find historic sold price data in order to help with your property search.
The average Property Paid Price for specific property types in the last three years are:
| Property Type | Average Sold Price | Sold Properties |
|---|---|---|
| Flat | £239,500.00 | 5 Flats |
| Terraced House | £550,000.00 | 1 Terraced House |