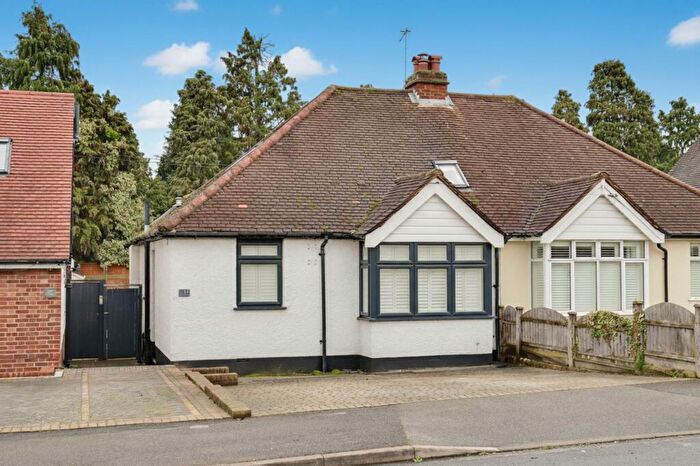
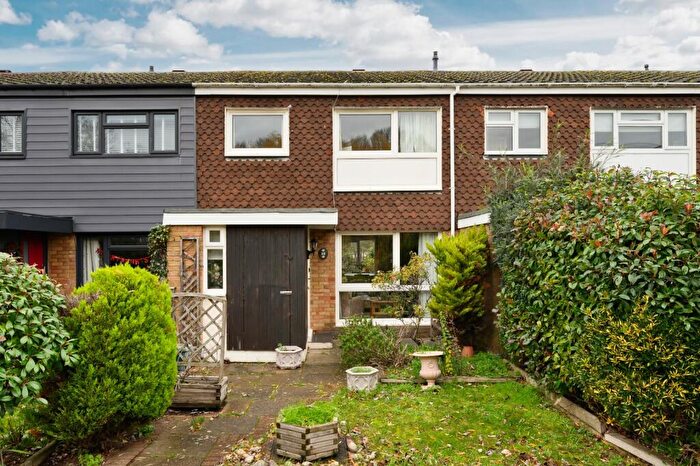
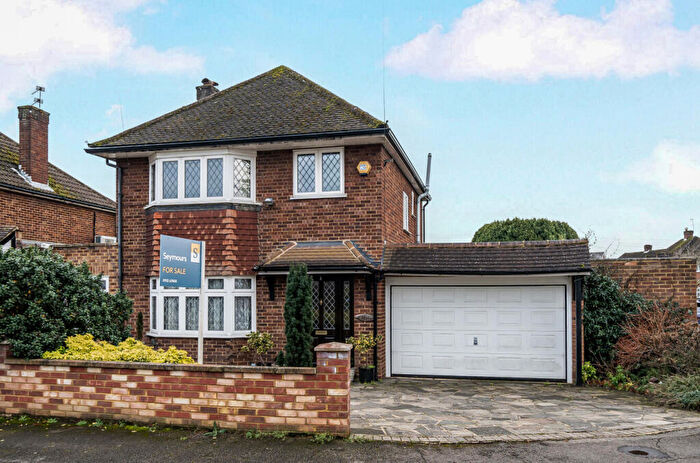
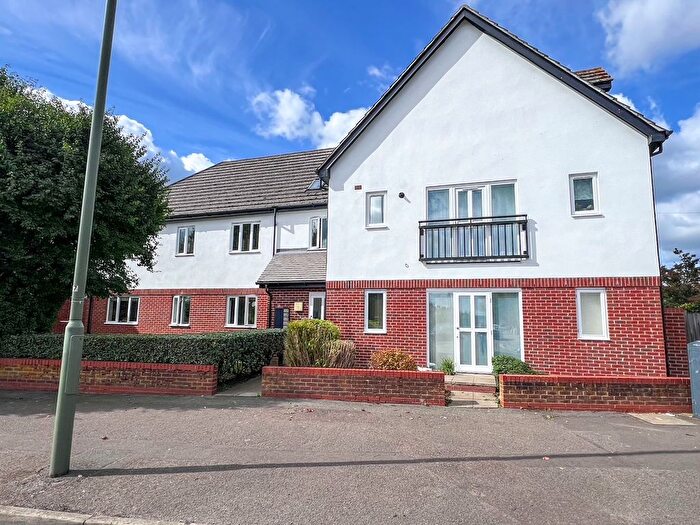
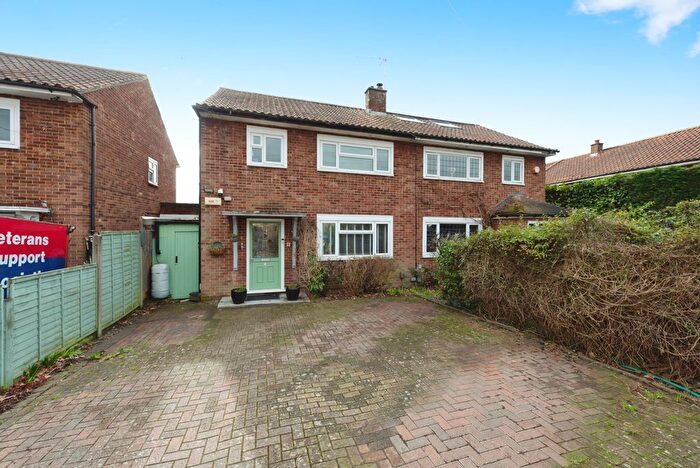
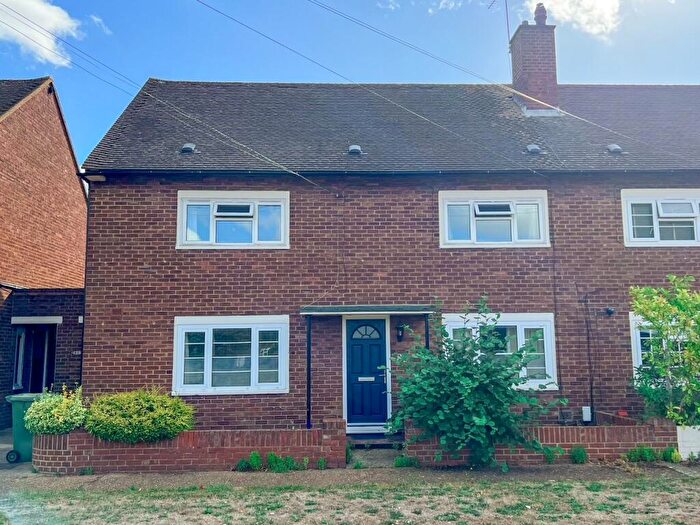
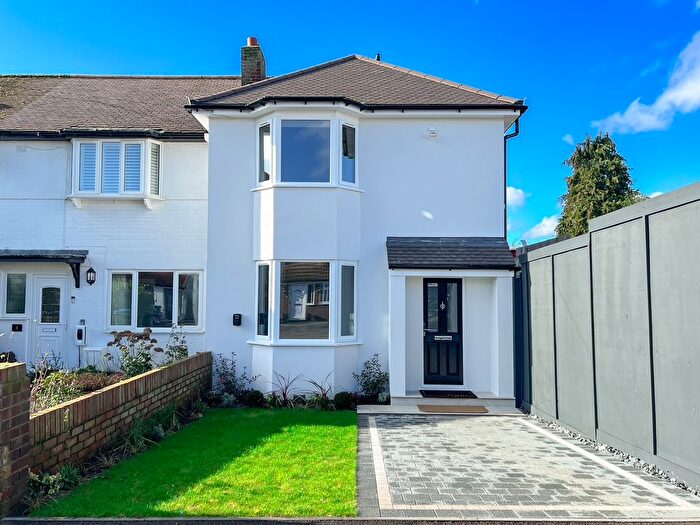
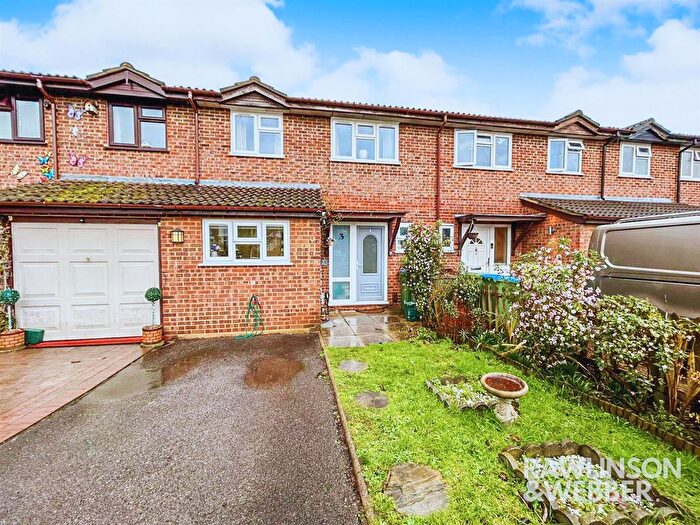
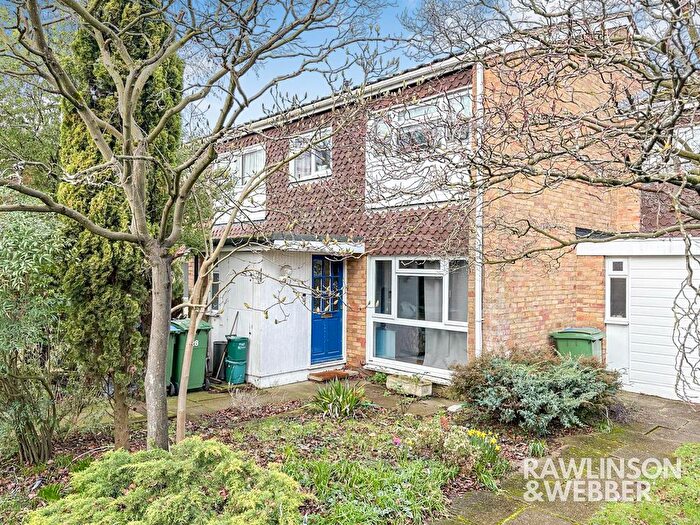
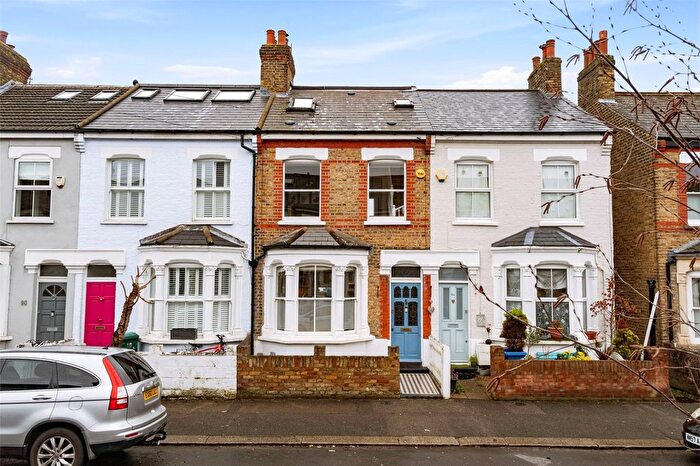
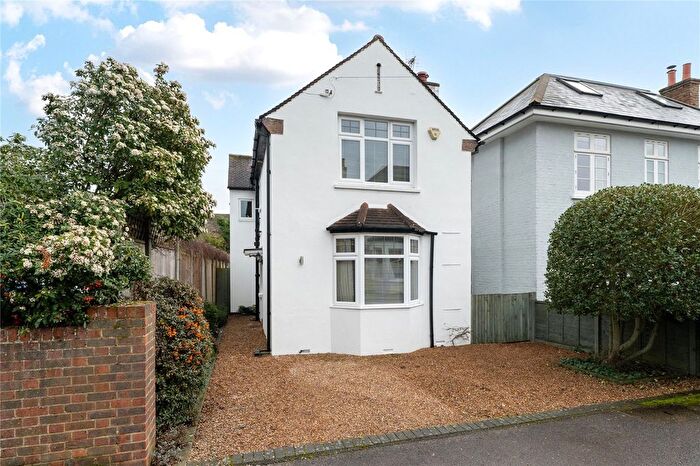
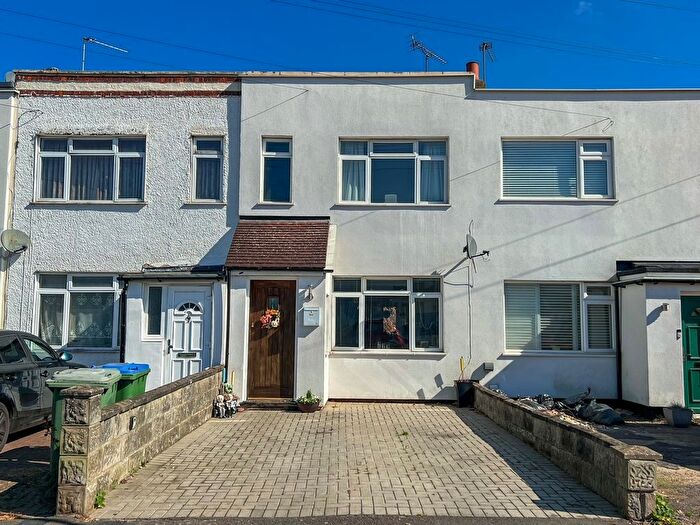
Houses for sale & to rent in Molesey North, West Molesey
House Prices in Molesey North
Properties in Molesey North have an average house price of £542,653.00 and had 208 Property Transactions within the last 3 years¹.
Molesey North is an area in West Molesey, Surrey with 2,353 households², where the most expensive property was sold for £1,215,000.00.
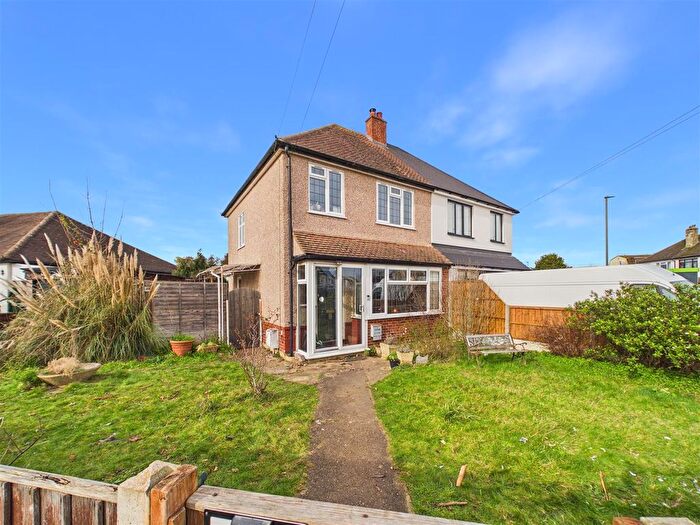
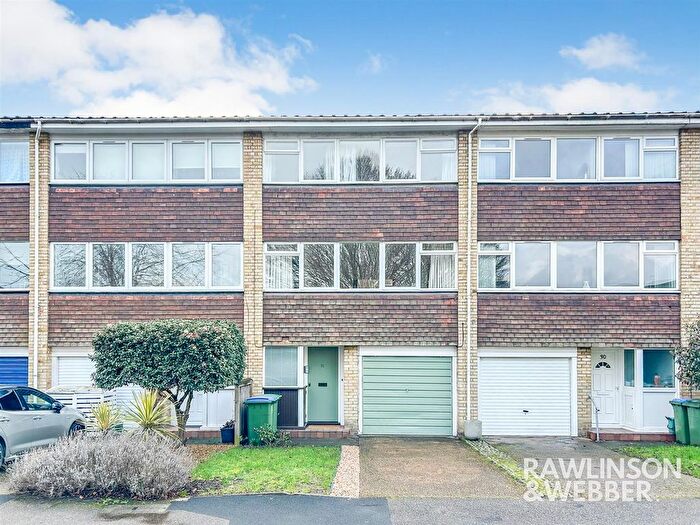
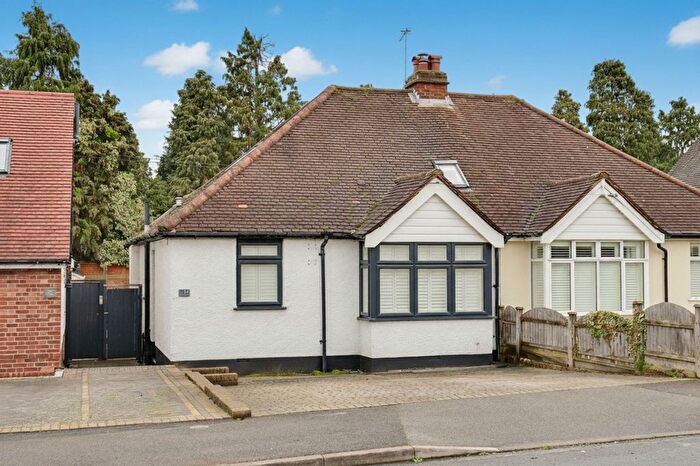
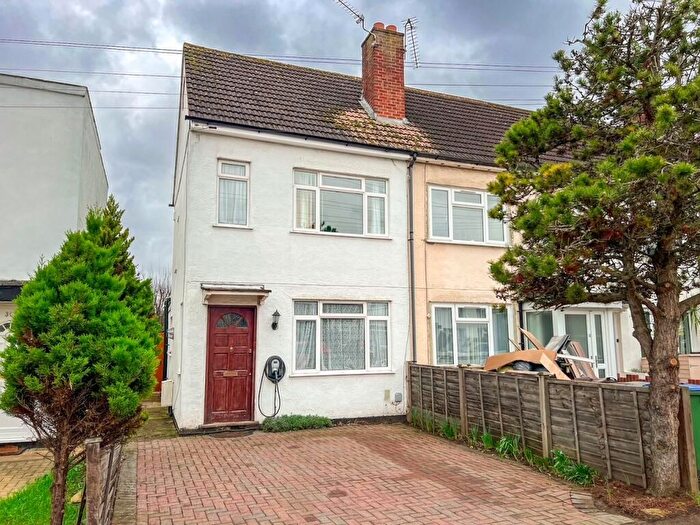
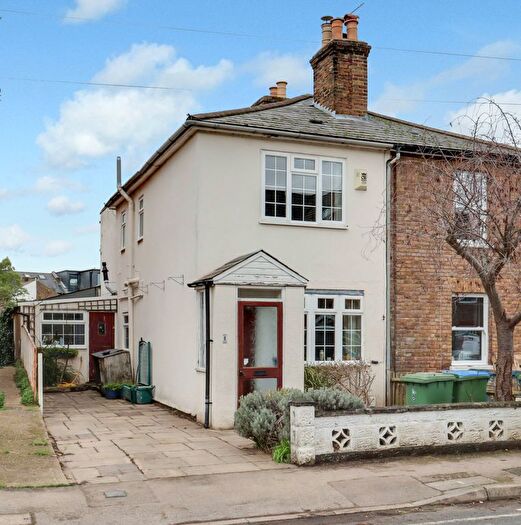
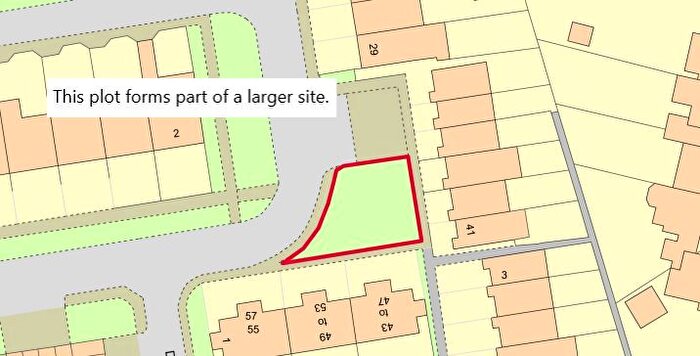
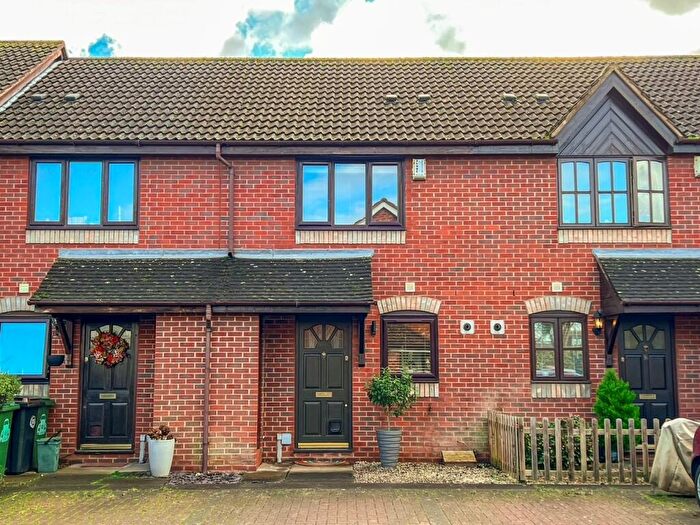
Properties for sale in Molesey North
Roads and Postcodes in Molesey North
Navigate through our locations to find the location of your next house in Molesey North, West Molesey for sale or to rent.
| Streets | Postcodes |
|---|---|
| Adecroft Way | KT8 1PH |
| Apps Meadow Close | KT8 2AE |
| Augusta Close | KT8 2TL |
| Balmoral Crescent | KT8 1PY KT8 1QA |
| Bedster Gardens | KT8 1SZ KT8 1TA KT8 1TB |
| Beldham Gardens | KT8 1TF |
| Berkeley Drive | KT8 1RA |
| Bishop Fox Way | KT8 2AS KT8 2AT KT8 2RH |
| Boleyn Drive | KT8 1RD KT8 1RE |
| Buckingham Avenue | KT8 1SY KT8 1TG |
| Buckingham Gardens | KT8 1TH KT8 1TJ KT8 1TN KT8 1TW |
| Cambridge Road | KT8 2AU KT8 2AX |
| Carlyle Close | KT8 1SX |
| Cherimoya Gardens | KT8 1SA |
| Cherry Orchard Gardens | KT8 1QY |
| Cherry Orchard Road | KT8 1QZ |
| Churchfields | KT8 1PU |
| Coppsfield | KT8 1SN |
| Dundas Gardens | KT8 1RX |
| Dunstall Way | KT8 1PD |
| First Close | KT8 1PJ KT8 1PL |
| Freeman Drive | KT8 2TN |
| Garrick Gardens | KT8 1SJ KT8 1SL |
| Grafton Way | KT8 2NW |
| Hollingworth Close | KT8 2TW |
| Hotham Close | KT8 1SH |
| Hurst Road | KT8 1QN KT8 1QR KT8 1QS KT8 1QT KT8 1QW KT8 1RF |
| Hurstfield Road | KT8 1QU |
| Kelvinbrook | KT8 1RT KT8 1RU KT8 1RY KT8 1RZ |
| Linkfield | KT8 1SD |
| Lytcott Drive | KT8 2TJ |
| Merton Way | KT8 1PG KT8 1PQ |
| Mole Abbey Gardens | KT8 1QD |
| Molesham Close | KT8 1PA |
| Molesham Way | KT8 1NT KT8 1NU KT8 1NX |
| Monaveen Gardens | KT8 1SB |
| Mountwood | KT8 1RP |
| New Road | KT8 1PT KT8 1PX KT8 1QB |
| Park Way | KT8 1PE KT8 1PF |
| River Bank | KT8 1QX |
| Rosemary Avenue | KT8 1QE KT8 1QF |
| Rupert Court | KT8 2QD |
| Sadlers Ride | KT8 1SU |
| Sandringham Gardens | KT8 1QG |
| Second Close | KT8 1PN |
| Spurfield | KT8 1RR KT8 1RS |
| St Peters Road | KT8 2QE |
| Thames Meadow | KT8 1TQ |
| The Crescent | KT8 1RB |
| The Fairway | KT8 1PB |
| The Forum | KT8 1NS |
| Third Close | KT8 1PW |
| Tufton Gardens | KT8 1TD KT8 1TE |
| Victoria Avenue | KT8 1SG KT8 1TL KT8 1TP |
| Victoria Close | KT8 1SQ |
| Walton Road | KT8 2DY KT8 2EJ KT8 2HZ KT8 2JN KT8 2QG KT8 2QQ |
| Weldon Drive | KT8 2NT KT8 2QR |
| Weston Avenue | KT8 1RG |
| Wilton Gardens | KT8 1QP |
| Winchilsea Crescent | KT8 1ST |
| Windsor Avenue | KT8 1PZ |
Transport near Molesey North
-
Hampton Station
-
Hampton Court Station
-
Thames Ditton Station
-
Esher Station
-
Kempton Park Station
-
Teddington Station
-
Fulwell Station
-
Hersham Station
-
Sunbury Station
-
Hinchley Wood Station
- FAQ
- Price Paid By Year
- Property Type Price
Frequently asked questions about Molesey North
What is the average price for a property for sale in Molesey North?
The average price for a property for sale in Molesey North is £542,653. This amount is 6% higher than the average price in West Molesey. There are 2,163 property listings for sale in Molesey North.
What streets have the most expensive properties for sale in Molesey North?
The streets with the most expensive properties for sale in Molesey North are Cherry Orchard Road at an average of £980,000, Hurstfield Road at an average of £862,500 and Dunstall Way at an average of £841,666.
What streets have the most affordable properties for sale in Molesey North?
The streets with the most affordable properties for sale in Molesey North are Victoria Avenue at an average of £333,468, Rupert Court at an average of £335,000 and Cambridge Road at an average of £343,666.
Which train stations are available in or near Molesey North?
Some of the train stations available in or near Molesey North are Hampton, Hampton Court and Thames Ditton.
Property Price Paid in Molesey North by Year
The average sold property price by year was:
| Year | Average Sold Price | Price Change |
Sold Properties
|
|---|---|---|---|
| 2025 | £573,998 | 8% |
63 Properties |
| 2024 | £525,905 | -1% |
77 Properties |
| 2023 | £532,576 | -10% |
68 Properties |
| 2022 | £585,423 | 13% |
99 Properties |
| 2021 | £509,472 | 4% |
125 Properties |
| 2020 | £489,461 | -2% |
93 Properties |
| 2019 | £498,142 | 5% |
89 Properties |
| 2018 | £472,948 | 2% |
88 Properties |
| 2017 | £461,404 | 3% |
90 Properties |
| 2016 | £447,354 | 11% |
107 Properties |
| 2015 | £400,238 | 6% |
96 Properties |
| 2014 | £378,156 | 14% |
129 Properties |
| 2013 | £325,629 | 3% |
94 Properties |
| 2012 | £316,361 | 2% |
89 Properties |
| 2011 | £310,656 | 8% |
81 Properties |
| 2010 | £285,850 | 4% |
87 Properties |
| 2009 | £275,777 | -9% |
73 Properties |
| 2008 | £299,942 | 2% |
54 Properties |
| 2007 | £293,228 | 10% |
141 Properties |
| 2006 | £264,506 | 11% |
182 Properties |
| 2005 | £234,517 | 0,4% |
94 Properties |
| 2004 | £233,472 | 4% |
109 Properties |
| 2003 | £224,008 | 11% |
101 Properties |
| 2002 | £199,233 | 10% |
166 Properties |
| 2001 | £179,182 | 12% |
148 Properties |
| 2000 | £157,108 | 19% |
112 Properties |
| 1999 | £127,857 | 4% |
145 Properties |
| 1998 | £122,136 | 13% |
119 Properties |
| 1997 | £106,679 | 14% |
132 Properties |
| 1996 | £91,386 | -9% |
131 Properties |
| 1995 | £99,434 | - |
89 Properties |
Property Price per Property Type in Molesey North
Here you can find historic sold price data in order to help with your property search.
The average Property Paid Price for specific property types in the last three years are:
| Property Type | Average Sold Price | Sold Properties |
|---|---|---|
| Semi Detached House | £599,711.00 | 57 Semi Detached Houses |
| Detached House | £728,041.00 | 34 Detached Houses |
| Terraced House | £514,512.00 | 82 Terraced Houses |
| Flat | £335,565.00 | 35 Flats |

