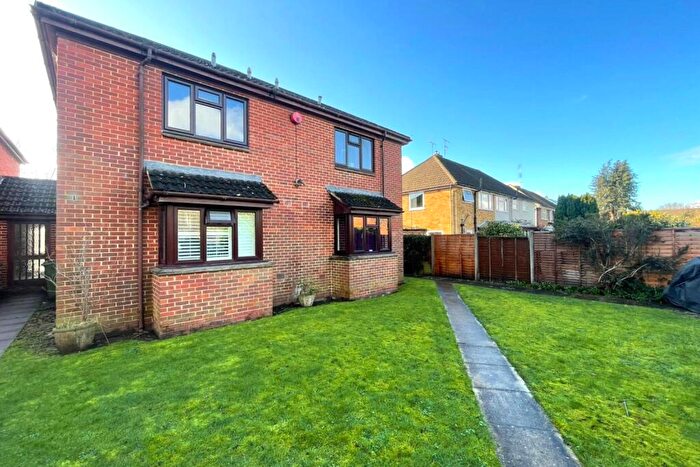
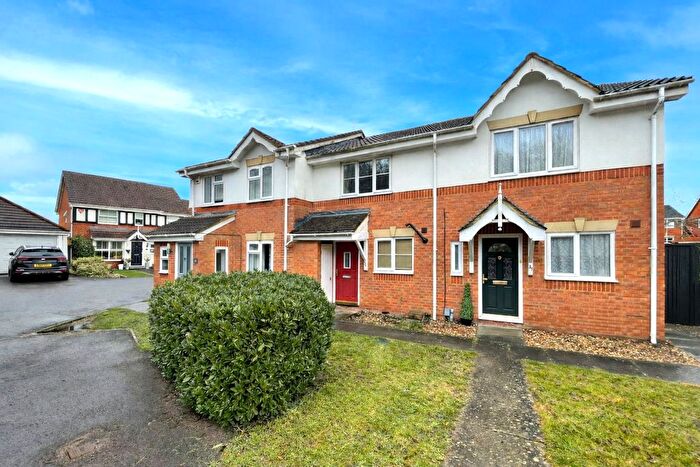
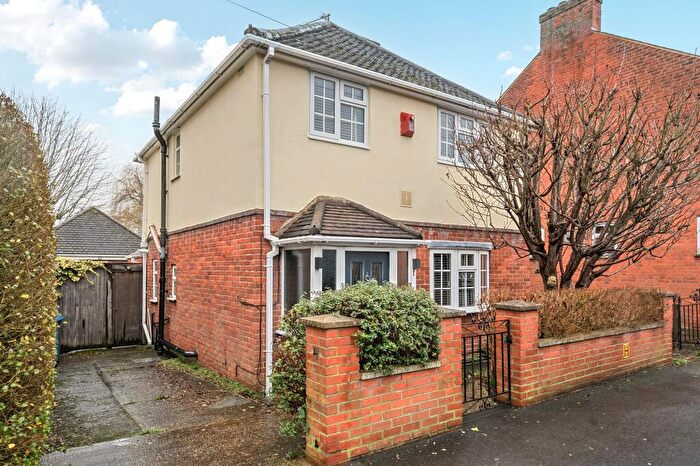
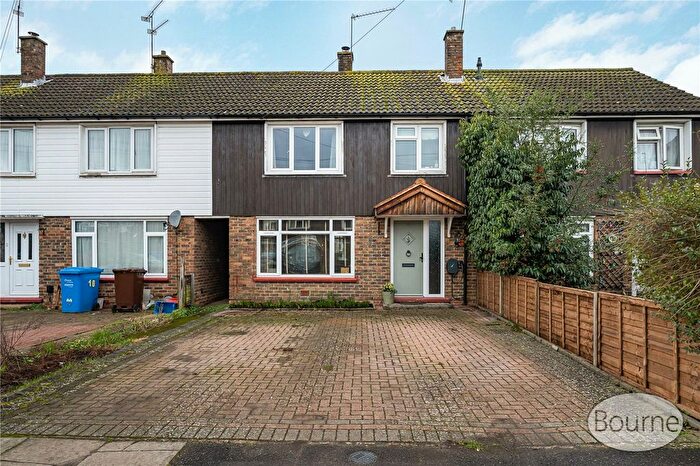
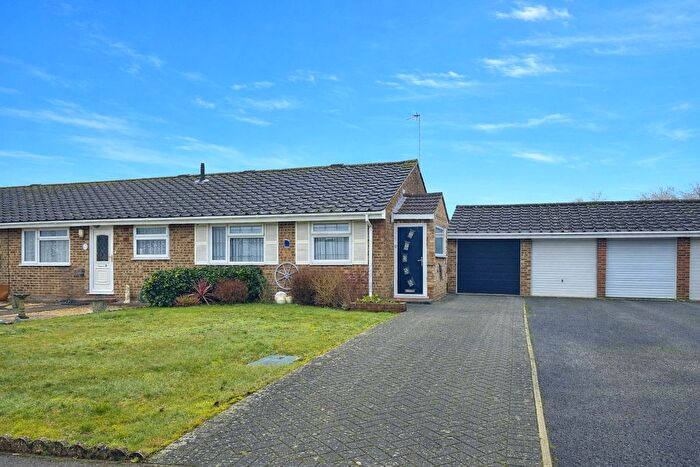
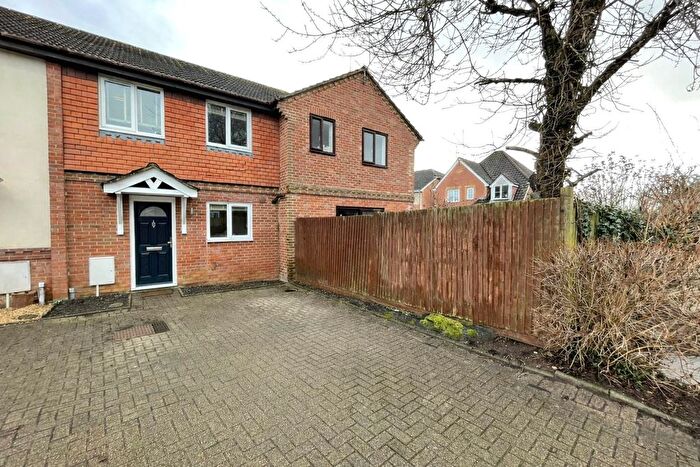
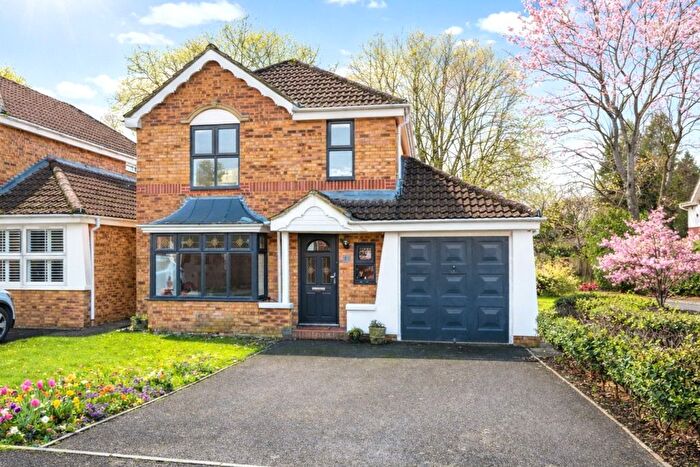
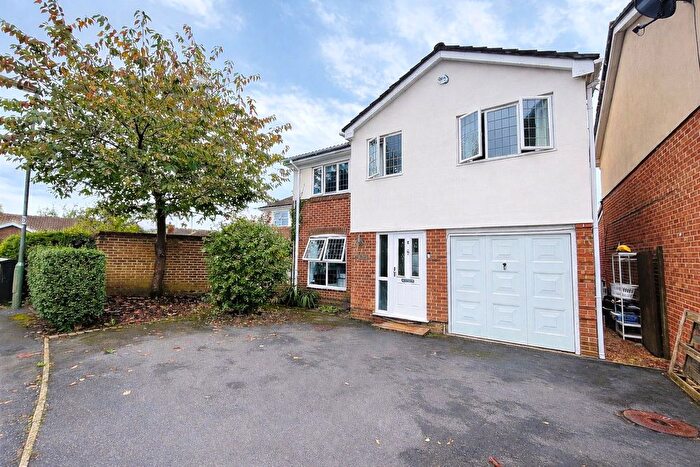
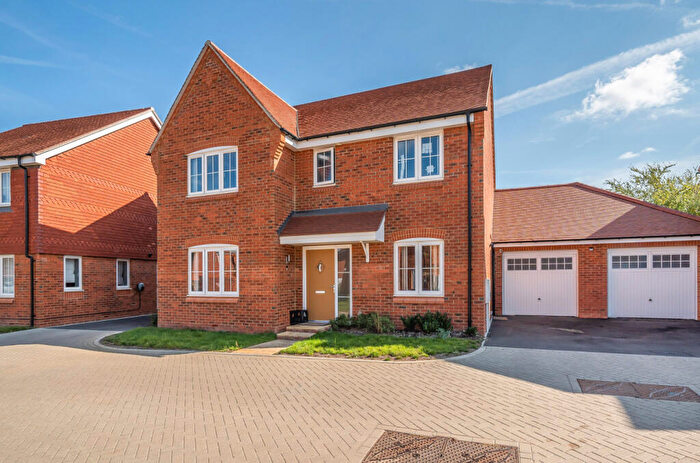
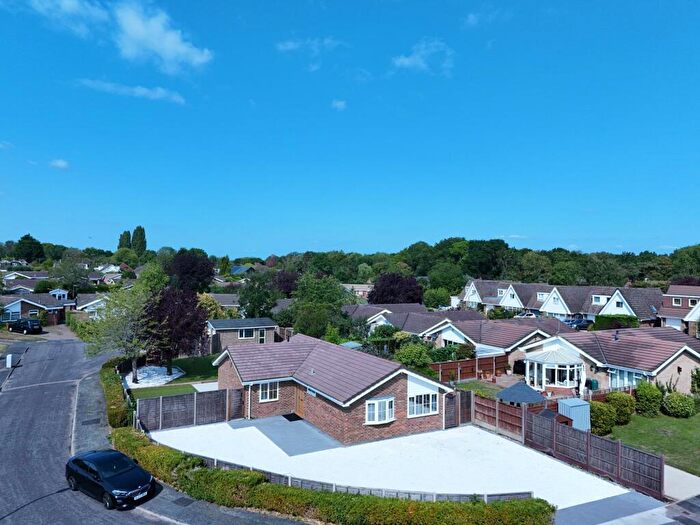
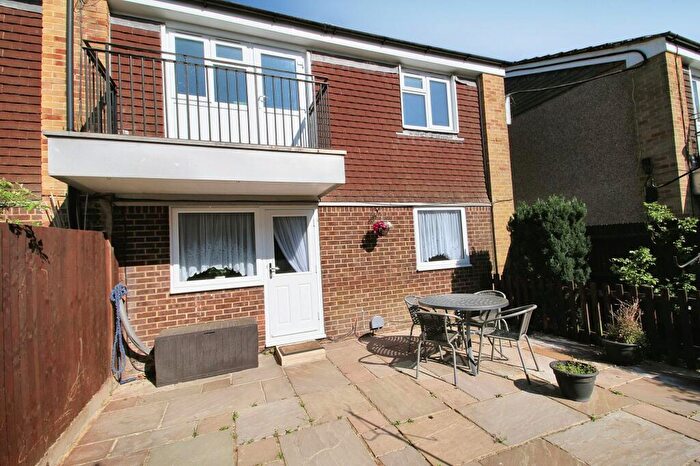
Houses for sale & to rent in Ash South And Tongham, Farnham
House Prices in Ash South And Tongham
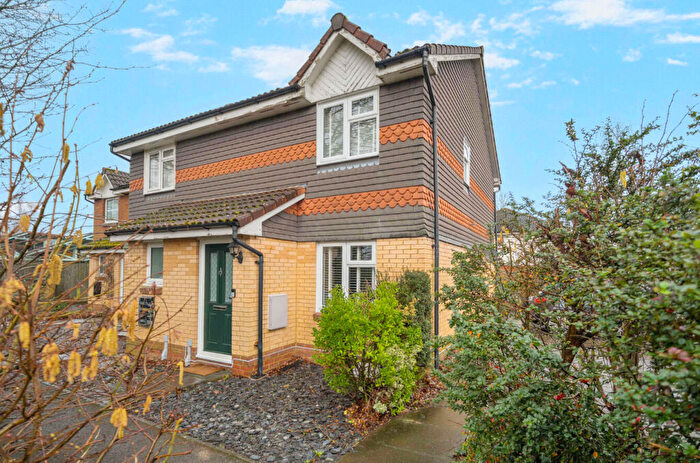
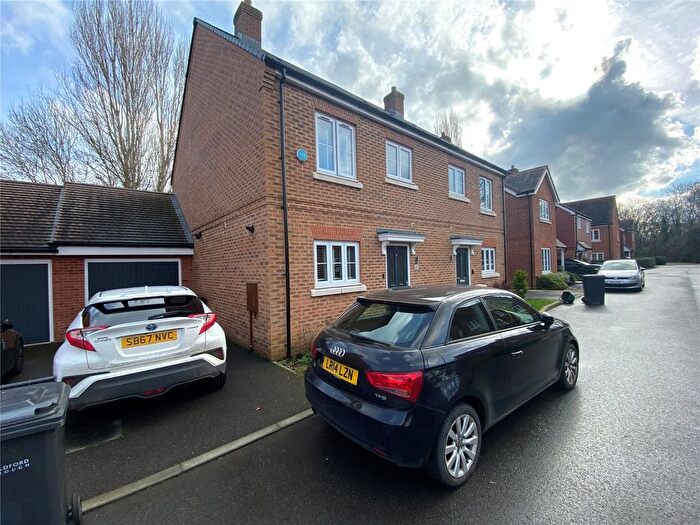
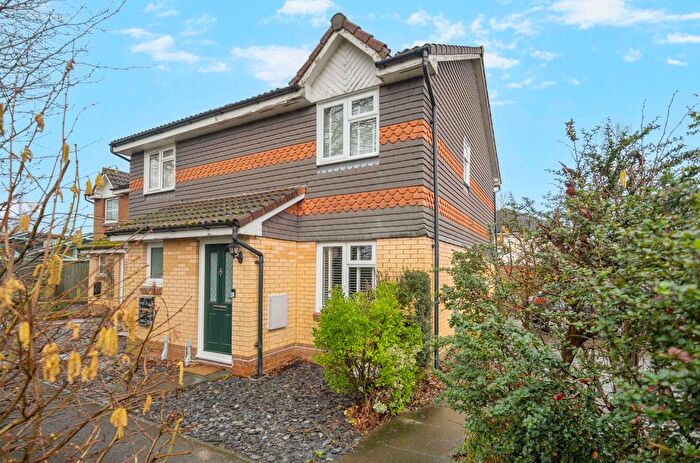
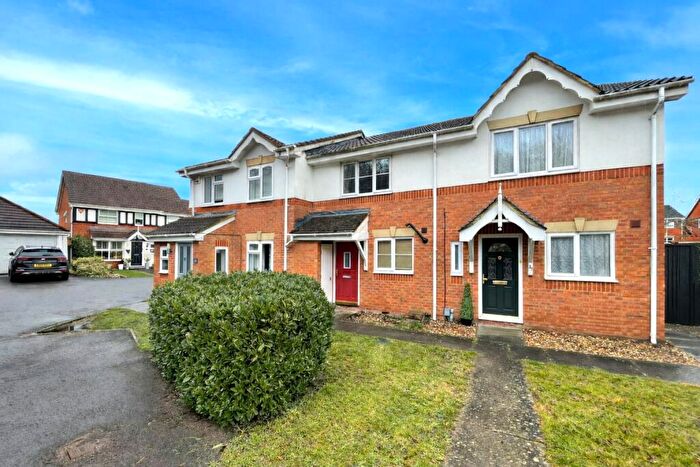
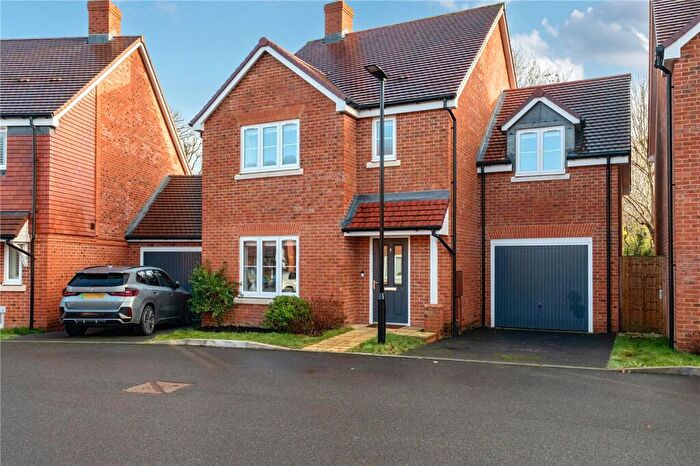
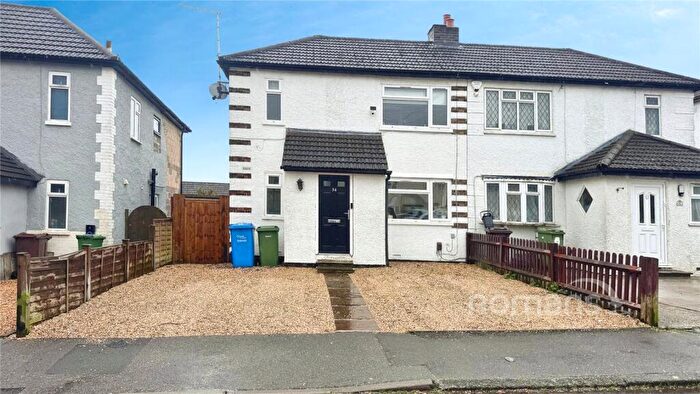
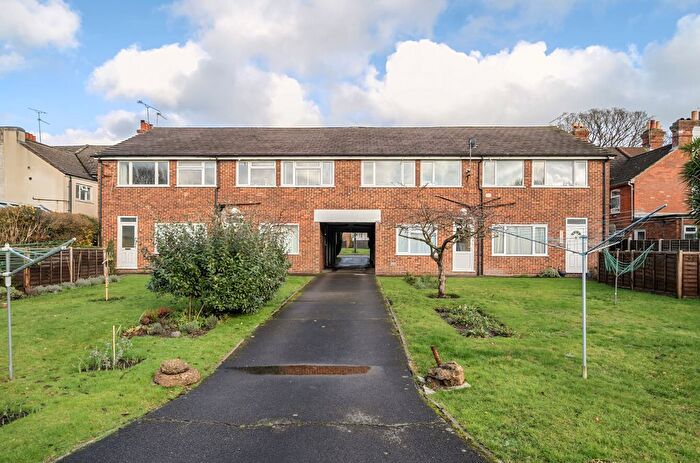
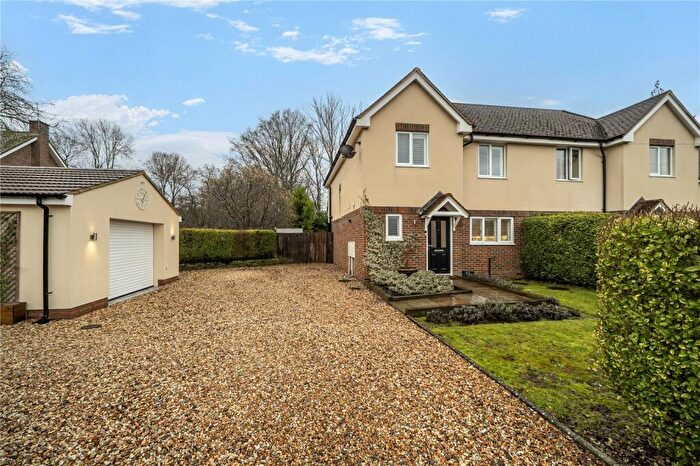
Properties in Ash South And Tongham have an average house price of £438,306.00 and had 166 Property Transactions within the last 3 years¹.
Ash South And Tongham is an area in Farnham, Surrey with 1,399 households², where the most expensive property was sold for £3,000,000.00.
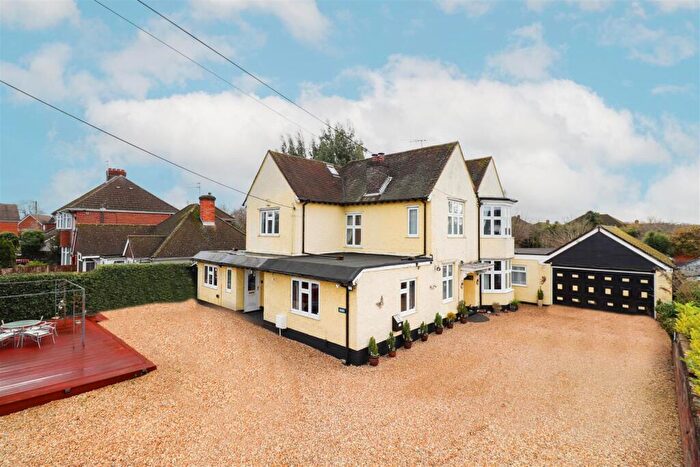
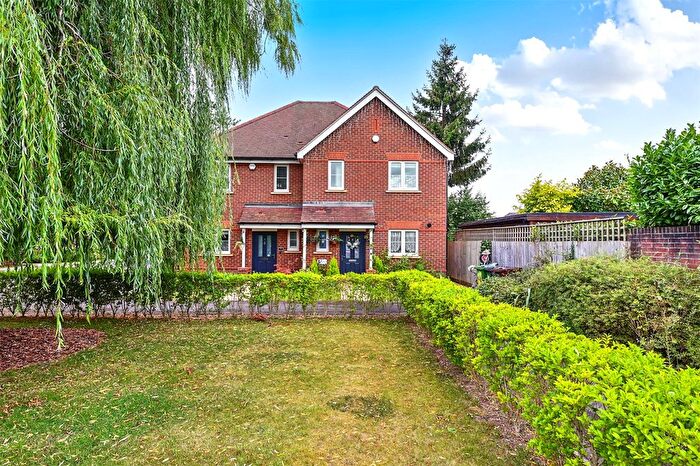
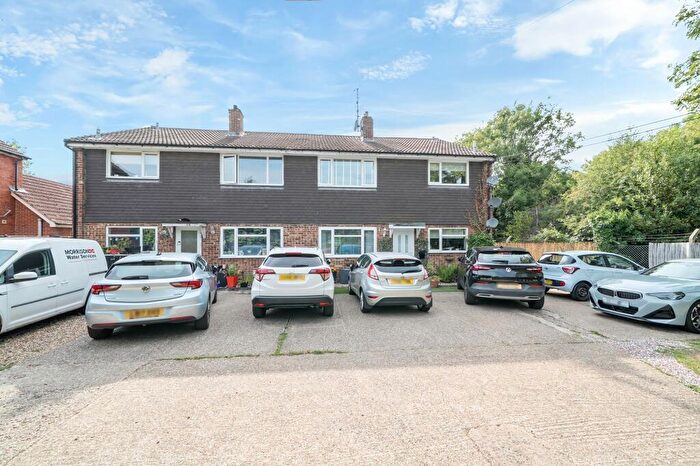
Properties for sale in Ash South And Tongham
Roads and Postcodes in Ash South And Tongham
Navigate through our locations to find the location of your next house in Ash South And Tongham, Farnham for sale or to rent.
| Streets | Postcodes |
|---|---|
| Blenheim Close | GU10 1BW |
| Bridge Mews | GU10 1ER |
| Carfax Avenue | GU10 1BB GU10 1BD GU10 1BE GU10 1BH |
| Chester Way | GU10 1EJ |
| Church Close | GU10 1FF |
| East Ring | GU10 1EE |
| Ellison Way | GU10 1AY GU10 1AZ |
| Elm Lane | GU10 1BX |
| Field Way | GU10 1BQ |
| Garbetts Way | GU10 1EG |
| Grange Court | GU10 1DW |
| Grange Road | GU10 1DJ GU10 1DN |
| Grieve Close | GU10 1BZ |
| Hogs Back | GU10 1EU GU10 1JX GU10 1LA GU10 1EX |
| Howard Cole Gardens | GU10 1FL |
| Kings Avenue | GU10 1AU GU10 1AX |
| Kings Court | GU10 1AH |
| Lambourne Way | GU10 1AB GU10 1AD |
| Maitlands Close | GU10 1EQ |
| Manor Close | GU10 1DB |
| Manor Farm Business Centre | GU10 1DE |
| Manor Road | GU10 1BA GU10 1BJ GU10 1BL |
| Moore Close | GU10 1YZ |
| New Road | GU10 1DF |
| Newton Way | GU10 1BY |
| North Side | GU10 1EA GU10 1EB GU10 1ED |
| North Side Court | GU10 1EW |
| Overton Court | GU10 1EY |
| Oxenden Court | GU10 1AP |
| Oxenden Road | GU10 1AF GU10 1AG GU10 1AJ GU10 1AR GU10 1AS GU10 1AT GU10 1DT |
| Parsons Way | GU10 1FB |
| Pawley Close | GU10 1DR |
| Phillips Close | GU10 1AW |
| Poyle Road | GU10 1BS GU10 1DS GU10 1DU GU10 1DX GU10 1DY |
| Russet Close | GU10 1BN |
| South Side | GU10 1EH |
| Spoil Lane | GU10 1BP |
| St Pauls Close | GU10 1EN |
| The Elms | GU10 1DA |
| The Gardens | GU10 1DZ |
| The Moors | GU10 1AQ |
| The Street | GU10 1AA GU10 1AE GU10 1DD GU10 1DG GU10 1DH GU10 1DQ GU10 1DP GU10 1EP |
| Tongham Meadows | GU10 1AL |
| West Ridge | GU10 1JU |
| West Ring | GU10 1EF |
| White Lane | GU10 1BT GU10 1BU |
| Yalden Gardens | GU10 1FJ |
| Yeomans Close | GU10 1BG |
Transport near Ash South And Tongham
- FAQ
- Price Paid By Year
- Property Type Price
Frequently asked questions about Ash South And Tongham
What is the average price for a property for sale in Ash South And Tongham?
The average price for a property for sale in Ash South And Tongham is £438,306. This amount is 33% lower than the average price in Farnham. There are 2,515 property listings for sale in Ash South And Tongham.
What streets have the most expensive properties for sale in Ash South And Tongham?
The streets with the most expensive properties for sale in Ash South And Tongham are West Ridge at an average of £1,150,000, Hogs Back at an average of £860,416 and Spoil Lane at an average of £746,666.
What streets have the most affordable properties for sale in Ash South And Tongham?
The streets with the most affordable properties for sale in Ash South And Tongham are The Elms at an average of £200,000, Yeomans Close at an average of £220,000 and Tongham Meadows at an average of £227,500.
Which train stations are available in or near Ash South And Tongham?
Some of the train stations available in or near Ash South And Tongham are Ash, Aldershot and Ash Vale.
Property Price Paid in Ash South And Tongham by Year
The average sold property price by year was:
| Year | Average Sold Price | Price Change |
Sold Properties
|
|---|---|---|---|
| 2025 | £414,627 | -12% |
51 Properties |
| 2024 | £462,389 | 6% |
57 Properties |
| 2023 | £435,458 | 2% |
58 Properties |
| 2022 | £427,366 | 9% |
70 Properties |
| 2021 | £389,728 | -0,4% |
94 Properties |
| 2020 | £391,411 | 1% |
51 Properties |
| 2019 | £389,066 | 8% |
92 Properties |
| 2018 | £357,536 | 4% |
61 Properties |
| 2017 | £342,485 | -6% |
60 Properties |
| 2016 | £363,100 | 5% |
78 Properties |
| 2015 | £343,312 | 28% |
109 Properties |
| 2014 | £247,198 | -1% |
72 Properties |
| 2013 | £249,197 | 1% |
61 Properties |
| 2012 | £246,984 | 3% |
42 Properties |
| 2011 | £238,541 | 3% |
35 Properties |
| 2010 | £231,705 | 10% |
47 Properties |
| 2009 | £208,002 | -30% |
53 Properties |
| 2008 | £269,889 | 20% |
41 Properties |
| 2007 | £214,784 | 4% |
85 Properties |
| 2006 | £206,943 | -8% |
96 Properties |
| 2005 | £223,567 | 2% |
69 Properties |
| 2004 | £219,076 | 18% |
85 Properties |
| 2003 | £179,974 | 9% |
100 Properties |
| 2002 | £163,672 | 21% |
97 Properties |
| 2001 | £128,758 | 7% |
110 Properties |
| 2000 | £120,219 | 5% |
73 Properties |
| 1999 | £114,470 | 16% |
88 Properties |
| 1998 | £95,615 | 7% |
96 Properties |
| 1997 | £89,098 | 9% |
121 Properties |
| 1996 | £80,669 | 25% |
57 Properties |
| 1995 | £60,553 | - |
41 Properties |
Property Price per Property Type in Ash South And Tongham
Here you can find historic sold price data in order to help with your property search.
The average Property Paid Price for specific property types in the last three years are:
| Property Type | Average Sold Price | Sold Properties |
|---|---|---|
| Semi Detached House | £422,672.00 | 54 Semi Detached Houses |
| Detached House | £693,729.00 | 37 Detached Houses |
| Terraced House | £362,814.00 | 54 Terraced Houses |
| Flat | £222,595.00 | 21 Flats |

