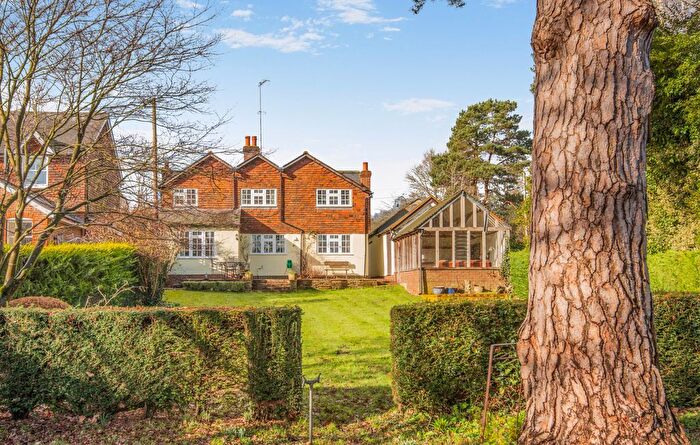
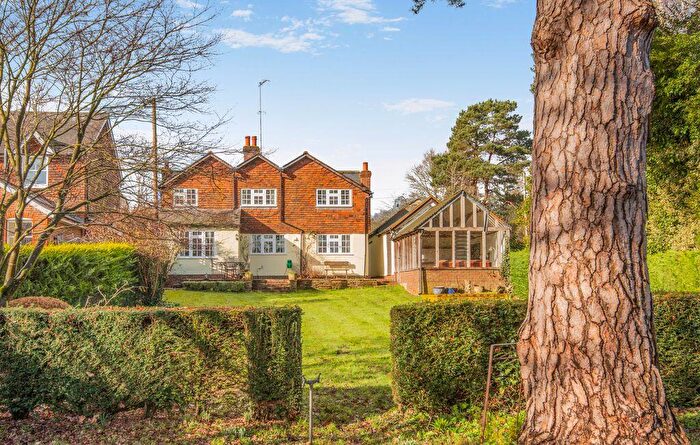
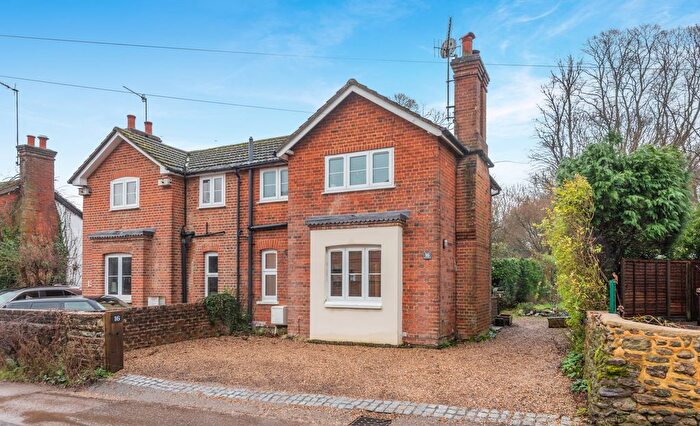
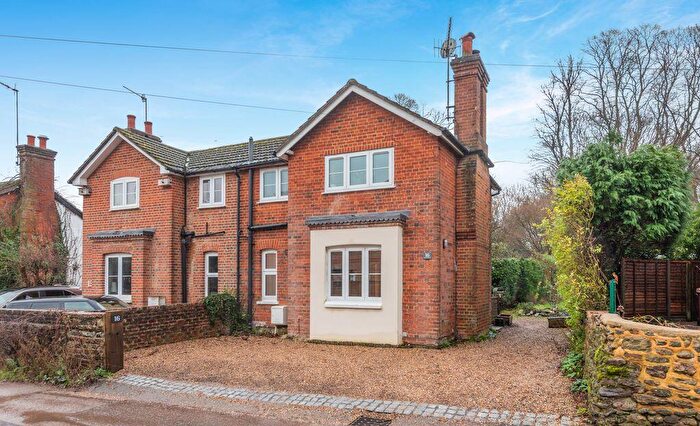
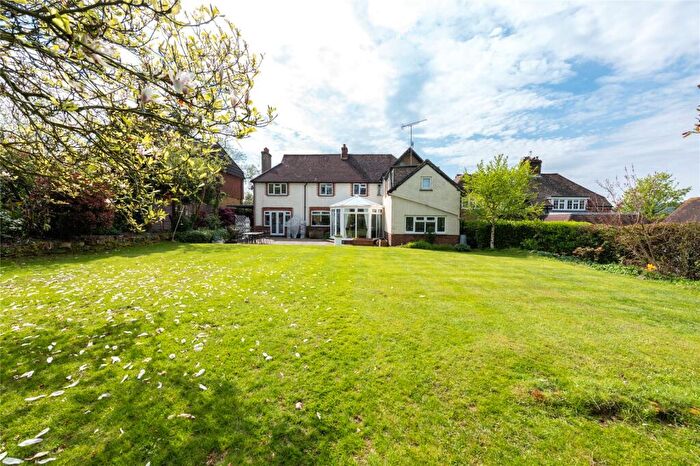
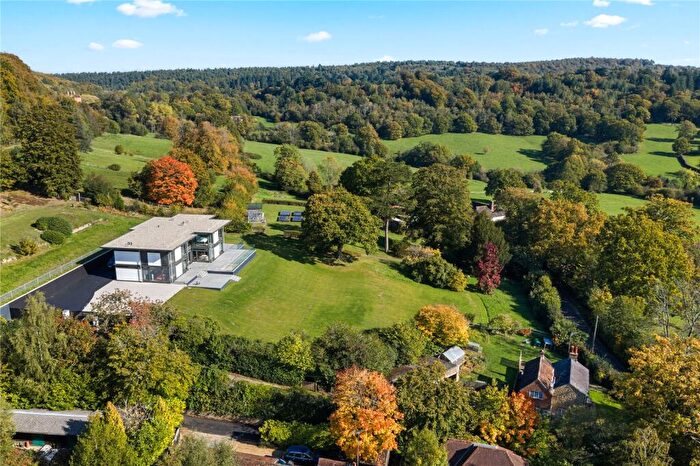
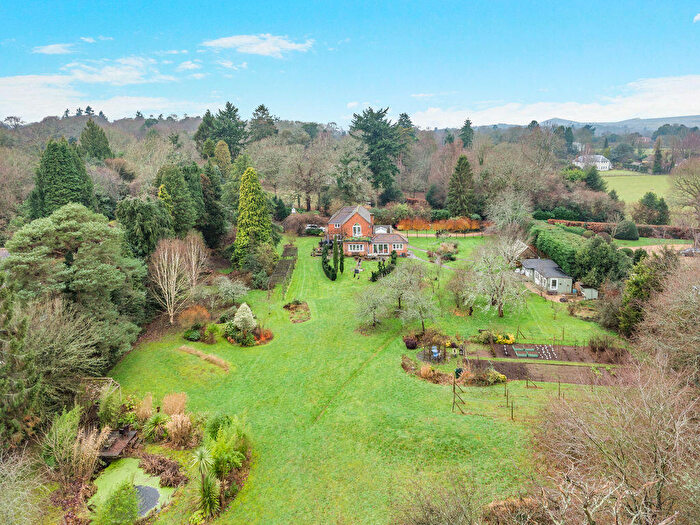
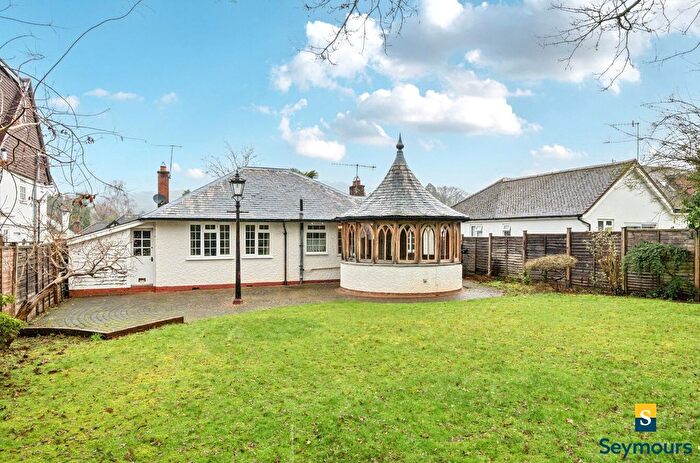
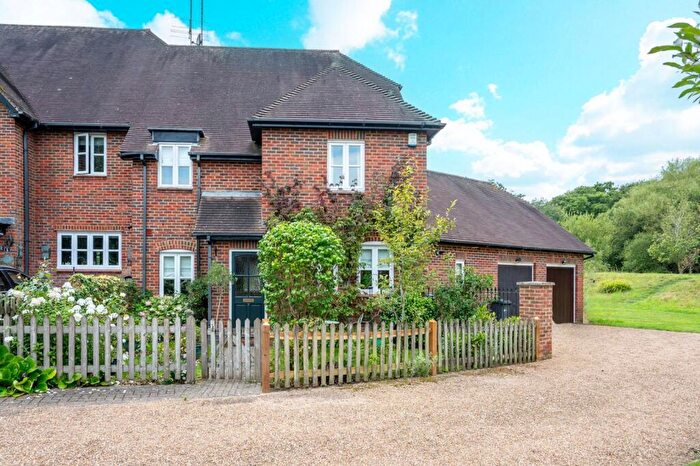
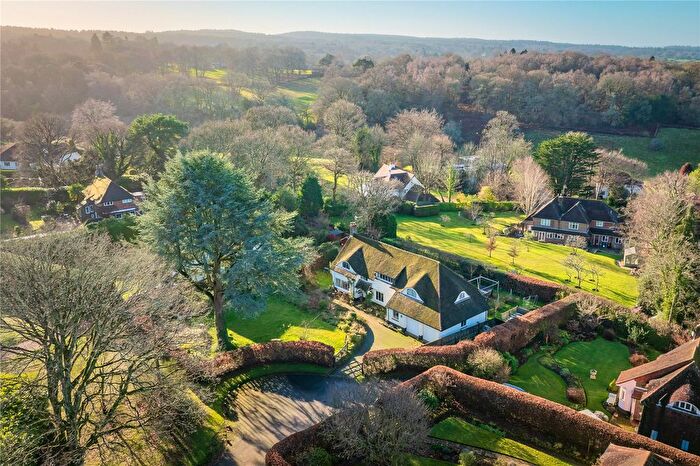
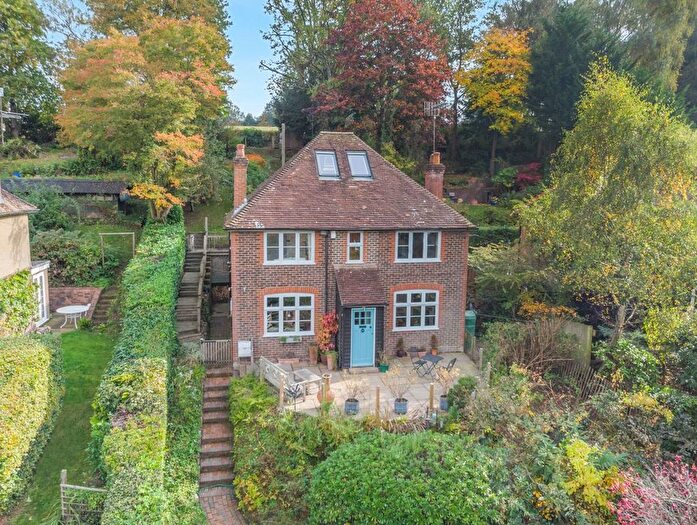
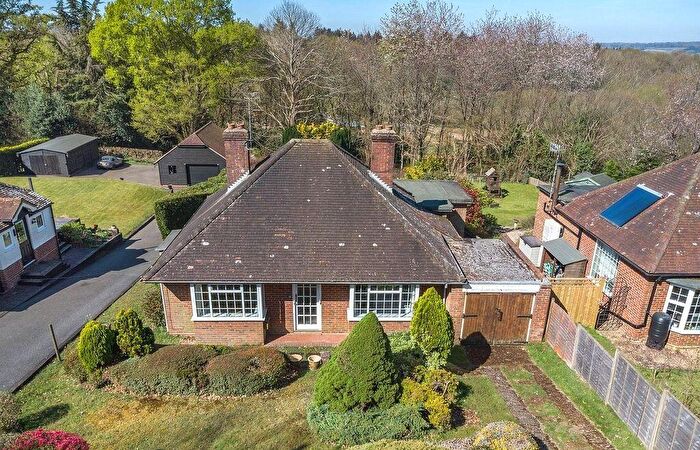
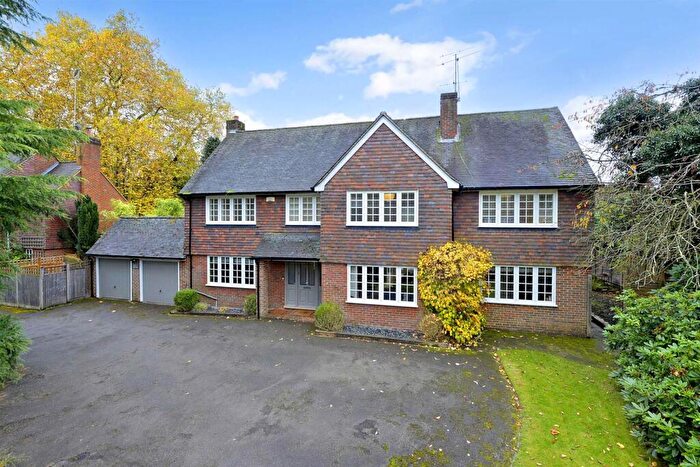
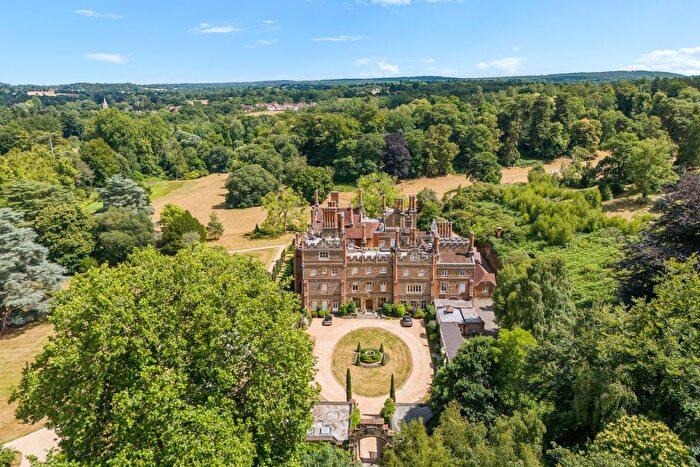
Houses for sale & to rent in Tillingbourne, Guildford
House Prices in Tillingbourne
Properties in Tillingbourne have an average house price of £967,971.00 and had 120 Property Transactions within the last 3 years¹.
Tillingbourne is an area in Guildford, Surrey with 1,907 households², where the most expensive property was sold for £5,200,000.00.
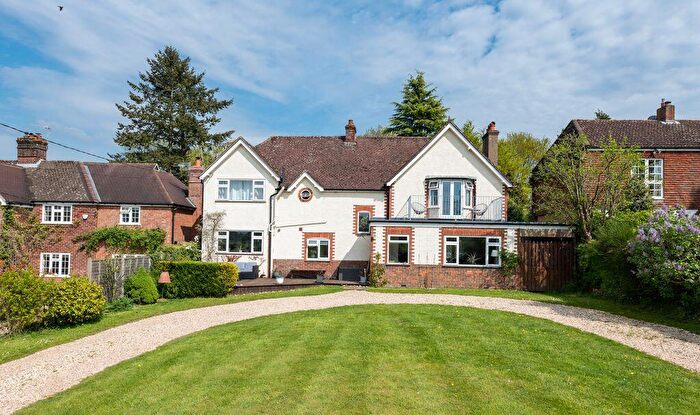
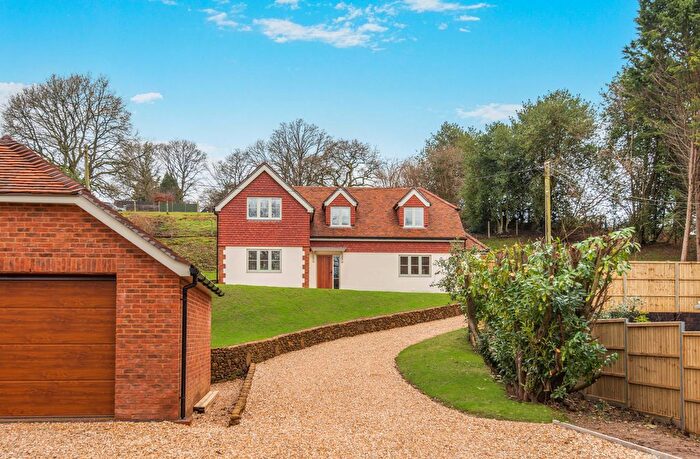
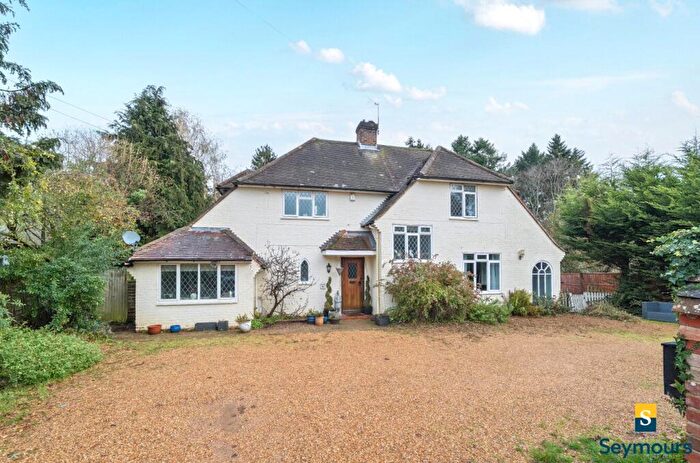
Properties for sale in Tillingbourne
Roads and Postcodes in Tillingbourne
Navigate through our locations to find the location of your next house in Tillingbourne, Guildford for sale or to rent.
| Streets | Postcodes |
|---|---|
| Albury Heath | GU5 9DB |
| Albury Park | GU5 9BB GU5 9BH GU5 9BS |
| Archery Place | GU5 9NL |
| August Lane | GU5 9DP |
| Birches Lane | GU5 9QR |
| Blackheath Lane | GU5 9AU GU5 9AT |
| Blacksmith Lane | GU4 8NF GU4 8NL GU4 8NQ |
| Broadfield Road | GU5 9RD GU5 9TB |
| Brook | GU5 9DJ |
| Brook Lane | GU5 9DH |
| Burrows Cross | GU5 9QF |
| Burrows Lane | GU5 9QE |
| Chantry Lane | GU5 9JB |
| Chilworth Road | GU5 9BE |
| Church Hill | GU5 9HJ GU5 9HL |
| Church Lane | GU5 9AJ GU5 9AL GU5 9HQ GU5 9AH GU5 9AN GU5 9AQ GU5 9AW GU5 9HH |
| Colekitchen Lane | GU5 9LH GU5 9QB |
| Colmans Hill | GU5 9ST |
| Coombe Bottom | GU5 9TD |
| Crest Hill | GU5 9PE |
| Cricketts Hill | GU5 9JY |
| Dorking Road | GU4 8BG GU4 8NR GU4 8NS GU4 8NT GU4 8NW GU4 8RF GU4 8RL GU4 8RR GU5 9NY GU4 8NP GU4 8RH GU4 8RJ GU4 8RN |
| Ewhurst Road | GU5 9RN GU5 9RW |
| Farley Green | GU5 9DL GU5 9DN GU5 9DW GU5 9EE |
| Farley Heath | GU5 9EW |
| Forrest Place | GU5 9BT |
| Franksfield | GU5 9SR GU5 9SS |
| Fulvens | GU5 9PG |
| Gasson Cottages | GU5 9TA |
| Gomshall Lane | GU5 9HB GU5 9HD GU5 9HE GU5 9BU GU5 9DR GU5 9JT |
| Gomshall Road | GU5 9HA |
| Goose Green | GU5 9LL GU5 9LW GU5 9LJ |
| Gravelpits Close | GU5 9BX |
| Gravelpits Lane | GU5 9LX |
| Guildford Lane | GU5 9BG |
| Halfpenny Close | GU4 8NH GU4 8NJ |
| Halfpenny Lane | GU4 8NN |
| Heath Lane | GU5 9DD |
| Heathrow | GU5 9QD |
| High View | GU5 9LT |
| Highfield Grange | GU5 9DT |
| Hoe Cottages | GU5 9SW |
| Hoe Lane | GU5 9SL GU5 9SN GU5 9SP GU5 9SU |
| Home Villas | GU5 9ER |
| Hook Lane | GU5 9QH GU5 9QJ GU5 9QQ |
| Hound House Road | GU5 9JG GU5 9JH GU5 9JJ |
| Hurtwood Lane | GU5 9JP |
| Jesses Lane | GU5 9RT |
| Kingsfield | GU5 9ED |
| Lawbrook Lane | GU5 9QN GU5 9QW |
| Leather Lane | GU5 9NB |
| Lenten Close | GU5 9RA |
| Little London | GU5 9DG |
| Lockhurst Hatch Lane | GU5 9EF GU5 9JN |
| Lockner Holt | GU4 8RG |
| Lower Street | GU5 9HT GU5 9HX |
| Mackies Hill | GU5 9RH |
| Middle Street | GU5 9HF |
| Mill Lane | GU4 8RP GU4 8RT GU4 8RU GU4 8RW |
| Mill Reach | GU5 9BA |
| Netley Close | GU5 9ND |
| New Road | GU5 9LZ GU5 9BY GU5 9DA |
| Newlands Corner | GU4 8SE |
| Old Bakery Mews | GU5 9AE |
| Orchard Road | GU5 9HU |
| Park Road | GU5 9DF |
| Parklands | GU5 9JQ |
| Pathfields | GU5 9HP |
| Peaslake Lane | GU5 9RJ GU5 9RL GU5 9SY |
| Pilgrims Close | GU5 9JR |
| Pilgrims Way | GU5 9HR |
| Pine View Close | GU4 8RS |
| Plaws Hill | GU5 9SX |
| Pond Lane | GU5 9RS |
| Ponds Lane | GU5 9DQ GU5 9JL |
| Powder Mills Place | GU4 8BF |
| Pursers Lane | GU5 9PD GU5 9RE GU5 9RG GU5 9SJ |
| Pursers Lea | GU5 9RB |
| Queen Street | GU5 9LU GU5 9LY GU5 9DS |
| Rad Lane | GU5 9PB |
| Radnor Road | GU5 9SZ |
| Rectory Lane | GU5 9HZ |
| Redwood Grove | GU4 8NU |
| Rose Cottages | GU5 9RP |
| Roseacre Gardens | GU4 8RQ |
| Row Lane | GU5 9EJ GU5 9EL GU5 9JW |
| Sample Oak Lane | GU4 8QN GU4 8QP GU4 8QW GU4 8RE |
| Sandy Lane | GU5 9QL |
| Sherbourne | GU5 9BJ |
| Shere Lane | GU5 9HS |
| Shere Road | GU4 8SH GU5 9BW GU5 9BL GU5 9BN GU5 9JD GU5 9LG GU5 9QA |
| Shophouse Lane | GU5 9EG GU5 9EQ GU5 9ET GU5 9EH |
| Staple Lane | GU5 9TE |
| Station Approach | GU5 9NU GU5 9NX |
| Station Road | GU5 9LA GU5 9LD GU5 9LF GU5 9LQ GU5 9NP GU5 9LB GU5 9LE GU5 9NR |
| Sweet Lane | GU5 9SH |
| The Maltings | GU5 9LN |
| The Spinning Walk | GU5 9HN |
| The Square | GU5 9HG |
| The Street | GU5 9AB GU5 9AD GU5 9AX GU5 9BF GU5 9AY GU5 9BZ |
| Tillingbourne Mews | GU5 9AG |
| Tower Hill | GU5 9LP GU5 9LR GU5 9LS |
| Tower Hill Rise | GU5 9NA |
| Upper Street | GU5 9JA GU5 9JE GU5 9JF |
| Walking Bottom | GU5 9RR |
| Warners Lane | GU5 9DE |
| Water Lane | GU5 9BD |
| Wellers Court | GU5 9JU |
| Weston Yard | GU5 9AF |
| Westonfields | GU5 9AR |
| White Lane | GU5 9BQ |
| Willow Walk | GU5 9HY |
| Wonham Way | GU5 9NZ GU5 9PA |
| GU4 8RD GU5 9RQ |
Transport near Tillingbourne
-
Gomshall Station
-
Chilworth Station
-
Clandon Station
-
Shalford Station
-
London Road Guildford Station
-
Guildford Station
-
Horsley Station
- FAQ
- Price Paid By Year
- Property Type Price
Frequently asked questions about Tillingbourne
What is the average price for a property for sale in Tillingbourne?
The average price for a property for sale in Tillingbourne is £967,971. This amount is 57% higher than the average price in Guildford. There are 940 property listings for sale in Tillingbourne.
What streets have the most expensive properties for sale in Tillingbourne?
The streets with the most expensive properties for sale in Tillingbourne are Shophouse Lane at an average of £3,197,500, The Spinning Walk at an average of £2,825,000 and Church Hill at an average of £2,500,000.
What streets have the most affordable properties for sale in Tillingbourne?
The streets with the most affordable properties for sale in Tillingbourne are Pathfields at an average of £327,000, Westonfields at an average of £417,500 and Middle Street at an average of £455,000.
Which train stations are available in or near Tillingbourne?
Some of the train stations available in or near Tillingbourne are Gomshall, Chilworth and Clandon.
Property Price Paid in Tillingbourne by Year
The average sold property price by year was:
| Year | Average Sold Price | Price Change |
Sold Properties
|
|---|---|---|---|
| 2025 | £1,094,903 | 21% |
31 Properties |
| 2024 | £865,104 | -11% |
36 Properties |
| 2023 | £963,600 | -5% |
53 Properties |
| 2022 | £1,007,405 | 11% |
58 Properties |
| 2021 | £895,692 | 10% |
92 Properties |
| 2020 | £807,385 | 2% |
55 Properties |
| 2019 | £793,434 | 10% |
61 Properties |
| 2018 | £714,757 | -14% |
42 Properties |
| 2017 | £813,528 | -8% |
42 Properties |
| 2016 | £882,163 | 27% |
70 Properties |
| 2015 | £645,097 | -12% |
68 Properties |
| 2014 | £723,162 | 22% |
62 Properties |
| 2013 | £562,339 | 5% |
68 Properties |
| 2012 | £536,991 | -40% |
65 Properties |
| 2011 | £752,122 | 11% |
46 Properties |
| 2010 | £669,834 | 8% |
66 Properties |
| 2009 | £613,525 | 28% |
72 Properties |
| 2008 | £441,144 | -41% |
50 Properties |
| 2007 | £621,053 | 28% |
81 Properties |
| 2006 | £447,625 | 8% |
80 Properties |
| 2005 | £411,880 | -36% |
75 Properties |
| 2004 | £559,737 | 9% |
68 Properties |
| 2003 | £508,328 | 22% |
62 Properties |
| 2002 | £398,268 | 9% |
82 Properties |
| 2001 | £362,960 | 5% |
71 Properties |
| 2000 | £344,842 | 2% |
99 Properties |
| 1999 | £338,592 | 14% |
66 Properties |
| 1998 | £290,679 | 16% |
79 Properties |
| 1997 | £245,023 | 15% |
78 Properties |
| 1996 | £207,083 | 16% |
61 Properties |
| 1995 | £173,604 | - |
41 Properties |
Property Price per Property Type in Tillingbourne
Here you can find historic sold price data in order to help with your property search.
The average Property Paid Price for specific property types in the last three years are:
| Property Type | Average Sold Price | Sold Properties |
|---|---|---|
| Flat | £586,555.00 | 9 Flats |
| Semi Detached House | £739,078.00 | 35 Semi Detached Houses |
| Detached House | £1,312,297.00 | 55 Detached Houses |
| Terraced House | £611,119.00 | 21 Terraced Houses |

